31 Provinces’ Computing Power Integrated into the Grid: Huoshi Industrial Intelligence Unveils Five Regional Competition Trends
 09/15 2026
 532
532
At the 2026 China Computing Power Conference opening ceremony, the China Computing Power Platform achieved nationwide integrated monitoring and coordination of computing resources. Platforms from all 31 provinces, autonomous regions, and municipalities were connected to the network, marking the foundational establishment of a ‘one network, one strategy, and one integration’ development pattern for computing power across China.
From 10 pilot projects in 2025 to full nationwide integration this year, the transition took just one year. Now that the spatial distribution of computing power has been redefined, how will the dynamics of regional competition evolve? What will be the focal points of future competition? We posed these questions to the ‘Huoshi Xinglan’ industrial intelligence desktop platform, which leverages AI experts to provide in-depth insights.
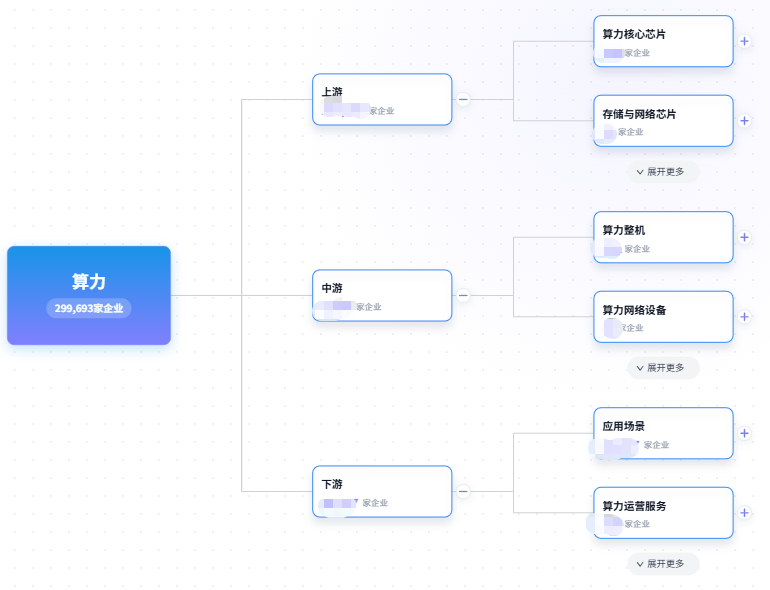 Panoramic Map of the Computing Power Industry Chain by Huoshi Xinglan Industrial Intelligence (Partial) Source: Huoshi Xinglan Industrial Intelligence Desktop Platform
Spatial Framework Established: Highly Concentrated, Yet the East Remains Vibrant
China’s national-level spatial framework for computing power can be summarized as ‘8+10+3’: eight national computing power hubs, ten national data center clusters, and three regions for coordinated development of computing power and electricity. The ten clusters include Zhangjiakou, the Yangtze River Delta Ecological Green Integrated Development Demonstration Zone, Wuhu, Shaoguan, Tianfu, Chongqing, Gui’an, Hohhot, Qingyang, and Zhongwei. This framework, approved by the National Development and Reform Commission in 2022, continues to serve as the foundational reference for understanding China’s computing power landscape today.
Figure: Overview of Core Indicators for National Intelligent Computing Power and Network Infrastructure Construction 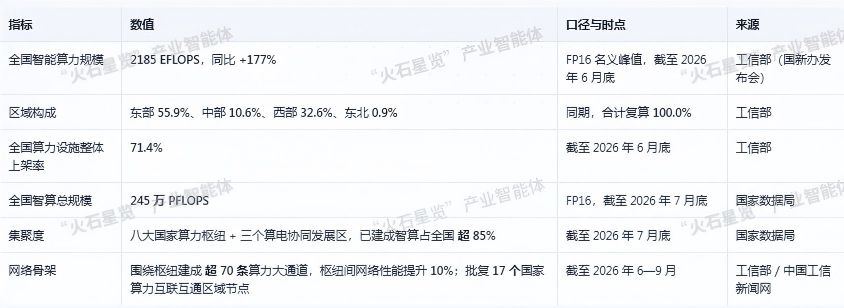 Source: Huoshi Xinglan Industrial Intelligence Desktop Platform
In terms of regional intelligent computing power scale composition, as of the end of June 2026, the East accounts for 55.9%, the Central region 10.6%, the West 32.6%, and the Northeast 0.9%. Together, the East and Central regions account for 66.5%, while the West and Northeast account for 33.5%, with a ratio of approximately 1.99. The eight national computing power hubs and three coordinated development regions for computing power and electricity account for over 85% of the nation’s intelligent computing power. As of the end of July 2026, the total national intelligent computing power scale reached 2.45 million PFLOPS, with 1.45 million PFLOPS included in the national-level monitoring and scheduling platform.
‘Over 85% concentrated in hubs’ refers to supply locations, while ‘55.9% in the East’ indicates where demand-intensive areas remain. This demonstrates that the West undertakes relocatable, delay-tolerant, and low-electricity-price or green-electricity-seeking capacity loads, while the East and Central regions continue to carry high-demand-density, latency-sensitive inference and application loads.
Location-Based Pricing Power: From ‘Proximity to Customers’ to ‘Proximity to Power and Feasibility of Construction’
Data shows that electricity costs account for 56.7% of data center operating costs, making it the top expense item. In 2025, national computing power centers consumed approximately 170 billion kWh of electricity, accounting for about 1.6% of total societal electricity consumption. The comprehensive household electricity price in Western hubs is approximately 0.31–0.398 yuan/kWh, about half of the industrial electricity price in the East. In terms of water resources, data center Water Usage Effectiveness (WUE) has been included in national management standards since December 2025. Ningxia Zhongwei’s ‘14th Five-Year Plan’ industrial water withdrawal quota is only 56 million cubic meters, subject to rigid constraints from the Yellow River water allocation scheme. Internationally, New York State in the U.S. suspended approvals for large data centers due to water consumption in July 2026. JLL’s 2026 Global Data Center Outlook lists ‘power supply speed’ as the primary criterion for site selection, followed by community support, latency, and proximity to customers.
From this, it can be inferred that electricity prices determine the cost curve, while power distribution capacity and grid connection timing determine whether a project can proceed. In 2026, the primary constraint reported by frontline sources has shifted from ‘inability to purchase electricity’ to ‘inability to secure power distribution capacity.’ The truly scarce resources in China’s Western hubs are no longer electricity volume but grid connection timing, power distribution quotas, and water withdrawal allowances—which directly determine which hubs can deliver on promises and which will remain at the signing stage.
Reversal in Demand-Side Structure: The Most Certain Layout Variable
The reversal in demand-side structure is the biggest driver of changes in layout logic after 2026. Data from the National Development and Reform Commission shows that as of March 2026, inference computing power accounts for about 60% of China’s total, while training accounts for about 40%. IDC data shows that in 2024, training accounted for 76% of GenAI IaaS, with inference at 24%; in 2025, inference exceeded 50%. It is predicted that by 2026, global inference loads will account for about two-thirds, and by 2027, over 70%. The National Information Center divides the construction of the computing power network into three stages, with the third stage starting in 2026, against the backdrop of inference demand beginning to exceed training demand: training can be concentrated in the low-cost West, while inference must be deployed close to the user side.
Overall, the location flexibility for inference is much lower than for training. Therefore, the East will not be depleted but will continue to expand in the form of ‘high-density inference clusters + edge nodes’; the West will undertake delay-tolerant and relocatable capacity loads. Supporting hard indicators are also changing: power conditions, green electricity proportion, power density per cabinet, and liquid cooling capacity have become core indicators for measuring data center value. Traditional cabinets range from 4–8 kW, AI cabinets typically range from 30–60 kW, and liquid-cooled cabinets exceed 100 kW—resulting in a five- to tenfold increase in electricity load for the same data center room area.
Evaluating Regional AI Competitiveness: Large Computing Power Provinces ≠ Strong AI Provinces
The ‘2026 Comprehensive Computing Power Panoramic Analysis’ by the China Academy of Information and Communications Technology points out that only seven provinces in China have intelligent computing center utilization rates exceeding 75%, with computing power supply continuing to concentrate in leading provinces and national hubs.
Meanwhile, the report evaluates provinces across five dimensions: computing power, storage capacity, network capacity, model capability, and environment. Notably, Beijing, Shanghai, and Guangdong excel in the ‘computing and modeling’ (large model development and ecosystem) dimension, while Xinjiang, Gansu, and Qinghai have advantages in ‘resource environment.’ He Baohong, Chief Engineer at the Academy, explicitly stated at the conference that many regions simply equate computing power with the scale of computing chips, neglecting the coordination of storage capacity, network capacity, and industrial environment. Without synchronization among these three, even a vast scale of computing power cannot release actual productivity.
Table: Three-Tier Division of Computing Power
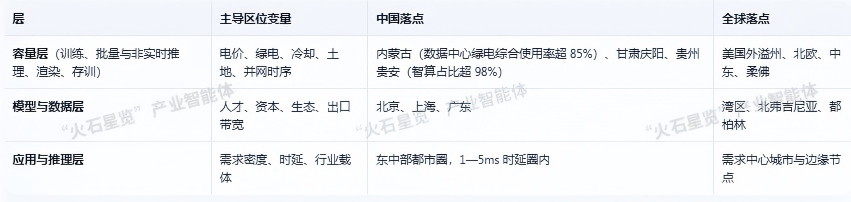 Source: Huoshi Xinglan Industrial Intelligence Desktop Platform
Therefore, evaluating regional AI competitiveness based on rankings of EFLOPS or cabinet numbers will systematically overestimate capacity output regions and underestimate core Eastern cities with demand but lacking energy consumption quotas.
The Next Shakeout: Focus on ‘Effective Computing Power,’ with Long-Tail Elimination Highly Likely
Currently, demand for intelligent computing remains strong, with internet cloud providers, operators, third-party vendors, and even model companies all building computing power and actively planning expansions. On the flip side, a thousand-card intelligent computing center in a Western city has a utilization rate of less than 50%, with actual server utilization of less than 30% and annual operating costs exceeding 30 million yuan. Inspur Artificial Intelligence Research Institute estimates the average utilization rate of intelligent computing centers nationwide at around 30%. Meanwhile, leading AI firms claim ‘almost no idle GPUs,’ while general-purpose computing power demand growth is only 15%–20%.
Of course, individual cases cannot be used to conclude ‘national computing power oversupply,’ nor can official utilization rates deny idle capacity—both point to structural mismatches. With the leasing market shifting from scarcity to overcrowding and small players accelerating their exit, electricity price advantages are more likely to be absorbed by rental competition. Only computing power matched with real customers and tasks generates cash flow. Therefore, the elimination of long-tail projects is highly likely in 2027–2028.
In summary, for regions, the focus of competition has shifted from ‘competing for cabinet numbers’ to ‘competing for grid connection timing + power distribution capacity + green electricity delivery.’ Rankings by supply scale cannot compensate for gaps in hard constraints; basing investment promises solely on electricity prices carries the highest risk, as electricity price advantages will be absorbed by rental competition. The truly defensible combination is ‘deliverable power distribution capacity + operational green electricity direct connections + measured latency to demand centers.’
-
![]()
Is It Harder for Automakers to Profit as Car Sales Increase?
-
![]()
After Returning Operating Rights to Seres, How Far Can AITO Progress Post-Huawei's Exit?
-
![]()
Why Build 'Space Towers' When Phones Can Connect Directly to Satellites?
-
![]()
31 Provinces’ Computing Power Integrated into the Grid: Huoshi Industrial Intelligence Unveils Five Regional Competition Trends
-
![]()
Lotus Tech: AR Glasses Split into Two Camps: Lightweight AI HUD and AR Large-Screen Viewing/Spatial Computing Glasses
-
![]()
How Did AI Customer Service, Which Transfers Calls to Human Operators After 660 Seconds, Turn into a ‘Talking Wall’?
-
![]()
Xiaomi Xuanjie O3 Debuts, Qualcomm Reveals Next-Gen Snapdragon Platform, Paving the Way for the Agentic AI Era
-
![]()
Will New Energy Vehicle Prices Climb Following the Introduction of the Battery Tax?