
The Takeover Rate Metric Is Misleading Autonomous Driving R&D
 11/12 2026
 523
At present, the takeover rate appears to have become the primary metric for evaluating autonomous driving capability. Automakers tout zero takeovers over an entire trip at launch events, third-party evaluations rank systems by takeover counts per hundred kilometers, and consumers habitually ask whether a car's autonomous driving is reliable when choosing a vehicle.
But if one blindly pursues a low takeover rate, it is easy to overlook a key point: the takeover rate measures an outcome that can be strategically manipulated far more than it measures the system's ability to make correct decisions in real-world scenarios.
When R&D direction is driven by this number, the goal of system optimization easily shifts from driving the car well to making the number small.
01 What Exactly Is the Takeover Rate?
A takeover has never been a single action. The project initiation document of the China Intelligent Transportation Systems Industry Alliance defines takeover as the process in which driving control is transferred—fully or partially—from the automated driving system to the driver, and defines takeover performance as the driver's comprehensive execution of driving operations during that process.
This also shows that a takeover is a complete human-machine interaction chain involving system disengagement, request issuance, human perception, judgment, and operation. Its quality depends on whether the disengagement timing is reasonable, whether the request is clear, and whether the driver is in a state where they can intervene at that moment.
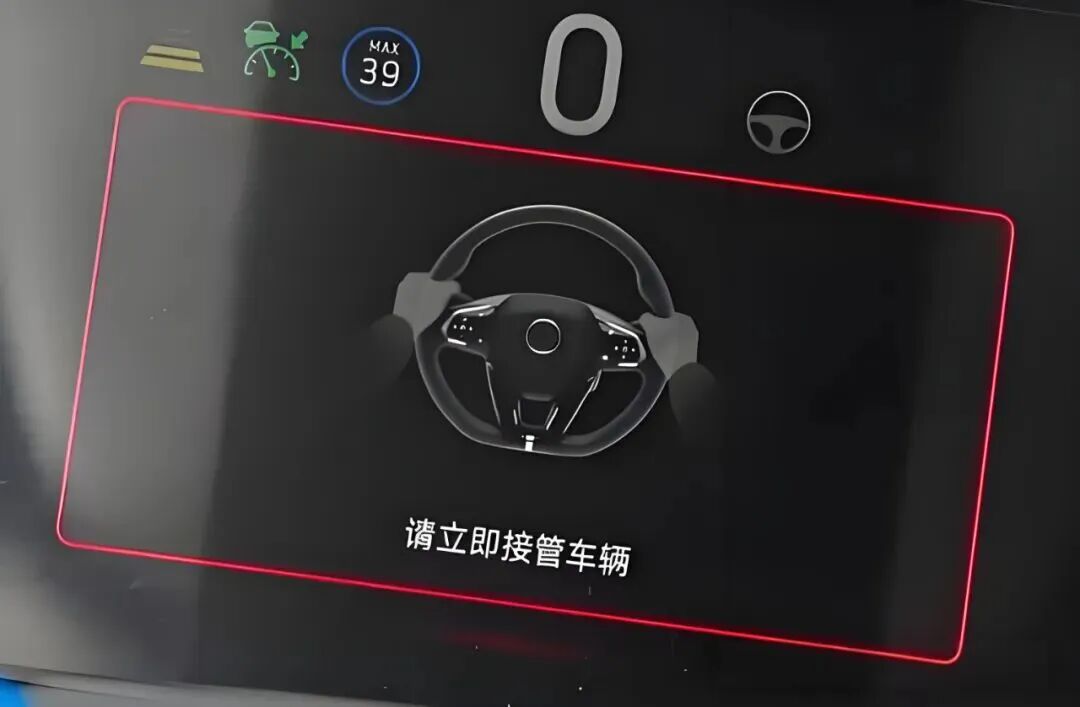 Image source: Internet
Takeover performance is also not a single-dimensional concept. It involves influencing factors, prediction models, improvement methods, and evaluation methods, and evaluation should consider both subjective and objective indicators.
But in many tests, the takeover rate compresses this multi-dimensional process into a ratio—namely, the number of manual takeovers within a given driving distance.
It does not record the system's confidence level when the takeover occurs, does not record whether the system had already attempted to handle the situation before disengaging, and does not distinguish whether the takeover happened because the system objectively could not handle it or because the driver subjectively did not want to wait.
Zhou Guang, CEO of DeepRoute.ai, once captured the significance of this order-of-magnitude difference in one sentence: "A takeover every few dozen kilometers and a takeover every thousand kilometers are completely different species."
But here, takeover is likewise an undifferentiated, broad concept. A takeover every few dozen kilometers—which kind of takeover is it? A takeover every thousand kilometers—which kind of takeover is it? Without separating them, the two systems may not be comparable at all.
In addition, the industry currently has no unified test scenarios and no public takeover data. Without unified test scenarios, public takeover data, or objective safety scores, whether a system actually performs well in ghost-probe, cut-in, and construction-zone situations depends entirely on what automakers say themselves.
Under such conditions, the takeover rate lacks an industry-wide quantitative pass line, yet it is still used as a basis for rankings.
02 Why This Number Lacks Even Stability
The premise for the widespread use of the takeover rate is that it is considered a comparable, reproducible objective metric. But reality suggests otherwise.
Takeover behavior is highly dependent on individual driver characteristics. People with lower trust in automated systems are more likely to actively take over in critical operations, while people with sufficiently high trust may still choose not to intervene even when the system is already approaching its capability boundary.
This means the takeover rate contains a considerable proportion of driver variables—variables unrelated to system capability.
For the same system, if a person more sensitive to risk drives it, the number of takeovers will rise; if a person more willing to let go drives it, the number of takeovers will fall.
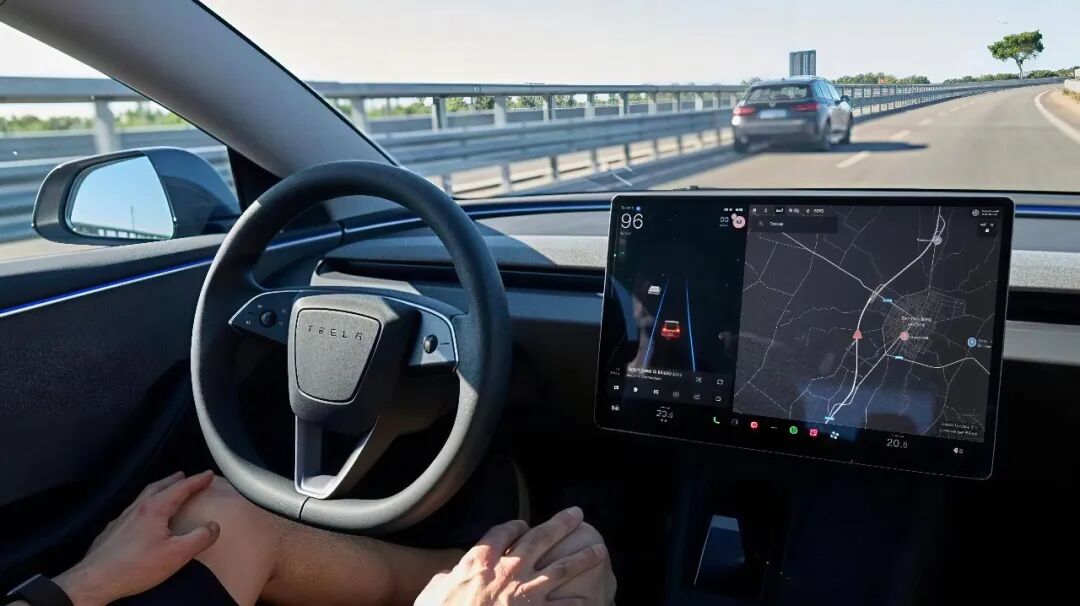
Image source: Internet
The statistical caliber is unchanged, capability is unchanged, but the number changes. At present, the takeover density of urban NOA is also at a relatively high level.
Statistics show that mainstream models require about 8 to 15 manual takeovers per hundred kilometers—equivalent to a takeover every 7 to 12 kilometers. Third-party real-world tests also show that the manual takeover rate in unprotected left-turn scenarios is close to half, and the takeover rate for right turns at intersections is also above 30%.
On this base, the fluctuation caused by driver behavior is enough to cover the limited gap between different systems.
When 8 and 12 are used as the basis for capability ranking, few people actually care how much of the difference of these 4 takeovers comes from the system and how much comes from the person sitting behind the steering wheel.
03 Disengagement and Inaction
How to make the takeover rate small: the takeover rate only counts how many times manual intervention occurred, but does not record what the system did before the intervention.
This blank space leaves ample room for strategic adjustment. Since the metric only looks at whether a person took over, the system can make an issue of whether to let people take over.
One approach is to actively disengage when confidence is insufficient—that is, the system stops working and returns control to the human, which statistically adds only one takeover. If this disengagement occurs at the edge of a scenario and is easy for the human to take over, it may not even be counted as a critical takeover.
From the perspective of system behavior, this is boundary management—stopping work beyond one's own capability. But from the perspective of the metric, active disengagement and system handling failure are actually mixed into the same count.
Insufficient system capability should originally manifest as doing something wrong; but once it chooses to disengage, it is no longer counted as an error, and instead appears as if the system knows it is incapable and prudently returns control to the human.
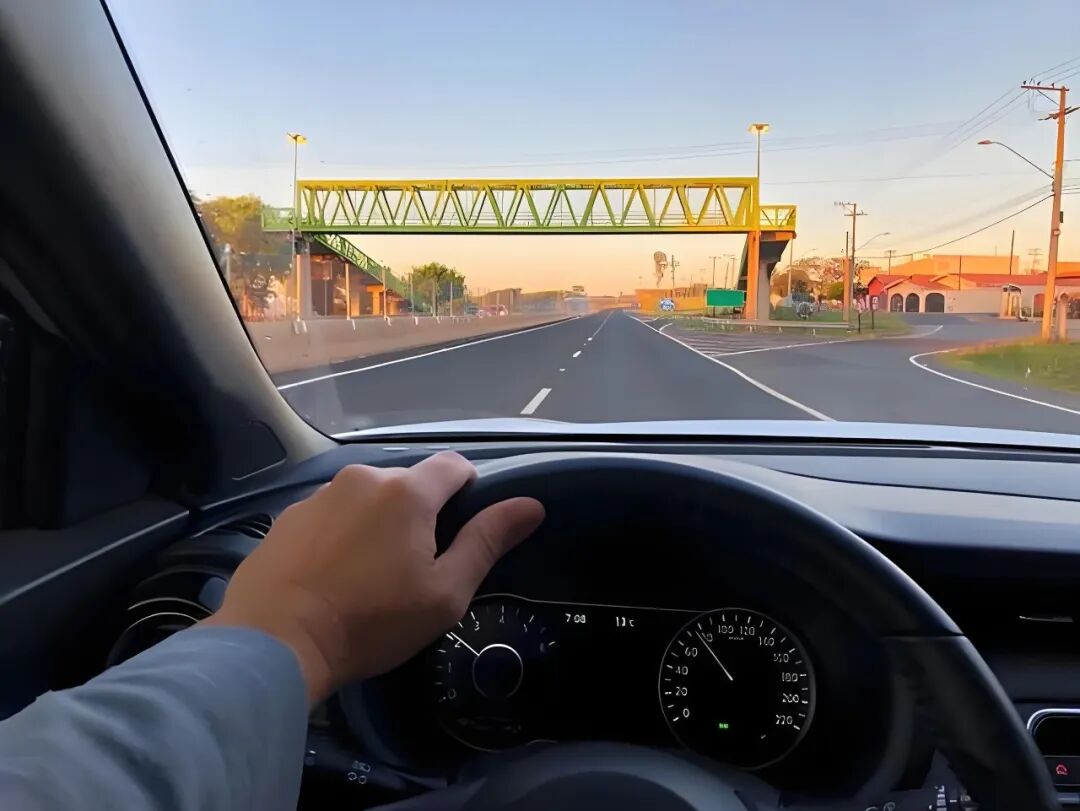 Image source: Internet
Another approach is that the system does not disengage, but also does not execute actions. That is, it does not change lanes when it should, does not merge when it should, does not detour when it should, and maintains cruising at a speed lower than traffic flow.
In this case, the takeover rate will certainly not rise, because the system simply does not enter those interactions that would create takeover risk. These systems will certainly also look good on the takeover rate, because they directly choose not to touch scenarios that would raise the number.
But there is actually a big difference between not doing things and doing them badly. Soochow Securities once classified takeovers in road tests into safety takeovers and non-safety takeovers. The former refers to necessary takeovers taken when functions objectively cannot be realized or danger is about to occur, while the latter refers to preventive takeovers based on the driver's subjective judgment.
As for this test, I will not discuss it in detail here. Interested readers can look it up themselves.
04 What the Takeover Rate Omits Is Precisely Decision Quality
The takeover rate measures the frequency of manual intervention, not the quality of the system's judgment before risk occurs, nor does it feed back whether the decisions made by the system without triggering a takeover are correct.
One system has few takeovers, but disengages at the last moment every time; another system has more takeovers, but every one occurs in the early stage of risk accumulation. The former has the advantage in takeover rate, while the latter has the advantage in decision quality.
But a single count cannot present this difference, nor can it capture situations where no takeover is triggered but the decision itself is wrong.
Phantom braking is the most typical example. The system does not return control to the human, but executes incorrect braking itself, so no takeover record is generated—but risk is generated.
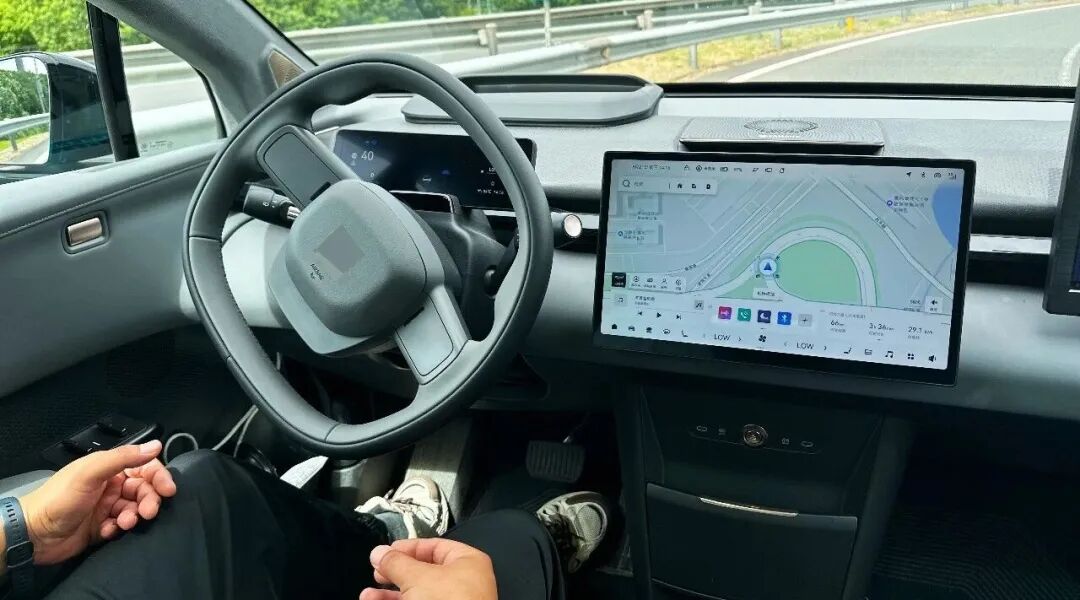 Image source: Internet
The takeover rate actually also cannot feed back what happened after the takeover. A system may appear decisive when disengaging, but the disengagement timing is too late, leaving an extremely short reaction window for the driver; another system may request takeover earlier, leaving enough time for the person to handle it.
The two may have the same number of takeovers, but their actual risk levels differ greatly. If the time window of the takeover request itself is insufficient to complete an effective human-machine handover, then the gap between "took over" and "safely took over" is far more important than the gap between takeover counts.
05 What Feedback Do Users Give?
If a low takeover rate truly reflects system capability, then systems with low takeover rates should be turned on and used more frequently by users. But the actual situation is not like that.
Data from the Ministry of Industry and Information Technology shows that since 2026, the penetration rate of L2-level combined driving assistance functions in domestic passenger cars has reached 70.5%, among which the penetration rate of NOA-equipped vehicles is 34.2%.
But an owner survey by Soochow Securities shows that only 31% of owners frequently use urban NOA functions, 20% explicitly say they dare not use it, and more than 70% of owners rarely use it or have never enabled it.
 Image source: Internet
Zhang Xiaoyu, executive vice president of Changan Automobile, also said at the TEDA Forum that the penetration rate of urban NOA reached 20.9%, but the usage rate was less than 6.3%.
The retention situation for highway NOA is also not ideal. Chen Yichi, CTO of KPIT, pointed out that the user retention rate after activation of highway NOA functions is about 60% to 70%, meaning that 30% to 40% of users who tried it ultimately chose to give up.
The gap between installation rate and activation rate actually points to a question that the takeover rate cannot answer—namely, whether the system exists in the feature list, and whether users are willing to let it work in real scenarios.
For a system with few takeovers but a high proportion of users actively turning it off, its low takeover rate may not reflect capability, but more likely that users have already made a judgment through their own behavior.
The person behind the steering wheel not turning it on already explains the system's usability in real scenarios.
06 Separate Safety Takeovers from Total Takeovers
The takeover rate is not without value. The main problem is that it indiscriminately counts interventions of different natures into the same number, and then uses this number to answer a question it cannot answer.
The MPCI (Miles Per Critical Intervention) proposed by Yu Kai of Horizon Robotics only includes takeovers related to collision risk in the calculation, rather than counting all manual interventions together.
In its framework, the MPCI of the industry's leading urban NOA has just reached 100 kilometers, corresponding to "usable"; 1,000 kilometers corresponds to "good to use"; to truly make users love to use it and adapt to L4-level scenarios such as Robotaxi, MPCI needs to reach more than 100,000 kilometers, and completing this series of order-of-magnitude leaps is expected to take 4 to 5 years.
Compared with only looking at the takeover rate, regulatory safety compliance requirements are actually more meaningful.
The "Safety Requirements for Combined Driving Assistance Systems of Intelligent Connected Vehicles" (GB 47955—2026), implemented from January 1, 2027, puts forward mandatory requirements for functional safety, test coverage, OTA control, and DMS monitoring.
When compliance becomes a common constraint for all players, what can truly still create differentiation is who can incorporate decision quality, traffic efficiency, and users' actual willingness to activate into the evaluation system.
The takeover rate can continue to exist, but it is more suitable as a clue that needs to be decomposed and cross-validated, rather than as the goal of R&D direction.
#AutonomousDrivingTakeoverRate
-
![]()
Jiuzhang Cloud's IPO: Can Computing Power Metrics Determine Pricing Power?
-
Cerebras' Stock Plunged 77% Within Six Months of Going Public—What Happened to Nvidia's "Challenger"?
-
![]()
01.AI Sets Up Headquarters in Hangzhou
-
![]()
The Three German Auto Giants Have All Stalled—What Exactly Happened to Them?
-
![]()
Great Wall Motor October Sales: Why Great Wall Has a Stronger Presence in the 200,000–300,000 Yuan Range Without Relying on 100,000-Yuan-Class Models
-
![]()
How Much of Li Auto's October Sales Beyond the L Series Can Its All-Electric Vehicles Capture?
-
Optical Module Order Cut Rumors Resurface
-
![]()
Domestic Competition Hits Rock Bottom—Can Going Global Save New Energy Vehicle Makers?