Betting Lives on Survival: Has Oracle's 'AI Gamble' Truly Paid Off?
 03/11 2026
 546
546
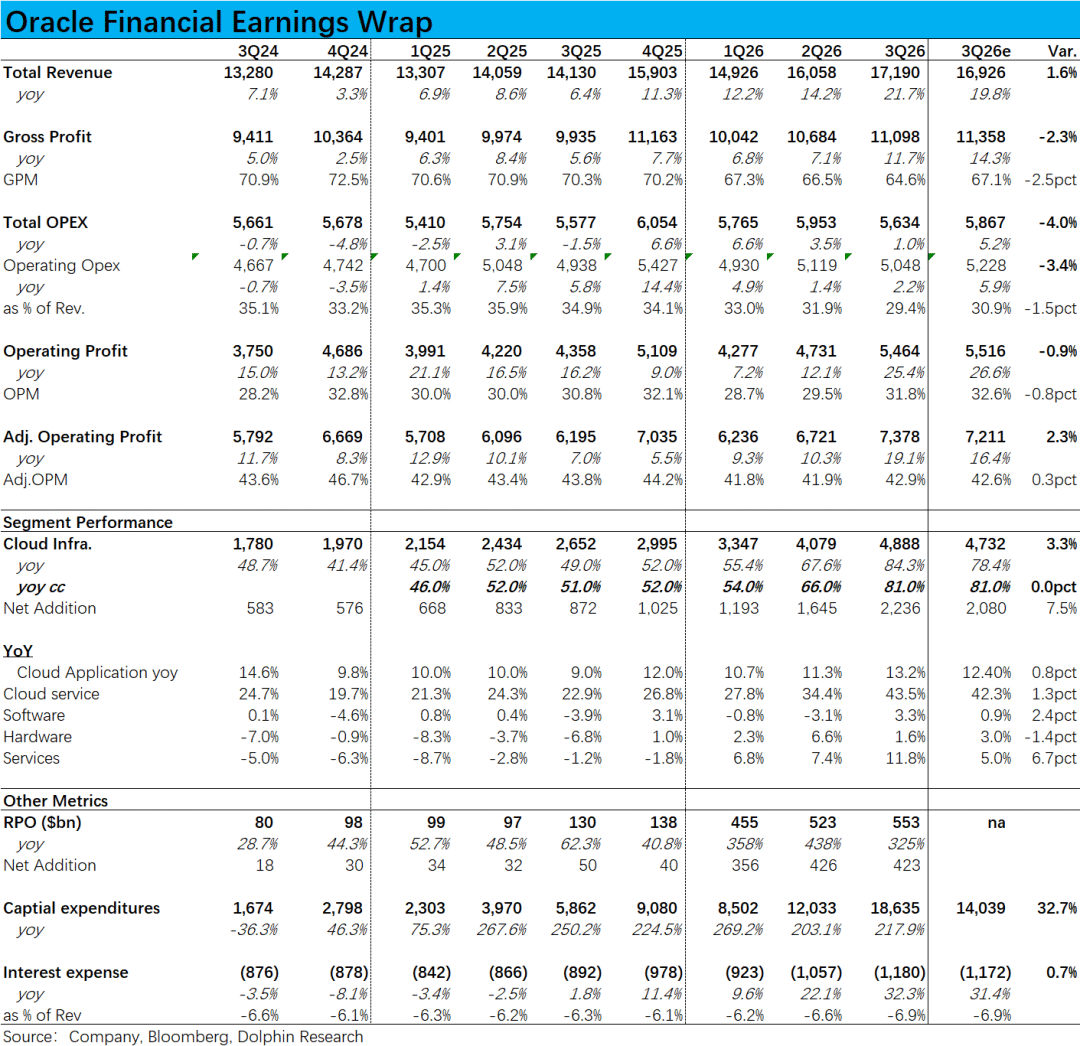
Oracle, the most controversial among the four major cloud giants, released its Q3FY26 results (as of the end of February) after the U.S. market closed this morning. Overall, the quarterly performance was a mixed bag: the positive was the continued strong and accelerating growth of its database and compute leasing-focused OCI business; the negative was the more severe-than-expected pressure on gross margins, along with unexpectedly rapid increases in both Capex and borrowing levels.
Thus, the overall performance for the quarter can only be considered neutral, with positives and negatives offsetting each other. The true highlight driving the company's after-hours stock price surge was its raised full-year guidance for FY27, from the previous range of $85-90 billion. Specifically:
1. Core Business - OCI Accelerates Growth as Expected: Under the cloud segment, IaaS-based OCI revenue reached $4.89 billion this quarter, growing 81% at constant currency (CC), significantly accelerating from 66% in the previous quarter. The year-over-year net revenue increase also surged 36% sequentially, marking a record high.
It is clear that OCI's growth momentum is accelerating, a positive signal. However, given high market expectations, this performance merely met rather than exceeded forecasts.
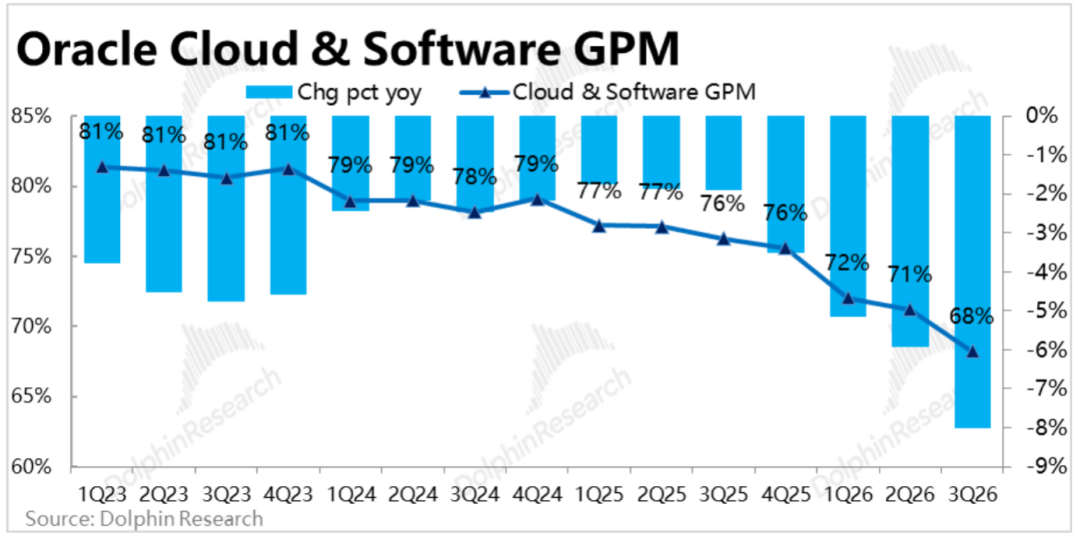
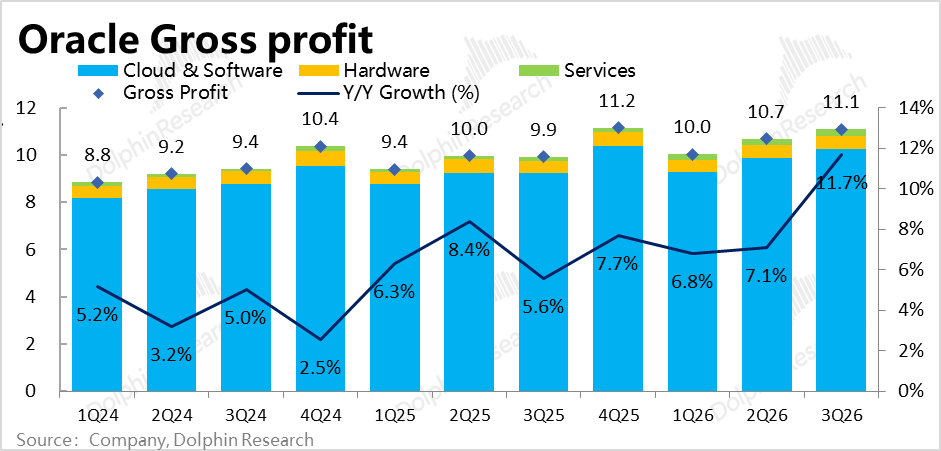
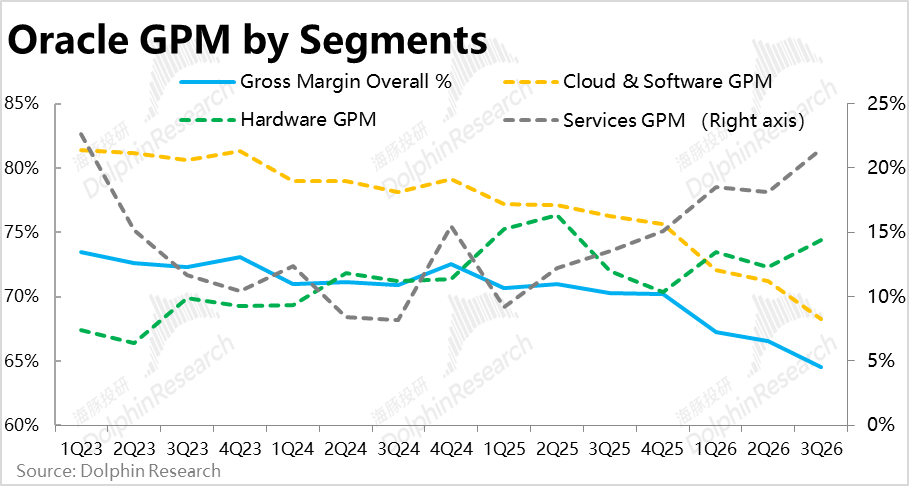
2. AI Business Drags on Gross Margins More Than Expected: As a concurrent effect of OCI's accelerated growth, the combined gross margin for cloud and software businesses (not separately disclosed) was approximately 68% this quarter, an 8 percentage point year-over-year decline, further widening from last quarter's 5.9 percentage point drop and falling short of market expectations.
Assuming software gross margins remained unchanged, the overall gross margin for cloud services may have fallen below 50%, with OCI's gross margin likely around 30%.
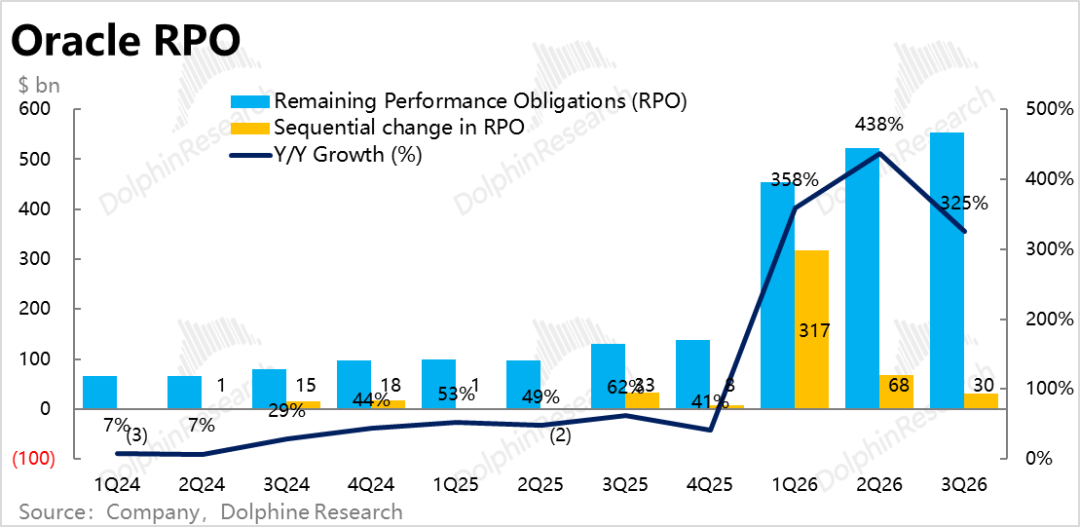
3. Leading Indicators Take a 'Half-Time Break': The remaining performance obligations (RPO), reflecting new order demand, increased by approximately $30 billion sequentially this quarter. After a massive order surge in Q1, new order volumes have declined sequentially over the past two quarters, offering no major surprises. Nevertheless, the absolute volume remains substantial, equivalent to six times this quarter's OCI revenue.
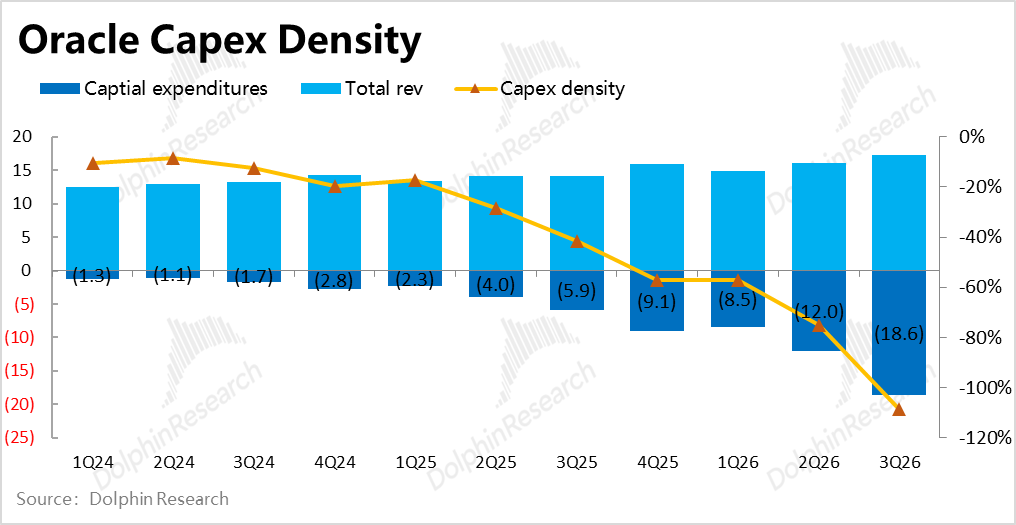
4. Capex Surges Higher: As a prerequisite for driving OCI growth, Capex reached $18.6 billion this quarter, up from $12 billion last quarter, setting a new record for sequential net increase.
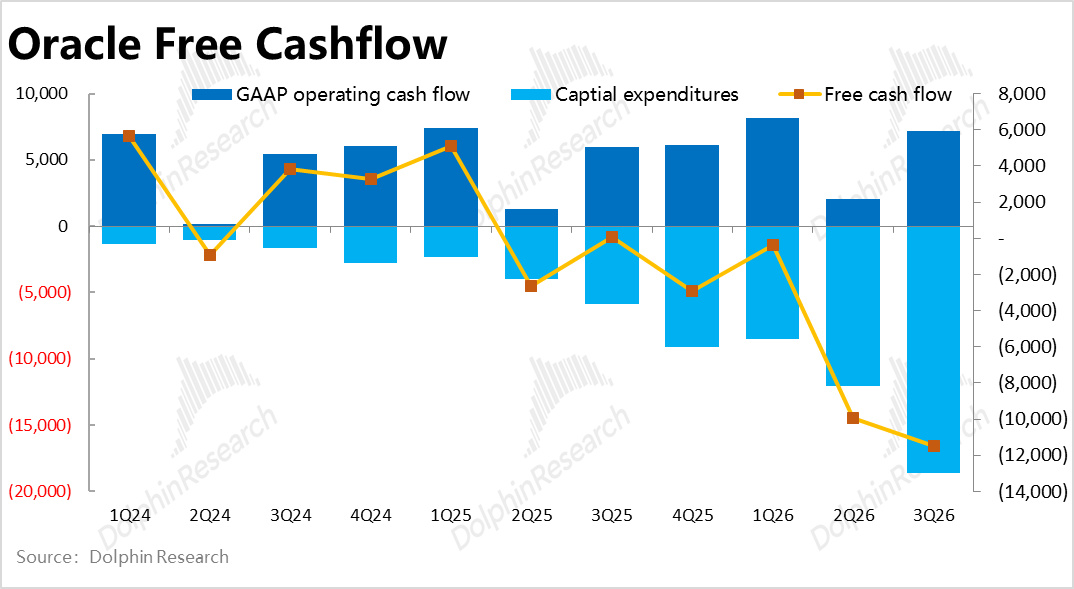
For the first time, the company's Capex exceeded total revenue this quarter, with free cash flow experiencing outflows of around $10 billion for two consecutive quarters. Such significant cash outflows necessitate substantial external financing.
However, based on the full-year FY26 Capex guidance of $50 billion, next quarter's investment is expected to decline significantly to approximately $12 billion.
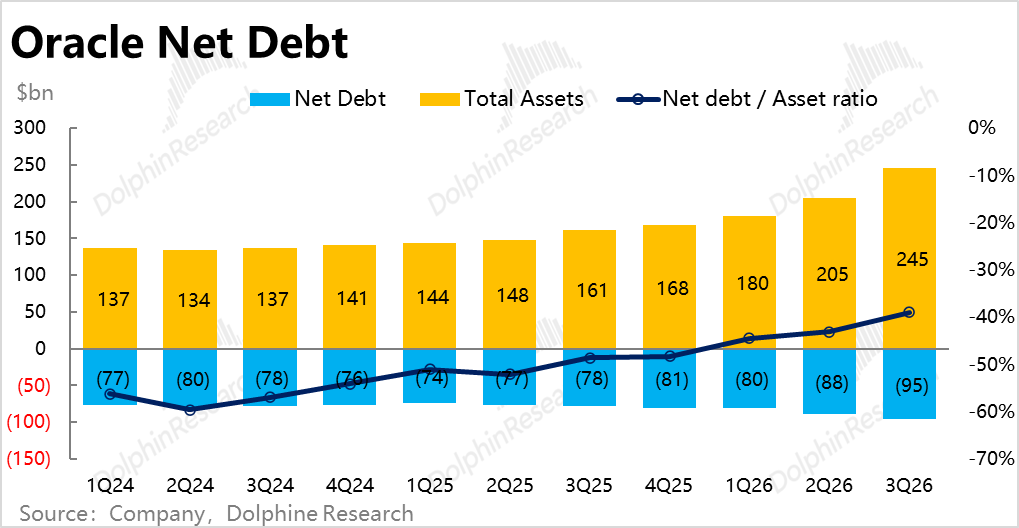
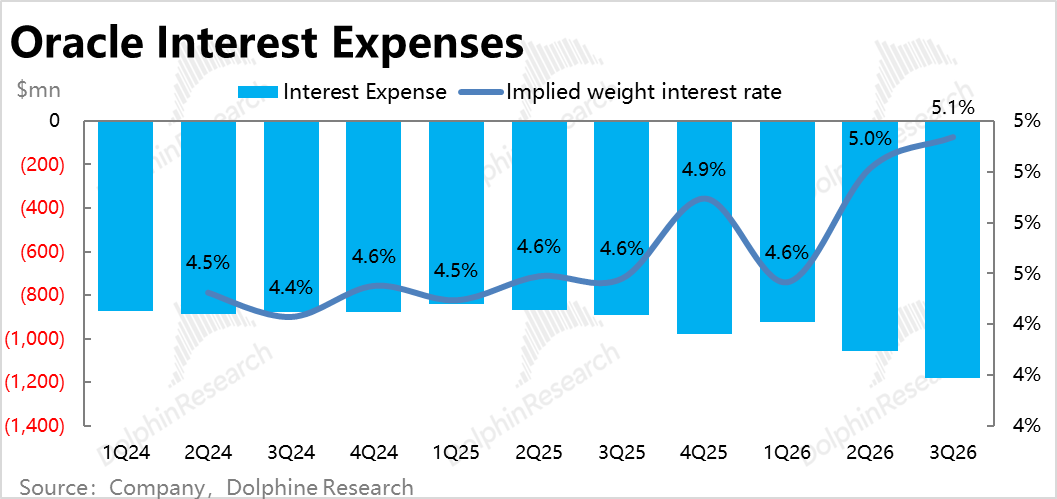
5. Of the previously announced $45-50 billion financing plan, approximately $30 billion was completed this quarter, including $25 billion in new debt issuance and $5 billion in preferred stock issuance. Net interest-bearing debt climbed to $95 billion, with a net debt-to-asset ratio of 39%.
Correspondingly, interest expenses reached $1.18 billion this quarter, up significantly by 32% year-over-year, with the proportion of total revenue increasing by approximately 0.3 percentage points sequentially.
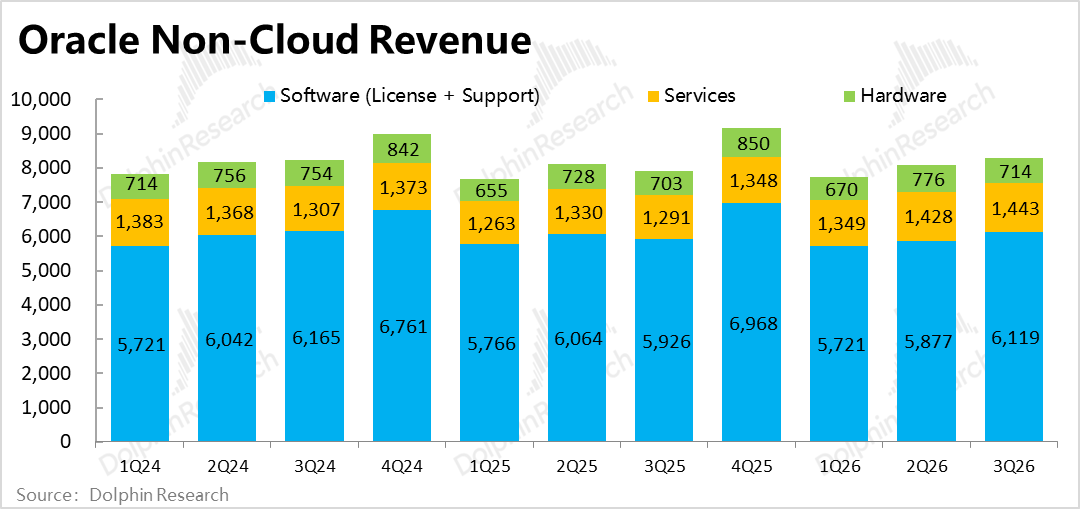
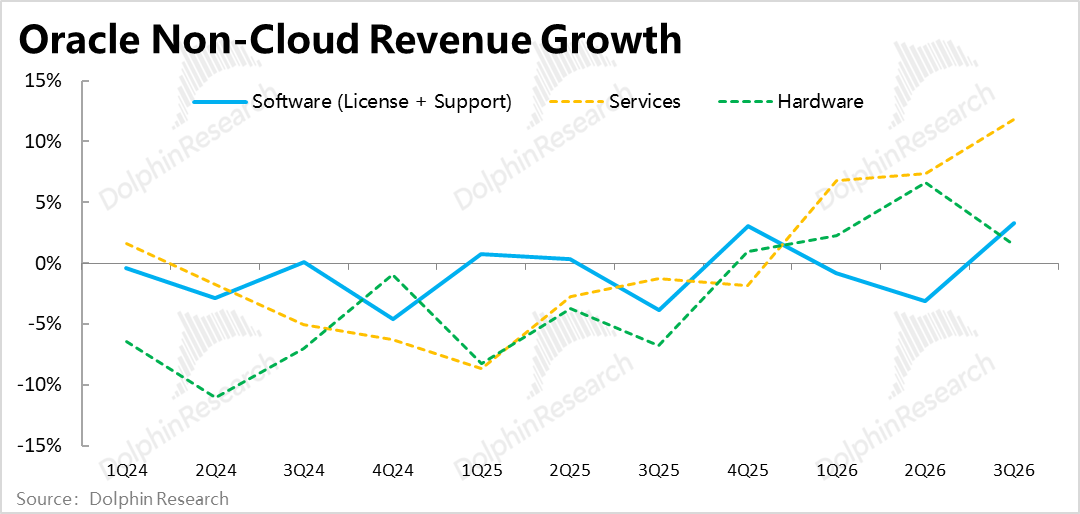
6. Other Businesses Remain Lackluster: Excluding OCI, SaaS revenue under the cloud segment grew 11% at CC, flat sequentially. After excluding foreign exchange benefits, traditional software and hardware revenues remained nearly stagnant or slightly declined, showing no improvement.
Only consulting services saw sustained acceleration in revenue growth, surpassing 10% this quarter—a decent performance, albeit with limited impact due to its smaller scale.
7. Overall Performance
a. Driven by OCI, the group's overall revenue growth rate notably surpassed the 20% threshold this quarter, a symbolic milestone. However, excluding foreign exchange benefits, revenue grew 18%, merely matching the upper limit of previous guidance and not exceeding expectations.
b. Although software/hardware gross margins actually improved, OCI's drag caused the group's overall gross margin to decline approximately 5.7 percentage points year-over-year to 64.6%, significantly below market expectations of 67%.
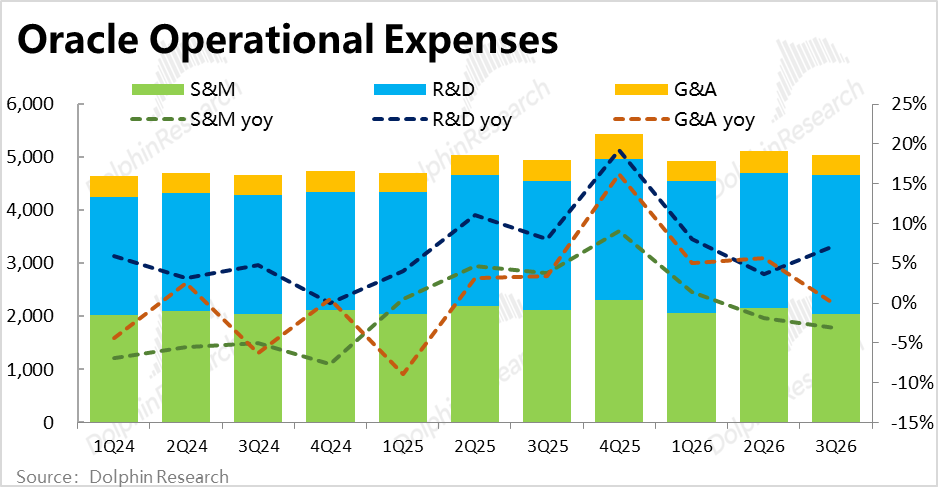
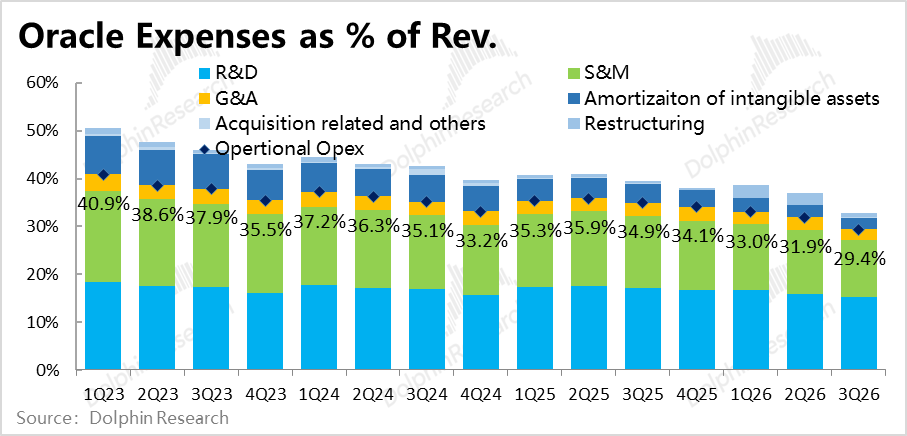
c. The three Regular operating expenses (regular operating expenses) grew only 2.2% year-over-year this quarter, well below market expectations of nearly 6%. This indicates that OCI's growth and investments have minimal impact on operating expenses.
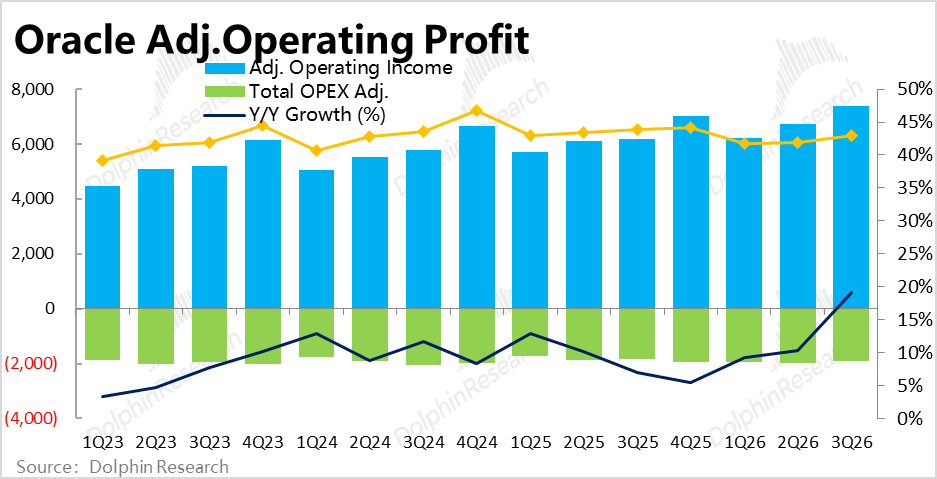
Due to excellent cost control, adjusted operating margin declined only 0.9 percentage points year-over-year, exceeding market expectations by approximately 0.3 percentage points. Adjusted operating profit reached $7.38 billion, up 19% year-over-year, slightly above market expectations.
8. Guidance - Short-term Inline, Medium-term Raised: For Q4FY26, focusing on the upper limit of guidance at CC, total revenue is expected to grow 20% year-over-year, with cloud services (IaaS + SaaS) growing 48% and adjusted diluted EPS growing 17%.
Trend-wise, the company expects both total revenue and cloud revenue growth to continue accelerating next quarter, with adjusted profit growth remaining largely stable. From an expectation gap perspective, the upper limit of guidance aligns with market expectations.
Dolphin Research View:
1. Before discussing this quarter's performance, Dolphin Research briefly outlines Oracle's current narrative and logic to better identify key areas of focus in the results.
First, the broader context: Excluding OCI (i.e., IaaS cloud services), all of Oracle's remaining traditional businesses lack growth, with long-term revenue growth hovering around zero or at low single-digit rates at best. Moreover, like other software companies, these traditional businesses face disruption risks from AI.
Thus, OCI represents Oracle's sole noteworthy segment, with key focuses on its revenue growth acceleration and RPO growth reflecting new demand. While single-quarter revenue performance cannot prove/disprove long-term guidance, it at least reflects short-term execution and capacity deployment success.
Beyond potential revenue growth, the market currently focuses on two other core issues: (1) whether OCI's AI-related business, driven by expensive GPUs and other Capex investments, will achieve significantly lower gross margins than existing businesses; and (2) the impact of Cloud & Software gross margin declines on estimating OCI's actual gross margin levels and trends.
Finally, as the company relies heavily on external financing to support OCI-related Capex, two concerns arise: (1) can Oracle secure sufficient funding? and (2) what impact will new debt/equity financing have on its balance sheet and income statement?
2. Based on these key focus areas, comparing actual Q3 performance reveals:
a. OCI's short-term growth and implied next-quarter guidance largely meet expectations, accelerating as anticipated. No standout highlight (highlights) in new RPO.
b. Market concerns about OCI dragging on gross margins are valid and worse than expected.
c. The worst-case scenario—Oracle being unable to secure financing—has been disproven with the announcement of a nearly $50 billion financing plan and $30 billion already raised this quarter. Current market sentiment and credit conditions are not that dire.
d. However, high Capex and debt levels have indeed dragged down gross margins and caused interest expenses to rise rapidly as a proportion of revenue/profit, negatively impacting the balance sheet and income statement.
Overall, these results do not represent a critical inflection point altering investment logic or narrative. Both bullish (OCI growth) and bearish (profit erosion, rising debt pressure) arguments have been validated this quarter.
The most significant change is Oracle's raised FY27 revenue guidance, from $85-90 billion previously, implying total revenue growth will accelerate to approximately 34% in FY27. This signals better-than-expected medium-term capacity deployment speed and progress, increasing visibility for achieving long-term FY2030 guidance.
3. Valuation Analysis: As Oracle's primary growth and controversy center on its IaaS business—especially OCI AI-related services—we analyze from two perspectives:
1) Excluding all impacts of OCI AI (e.g., incremental revenue, margin drag, additional Capex, debt/interest expenses), focusing solely on traditional businesses (software + hardware + services + SaaS + non-AI OCI) as the valuation floor;
2) Back-solving the market's implied valuation of OCI AI based on current market cap and comparing it to company guidance for reasonableness.
a. Traditional Businesses: SaaS, software, hardware, and services—largely mature segments—are expected to maintain low single-digit growth (below 3%).
For OCI, even without significant AI demand, it sustained approximately 50% revenue growth in FY22-24. Thus, non-AI OCI revenue is expected to grow around 35% CAGR in FY26-27.
Combined, total revenue could reach approximately $68 billion in FY27. Assuming gross margins decline slightly to 70% (no significant AI impact), and operating expenses grow at low single digits annually, FY27 after-tax profit excluding OCI AI could slightly exceed $20 billion.
****For a more detailed valuation analysis, refer to Dolphin Research's article in the Changqiao App's "Insights - Deep Dive (Research)" section.
In summary, while Oracle's stock price has fully erased all gains since the Stargate project and $300 billion order announcements, a strict perspective suggests:
If AI business prospects are disproven (e.g., OpenAI fails to fulfill contracts, or AI economic models underperform with low profitability), and AI is indeed invalidated, the resulting high debt and asset investments would create significant negative equity. Thus, traditional business valuation alone cannot fully support the current market cap.
However, if OCI AI delivers as guided in terms of revenue scale and gross margins, even under stringent assumptions, the market's current valuation implies very low multiples (15-17x) for both traditional and AI businesses. Future improvements in business narrative, market sentiment, and earnings certainty could drive valuation repairs and rises.
Below are key financial charts and business overviews:
I. Oracle's Business & Revenue Segmentation
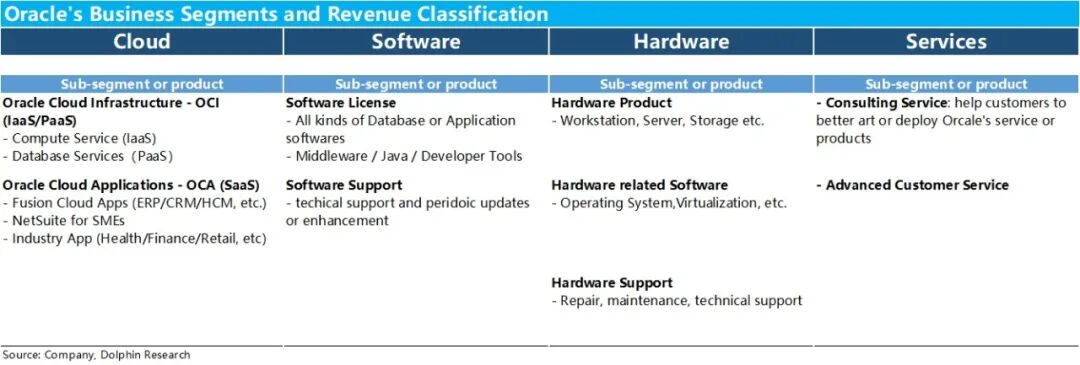
As a software industry veteran founded in the 1980s, Oracle's historical core businesses were databases and software services (traditional license models). However, recent cloud transformation efforts and the AI boom have propelled cloud services to the forefront as the most critical and closely watched segment.
Thus, starting in FY26, Oracle adjusted its financial reporting to clearly segment business and revenue into four categories: Cloud, Software, Hardware, and Services.
Further breakdown:
a. Cloud: Divided into IaaS (OCI) and SaaS (OCA) lines. OCA includes SaaS-based ERP/CRM and other general management tools, plus vertical industry tools. OCI comprises Oracle's signature database services and compute leasing.
Historically, OCA dominated the cloud segment, but OCI's share has surpassed OCA over the past 1-2 years due to rapid growth.
b. Software: Traditional on-premise software deployed and managed by customers, once Oracle's largest revenue segment but now surpassed by cloud.
It has two main components: one-time software license sales and recurring support services (e.g., usage support and updates).
c. Hardware: Similar to software, including one-time server hardware sales and recurring maintenance/support revenue, the smallest revenue segment.
d. Services: Other services beyond hardware/software, including consulting and custom services, accounting for high single-digit percentage revenue in recent years.
II. Key Focus: OCI Performance
1. Core Business - OCI Growth Accelerates as Expected
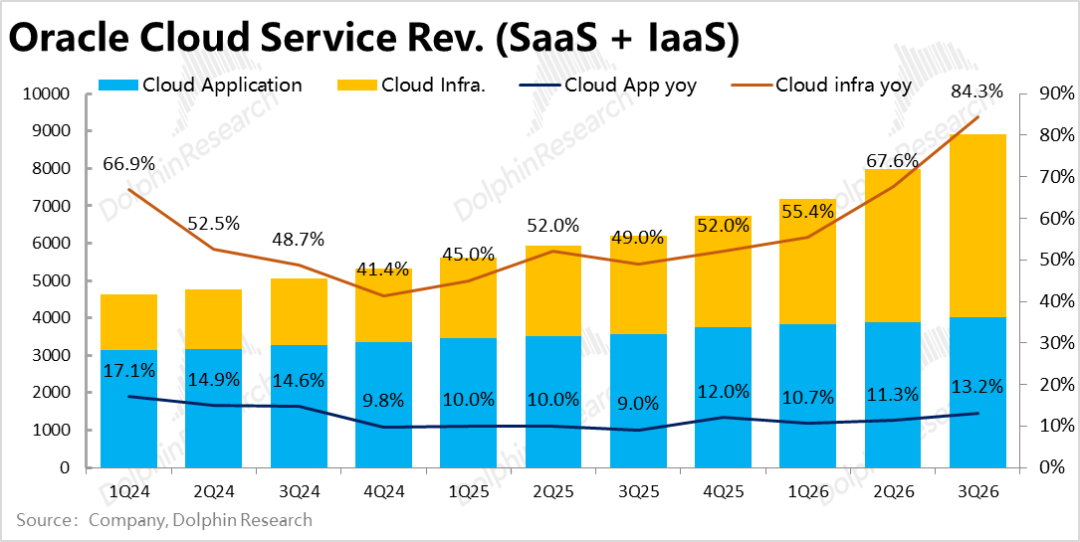
OCI revenue under the cloud segment reached $4.89 billion this quarter, growing 81% year-over-year at CC, significantly accelerating from 66% last quarter. Net revenue increased approximately $2.24 billion year-over-year, up nearly 36% sequentially.
Clearly, OCI's growth momentum continues to accelerate, a positive signal. However, market expectations also stood at 81%, with no deviation.
SaaS revenue under the cloud segment grew 13% year-over-year this quarter, appearing to accelerate slightly sequentially but entirely due to foreign exchange benefits. At CC, growth remained flat, with modest absolute growth and no standout features.
2. AI Business Drags on Gross Margins More Than Expected
As OCI scales rapidly, its drag on gross margins becomes more pronounced. The combined cloud + software gross margin (not separately disclosed) was approximately 68% this quarter, an 8 percentage point year-over-year decline, worse than last quarter's 5.9 percentage point drop and below market expectations.
Assuming software gross margins held steady, overall cloud gross margins may have fallen below 50%, with OCI's gross margin likely around 30% based on sell-side estimates.
The market's primary concern about OCI's rapid growth—increasing margin pressure—has been reinforced rather than alleviated by these results.
3. Leading Indicator – Is RPO Growth Taking a ‘Half-Time Break’?
The current revenue growth actually reflects the speed of capacity deployment, while the backlog of unfulfilled contracts, which reflects new demand, reached RMB 553 billion this quarter, with a net increase of approximately RMB 30 billion quarter-over-quarter.
In terms of trends, after a massive volume of orders in the first quarter, the scale of new orders has continued to decline over the past two quarters, appearing somewhat ‘quiet.’ However, the absolute volume of new orders is not low, equivalent to six times the OCI revenue recognized this quarter. One quarter saw an addition of OCI revenue equivalent to one and a half years of current revenue.
The company did not specifically disclose which customer the new orders came from this time, but they still originated from large-scale AI businesses. Moreover, it was particularly emphasized that the company itself did not need to secure additional financing or Capex for these orders. Customers either had already purchased GPUs on their own or provided prepayments sufficient to cover GPU purchase costs.
III. Capex and Debt Investment Also Rising Rapidly
Alongside the growth in OCI revenue and accelerated capacity deployment, the company's Capex investments and financing needs have also surged rapidly.
Capex spending reached RMB 18.6 billion this quarter (vs. quarterly revenue barely exceeding RMB 17 billion), representing a significant increase from RMB 12 billion in the previous quarter, with the net sequential increase also hitting a new high.
Moreover, the total Capex for this quarter also exceeded the company's total quarterly revenue for the first time, a phenomenon similar to that of new cloud player CoreWeave. However, Oracle, being an established leader with half of its revenue still coming from traditional businesses, makes this a very rare occurrence.
In terms of cash flow, due to limited growth in operating cash flow (YoY +20%), at approximately RMB 7.1 billion this quarter, and sustained surges in Capex, the company has recorded negative free cash flow of around RMB 10 billion for two consecutive quarters.
To support high and rapidly increasing capital expenditures, the company officially announced that it had completed approximately RMB 30 billion of its RMB 45-50 billion financing plan as of this quarter, including approximately RMB 25 billion in new debt issuance and about RMB 5 billion in preferred stock issuance. Net interest-bearing debt climbed from approximately RMB 81 billion at the end of FY25 to RMB 95 billion currently, with a net debt-to-asset ratio of 39%.
As a consequence, interest expenses reached RMB 1.18 billion this quarter, significantly higher by 32% YoY, with the proportion of total revenue also increasing by approximately 0.3 percentage points sequentially.
After this round of financing, the company currently has approximately RMB 38 billion in cash on hand (of which approximately RMB 10 billion needs to be retained for daily operations based on previous practices). At the current burn rate, this can support operations for at most two quarters, after which the company will inevitably need to continue financing (of the RMB 50 billion financing plan, approximately RMB 25 billion in new equity financing has yet to be executed).
IV. Other Segments Remain Largely Flat
Apart from the cloud business, growth in the company's other three major business segments remains ‘as dull as ever.’ Only the smaller-scale consulting business has shown sustained acceleration in growth, surpassing a 10% growth rate and showing signs of improvement, as accelerated growth in the cloud business has brought about increased consulting demand.
Meanwhile, revenue growth in traditional software services and hardware sales, after excluding the positive impact of exchange rates, remains essentially stagnant YoY.
V. Overall Performance
1. Total Revenue Growth Exceeds 20%
Aggregating the four major business segments, although traditional businesses remain lackluster, driven by the high-growth OCI business, the overall revenue growth rate for the group this quarter has symbolically broken through the 20% mark, seen as significant by many leading sellers.
After excluding the positive impact of exchange rates, constant currency revenue growth was 18%, merely matching the upper limit of previous guidance and not exceeding expectations.
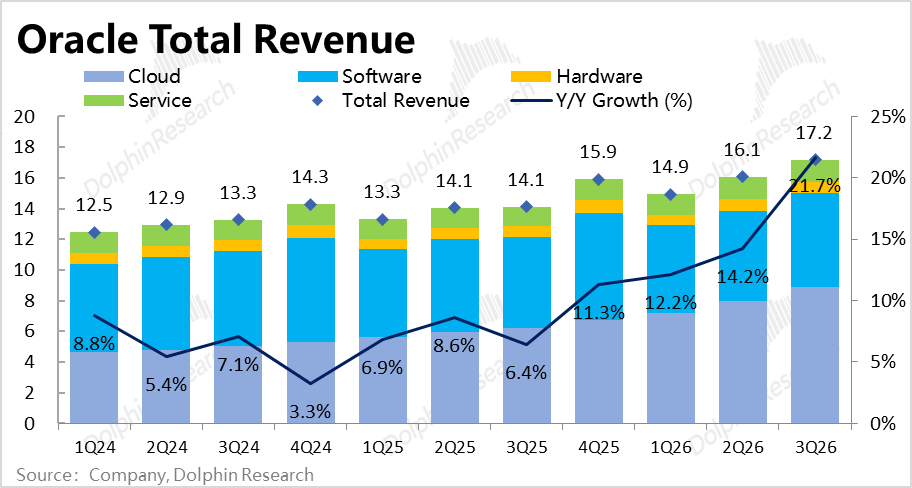
2. Overall Gross Margin Under Pressure and Declining
Although gross margins for the hardware and services segments improved YoY this quarter, these two businesses have limited weight. Dragged down by the key OCI business, the group's overall gross margin also declined by approximately 5.7 percentage points YoY to 64.6%, significantly lower than market expectations of 67%. It is evident that the OCI business has also significantly dragged down the overall gross margin.
3. Strict Control Over Expenses
In terms of expense management, focusing on the three major regular operating expenses, the YoY growth rate this quarter was only 2.2%, significantly lower than market expectations of nearly 6%. It is evident that the rapid growth and investment in the OCI business have had little impact on operating expenses, with the company maintaining a strict cost-control stance.
Additionally, non-operating expenses confirmed this quarter (such as amortization of intangible assets, restructuring costs, etc.) also significantly decreased, with the combined operating and non-operating expenses growing by only 1% YoY.
Benefiting from excellent expense control, despite a significant decline in gross margin, the adjusted operating margin only decreased by 0.9 percentage points YoY this quarter, actually exceeding market expectations by approximately 0.3 percentage points. Consequently, the final adjusted operating profit was RMB 7.38 billion, slightly higher than market expectations.
- END -
// Reprint Authorization
This article is an original piece by Dolphin Research. Reprinting is only allowed with authorization.
// Disclaimer and General Disclosure Notice
This report is for general comprehensive data purposes only, intended for general reading and data reference by users of Dolphin Research and its affiliated institutions. It does not take into account the specific investment objectives, investment product preferences, risk tolerance, financial situation, or special needs of any individual receiving this report. Investors must consult with independent professional advisors before making investment decisions based on this report. Any person making investment decisions using or referring to the content or information mentioned in this report must bear their own risks. Dolphin Research shall not be liable for any direct or indirect responsibilities or losses that may arise from using the data contained in this report. The information and data in this report are based on publicly available materials and are for reference purposes only. Dolphin Research strives to ensure but does not guarantee the reliability, accuracy, and completeness of the information and data.
The information or viewpoints mentioned in this report shall not, under any jurisdiction, be regarded or considered as an offer to sell securities or an invitation to buy or sell securities, nor shall they constitute recommendations, inquiries, or endorsements of relevant securities or related financial instruments. The information, tools, and materials contained in this report are not intended for or proposed to be distributed to jurisdictions where the distribution, publication, provision, or use of such information, tools, and materials conflicts with applicable laws or regulations, or to citizens or residents of jurisdictions where Dolphin Research and/or its subsidiaries or affiliated companies are required to comply with any registration or licensing requirements in that jurisdiction.
This report only reflects the personal viewpoints, insights, and analytical methods of the relevant creators and does not represent the stance of Dolphin Research and/or its affiliated institutions.
This report is produced by Dolphin Research, with copyright solely owned by Dolphin Research. Without prior written consent from Dolphin Research, no institution or individual may (i) produce, copy, duplicate, reproduce, forward, or create any form of copies or reproductions in any manner, and/or (ii) directly or indirectly redistribute or transfer to other unauthorized persons. Dolphin Research reserves all related rights.
-
![]()
AI Giants Start Borrowing to Fuel Computing Power Race
-
ByteDance Initiates Largest B2B Structural Adjustment, This Time It's Truly Different
-
![]()
Let's Talk About Kingsoft Office's Mid-Year Outlook and the True Strength of Its AI-Powered Office Solutions
-
Despite 150 Million Users, Struggles Persist: AIShige Faces Tough Competition from Seedance and Kling in AI Video Monetization
-
![]()
Ensuring Safe Gear Shifting in the Automotive Industry: Transitioning from 'Product Oversight' to 'Full-Chain Governance'
-
![]()
Net Profit Soars to $133.7 Billion! Azure Revenue Tops $100 Billion, with AI Fueling Microsoft's Growth
-
![]()
Before 6G Hits the Market, the U.S. Forges a 'Rules Alliance': What Challenges Await Chinese IoT Enterprises?
-
![]()
Intelligent Driving's 'Little Blue Light' Faces Ban: Night Glare and Cut-in Risks Prompt Official Action