“Pie-in-the-sky” Tesla is finally back as a king!
![]() 10/24 2024
10/24 2024
![]() 543
543
Tesla (TSLA.O) released its Q3 2024 earnings report after the US market close on October 23, Beijing time. Here are the core highlights:
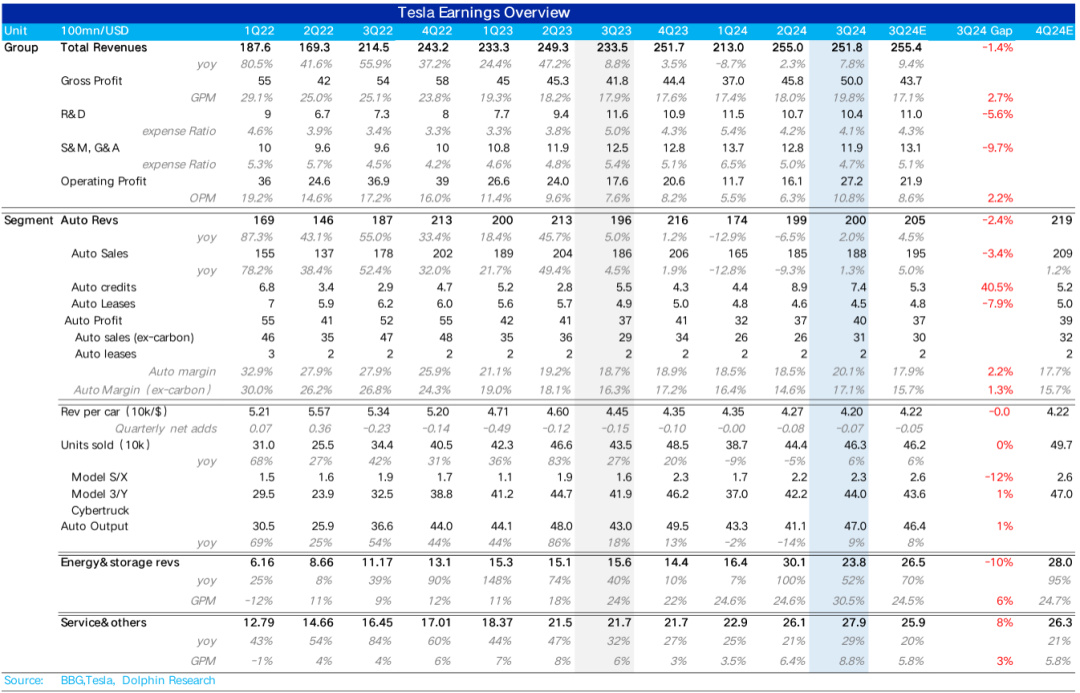
1. The average car price declined slightly, resulting in lower-than-expected revenue, but the impact is minor: Automotive revenue for the quarter was $20 billion, $500 million lower than market expectations. However, due to $200 million in regulatory credit revenue exceeding market forecasts, the actual automotive revenue (excluding regulatory credits) was approximately $700 million below market expectations, primarily due to lower-than-expected average car prices, which declined by $730 per vehicle quarter-over-quarter.
2. Surprisingly, automotive gross margins finally rebounded from their lows, significantly exceeding market expectations: Despite the continued decline in automotive ASPs, automotive gross margins (excluding carbon credit impacts) increased by 2.4 percentage points quarter-over-quarter to 17.1%, well above both buy-side expectations of 15.3% and sell-side expectations of 15.7%, primarily driven by declines in variable costs.
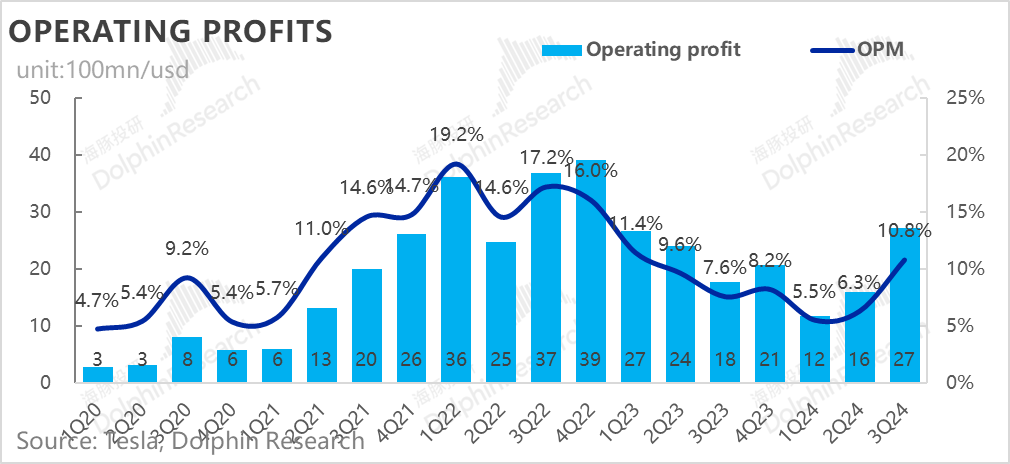
3. Tight control over operating expenses led to an improvement in operating profits quarter-over-quarter: As automotive gross margins drove overall gross margins significantly above expectations, operating expenses continued to decline (likely due to cost savings from the second-quarter layoffs resulting in lower personnel costs). Additionally, the absence of restructuring charges related to layoffs (a decrease of $520 million quarter-over-quarter, with layoffs concentrated in Q2) contributed to an increase in overall operating profit to $2.7 billion, exceeding market expectations of $2.2 billion.
4. The next 'growth engine' is on the horizon: With the Model 3/Y facing aging models and increased competition, pricing increases are unlikely. Tesla can only stabilize profit margins by continuously reducing costs. However, to investors' delight, Tesla announced that its new low-cost model will begin production in the first half of 2025. With this new vehicle, Musk expects vehicle growth of 20%-30% next year, introducing a new growth engine for Tesla's valuation.
Dolphin Insights: In our Tesla earnings preview last night, we expressed greater optimism about Tesla's prospects in 2025 compared to our view at the end of last year. Setting aside the long-term AI narrative, the underlying hardware pillar for AI monetization – the automotive business – is improving, and an AI-friendly political landscape (e.g., if Trump wins) could further smooth the path for AI advancements.
1) Early release of 2025 guidance: In the automotive business, before the truly affordable Model 2 arrives, Tesla plans to introduce a Model 2.5-like vehicle focused on simplification and cost control, to be produced in the first half of 2025, as announced in this earnings report by Musk. This vehicle, combined with the Model 3 and Model Y, will drive a 30% increase in sales in 2025 compared to this year's estimated 1.8 million vehicles, or an additional 360,000 to 550,000 vehicles, significantly above market expectations of an additional 250,000 vehicles. This guidance is highly aggressive.
2) Technological cost reductions and supply chain pressures: If the guidance was a big beat, then the other significant positive surprise was the exceptionally high automotive gross margins. We had anticipated that gross margins would be a wildcard, and indeed, the 2.4 percentage point beat was a substantial and effective positive surprise. Although Tesla guided conservatively for Q4 automotive gross margins (citing the difficulty in sustaining Q3's high levels), the beat itself, based on our analysis, appears sustainable due to:
a. Renegotiated raw material procurement contracts fully impacting Q3, driving cost reductions through lower raw material prices (possibly including battery price reductions from suppliers like CATL for Tesla).
b. Improved gross margins for the Cybertruck, which turned profitable for the first time.
Together, these factors enabled Tesla to boost profitability by compressing variable costs per vehicle, even as the Model 3/Y faced aging models and increased competition. These two points constitute the core sources of Tesla's significant beat.
Of course, the AI pie is still being baked: The upcoming FSD V13 promises a 5-6x increase in unsupervised miles compared to V12.5, and unsupervised FSD will launch in California and Texas. However, we view these developments more as upside options tied to a Trump victory, adding optimism rather than being fundamental drivers.
Originally, we had hoped for a modest Q3 gross margin to position Tesla at a comfortable entry point below $200 per share. Given Q4 sales guarantees and the stimulus of new vehicles in 2025, upside factors outweigh downside factors. However, achieving a $200 price point may now be challenging and will depend on whether Q1 sales, traditionally a slow season, experience a significant decline similar to earlier this year.
Below is a detailed analysis of the earnings report
I. Tesla: Slightly lower-than-expected revenue but significantly higher-than-expected gross margins!
1.1 Revenue slightly below market expectations, primarily due to lower-than-expected automotive sales revenue
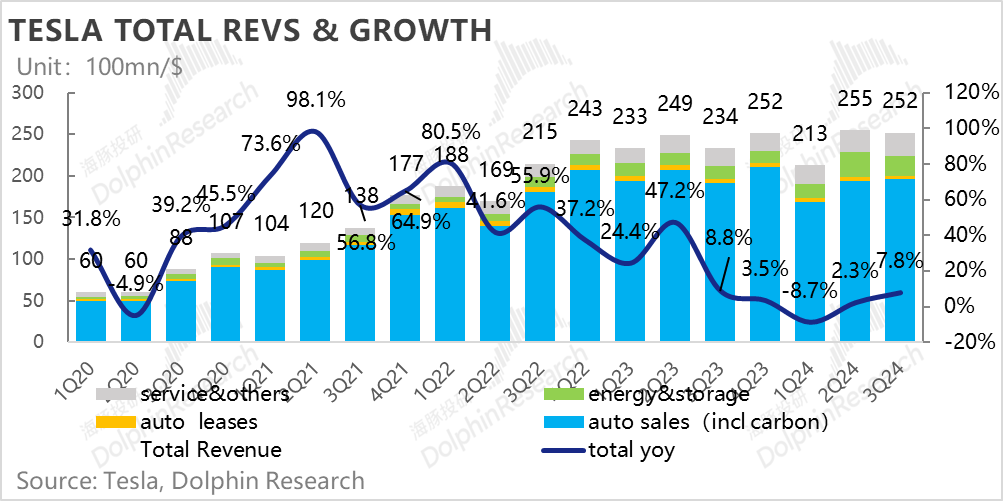
Tesla's Q3 2024 revenue was $25.2 billion, up nearly 7.8% year-over-year. In terms of expectations, the $25.2 billion in total revenue was slightly below the consensus sell-side estimate of $25.5 billion on Bloomberg. While vehicle deliveries continued to grow quarter-over-quarter, revenue declined compared to the previous quarter.
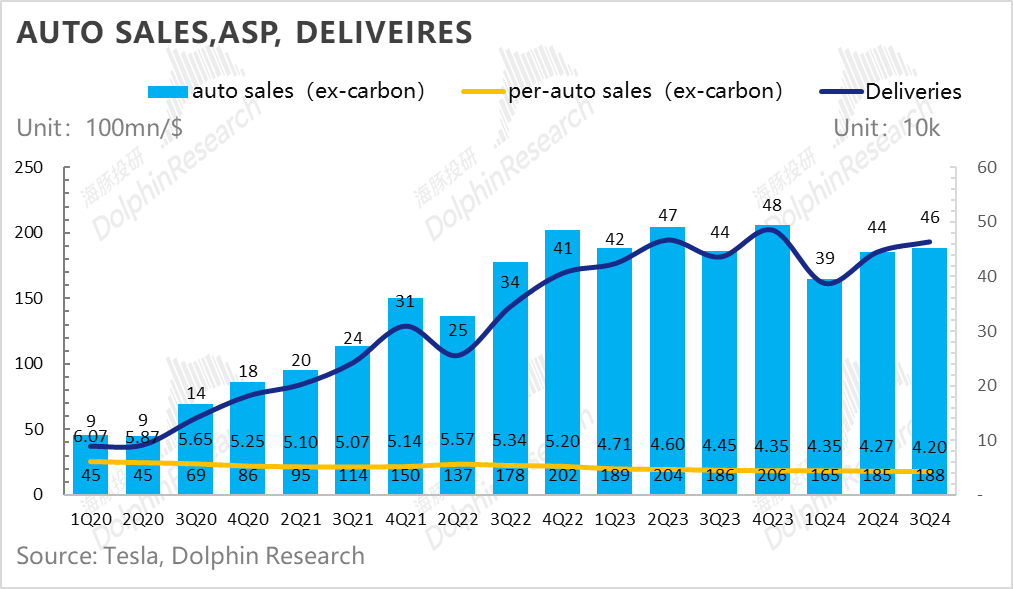
The primary reason for the decline was in the automotive business, where revenue was only $20 billion, lower than the consensus estimate of $20.5 billion. Although automotive sales were partially salvaged by carbon credit revenue, due to a quarter-over-quarter decline in average car prices, automotive sales (excluding carbon credits) were only $18.8 billion, below market expectations of $19.5 billion.
Apart from the automotive business, energy segment revenue was also slightly below market expectations, mainly due to lower-than-expected energy storage shipments. Energy storage shipments were 6.9 GWh, a quarter-over-quarter decline of 27%.
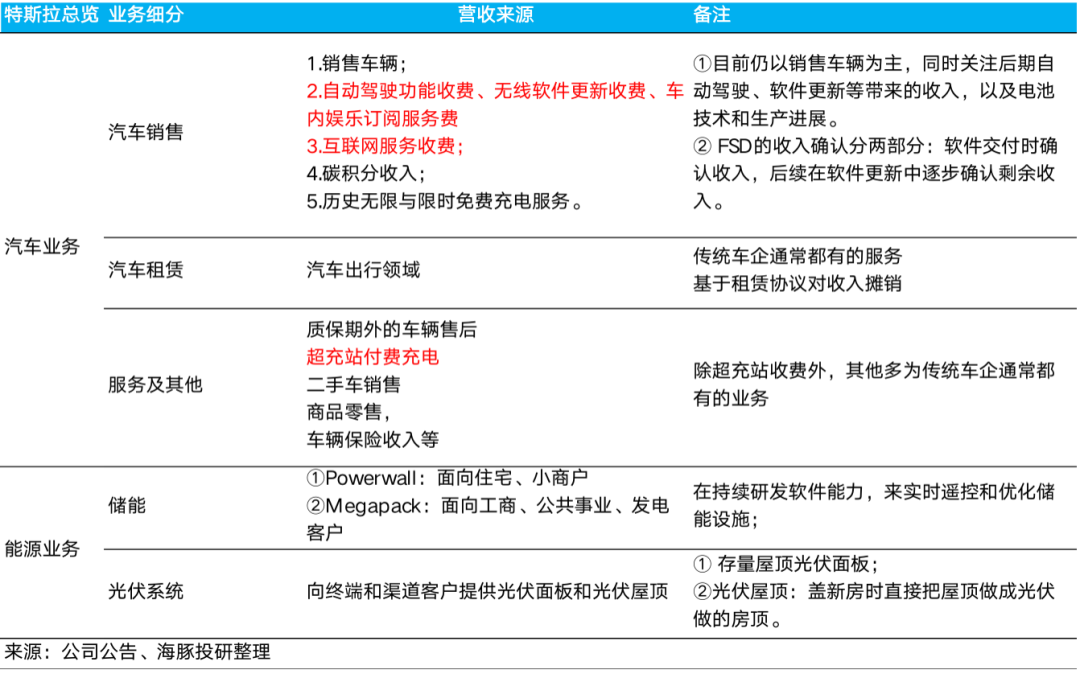
1.2 However, automotive gross margins significantly exceeded expectations, driving overall gross margins above market forecasts
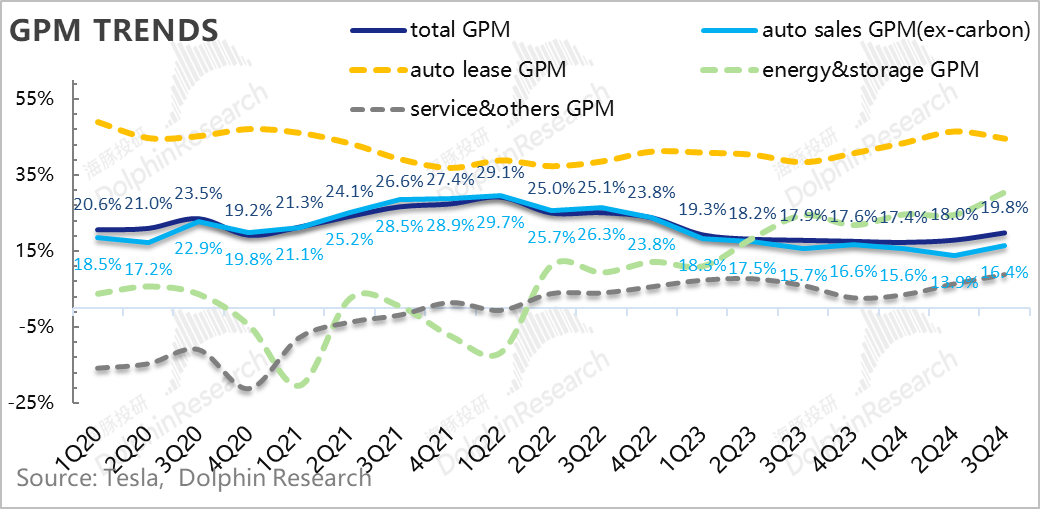
Automotive gross margins are always the most critical and incremental information in Tesla's earnings reports. In Q3, automotive gross margins finally rebounded from their Q2 lows, reaching 20.1%, substantially exceeding market expectations of 17.9%, driving overall gross margins above expectations.
In other segments, despite a quarter-over-quarter decline in energy storage shipments, gross margins increased to 30.5% due to higher average selling prices (possibly due to a higher proportion of high-priced Powerwalls) and declining lithium prices, exceeding market expectations of 24.5%.
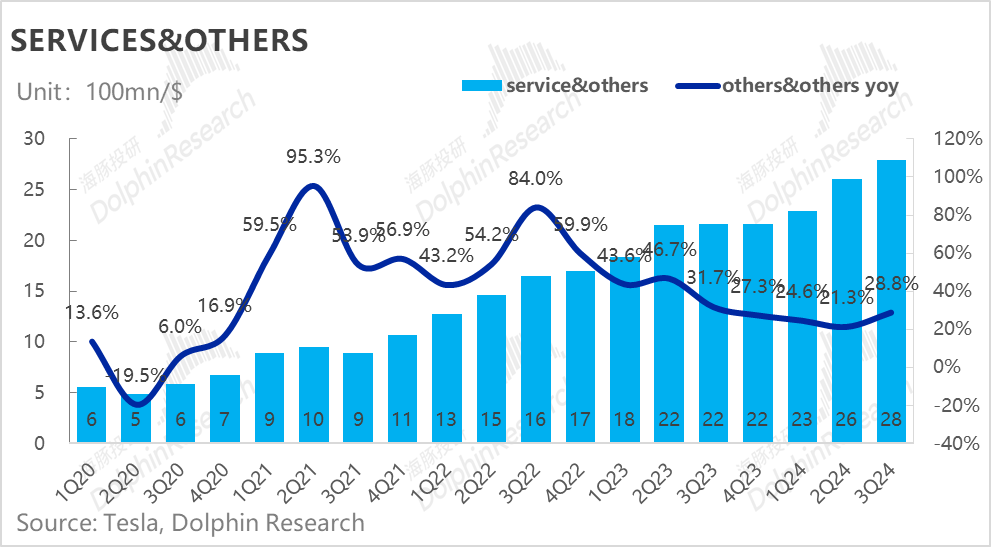
Service gross margins also increased to 8.8%, above market expectations of 5.8%, driven by the continued expansion of the Supercharger network in North America (covering non-Tesla users) and higher gross margins for service centers and accessory sales.
1.3 Automotive gross margins significantly exceeded market expectations
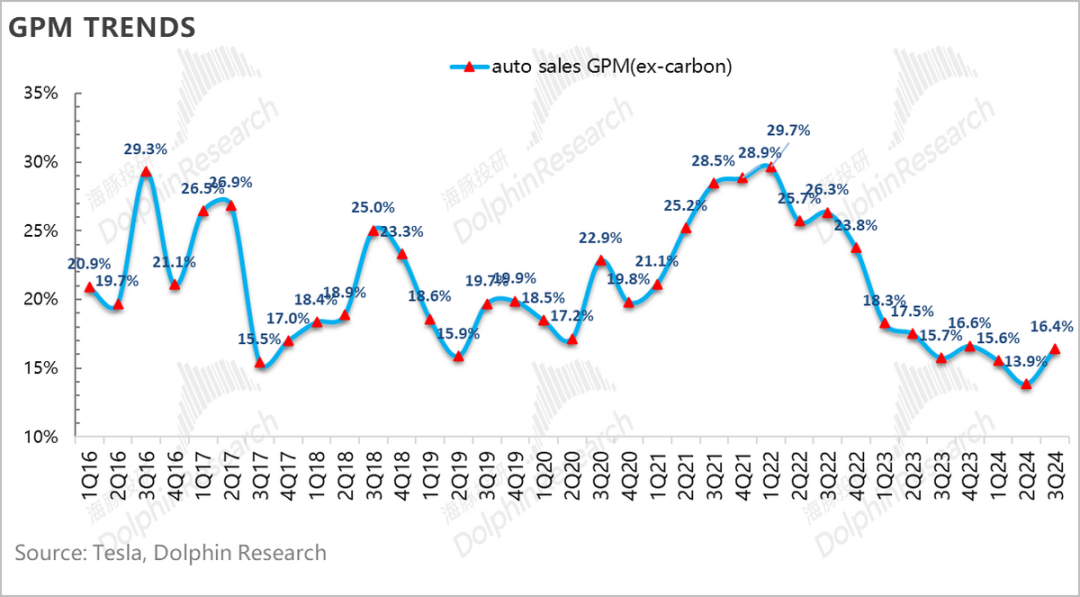
As the most critical metric to monitor each quarter, automotive gross margins are paramount, especially amid declining sales and increasing competition. To gain a clear understanding, we broke down automotive gross margins into those excluding carbon credits and leasing, as well as overall automotive gross margins.
Since automotive leasing revenue is relatively small and gross margins are stable, this detailed breakdown is primarily to observe automotive gross margins excluding carbon credits.
In Q3, automotive gross margins (excluding carbon credits and leasing) were 17.1%, an increase of 2.4 percentage points quarter-over-quarter, finally recovering from Q2 lows and significantly exceeding both buy-side expectations of 15.3% and sell-side expectations of 15.7%.
Therefore, the key question is why Tesla's automotive gross margins rebounded from their lows in Q3 and exceeded market expectations by such a wide margin?
II. Vehicle Economics: The reason for the gross margin beat lies in significant cost reductions per vehicle!
Let's start with the average selling price per vehicle. In Q3, Tesla's revenue per vehicle sold (excluding carbon credits and automotive leasing sales) was $42,000, a quarter-over-quarter decline of approximately $730 and below market expectations.
Market expectations for higher automotive ASPs were based on Tesla not reducing prices for its main models, the Model 3/Y, in China or the US in Q3. In Europe, due to tariff increases (only 9%), Tesla actually increased prices for the Model 3 by €1,500.
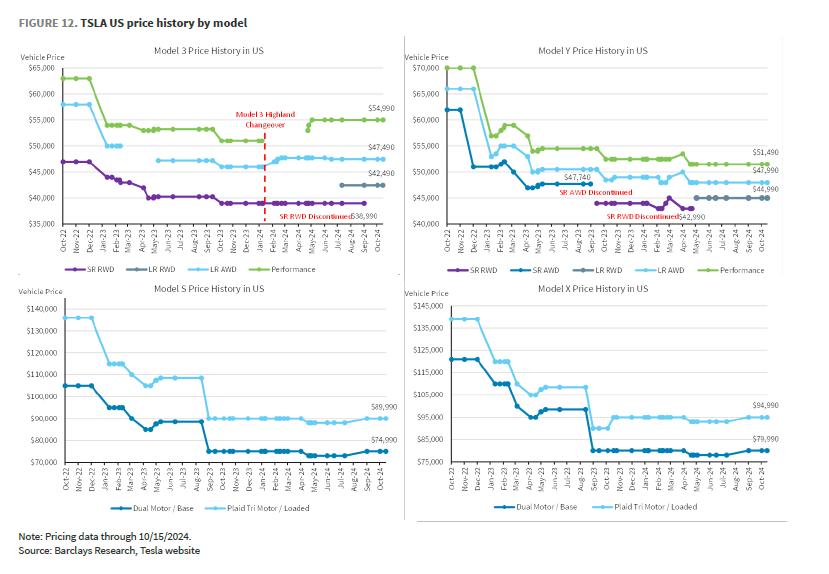
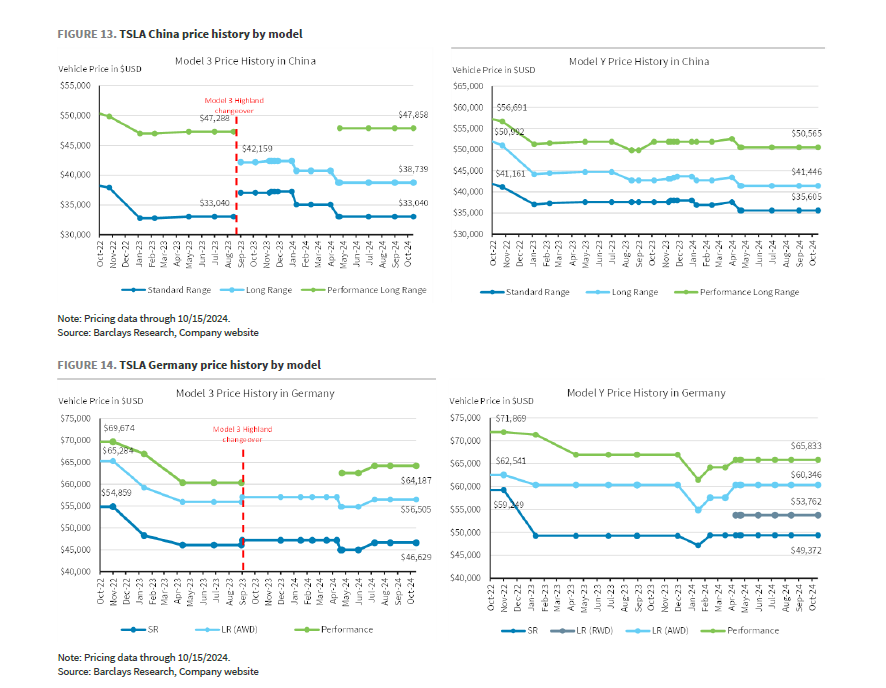
We believe the primary reasons for the $730 quarter-over-quarter decline in ASPs are:
a. The impact of Q2 price reductions did not cover the entire quarter but did so in Q3 (with an average price decline of approximately 1%, considering time-weighted pricing).
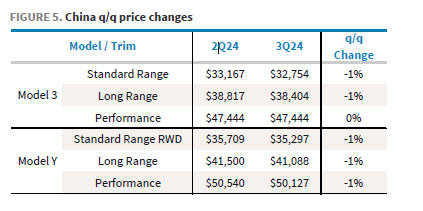
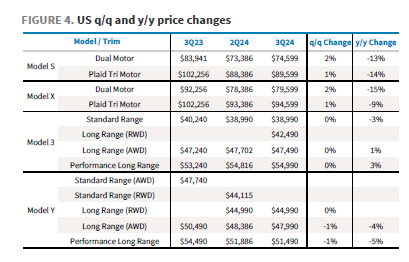
b. Changes in model mix: The lower-priced Model 3 accounted for 2 percentage points more of total sales compared to the previous quarter.
c. Incentive measures: Tesla offered low-interest loans throughout Q3 in the US, compared to only a few weeks in Q2 (e.g., 0.99% for the Model Y in May, covering just three weeks and translating to subsidies of $6,000-$8,000 per Model Y; in Q3, 1.99% loans plus interest rate cuts resulted in subsidies of approximately $5,000 per Model Y, covering the entire quarter).
In China, while Tesla also offered 5-year, 0% down, interest-free loans, these offers were also available in Q2, resulting in minimal marginal changes.

Now, let's turn to vehicle costs. Tesla typically achieves cost reductions through four avenues: 1) economies of scale from increased sales volumes and optimized capacity utilization; 2) technological cost reductions; 3) natural declines in battery raw material costs; and 4) government subsidies. Specifically:
2.1 Significant declines in variable costs per vehicle
We break down vehicle costs into depreciation and variable costs per vehicle. Here's the vehicle economics for Q3:
1) Depreciation per vehicle: With a 4% quarter-over-quarter increase in sales, depreciation per vehicle remained largely flat, with a slight increase in the depreciation rate due to lower ASPs.
We believe this may be due to most of Q3 sales coming from the Shanghai Gigafactory (boosting capacity utilization), while sales and production in Europe and the US declined slightly (reducing capacity utilization), effectively offsetting each other.
2) Variable costs per vehicle: At $32,000, variable costs per vehicle declined by approximately $1,700 quarter-over-quarter, the primary driver of the increase in automotive gross margins (excluding carbon credits). We believe the decline in variable costs per vehicle can be attributed to:
a. The full impact of renegotiated raw material procurement contracts in Q3, driving cost reductions through lower raw material prices (especially for batteries).
b. Improved gross margins for the Cybertruck, which became profitable for the first time.
c. Other factors: Decreases in shipping costs, tariffs, and other one-time costs.
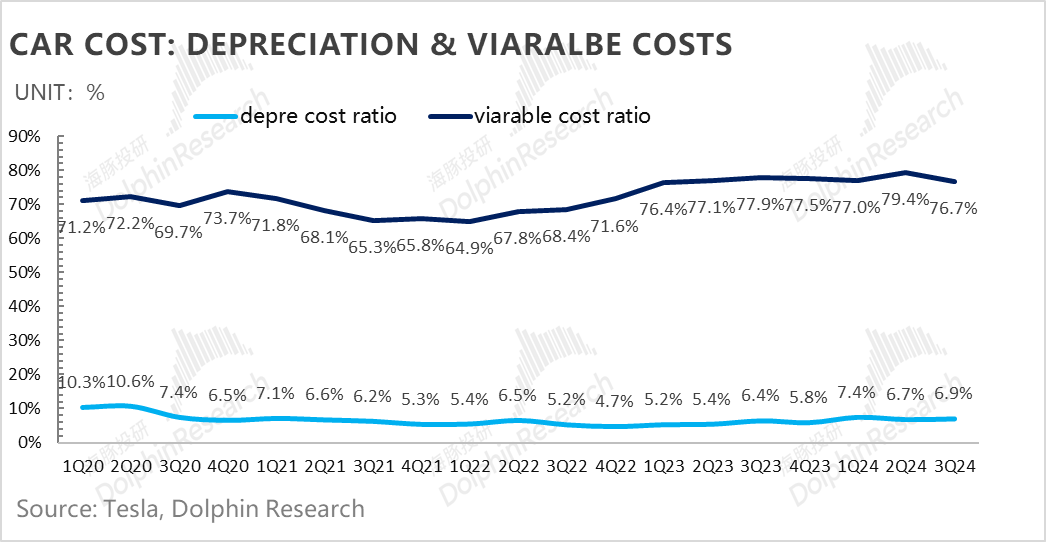
3) Gross margin of automobiles steps up another level: Despite the continuous decline in the price per unit sold this quarter, significant cost reductions in variable costs drove the gross margin of the automotive business to exceed expectations.
Regulatory credits accounted for 740 million this quarter, slightly lower than the previous quarter but still exceeding market expectations of 530 million. Although carbon credits are expected to weaken as the transition to renewable energy accelerates in North America, the slow pace of penetration of new energy vehicles in the United States continues to sustain demand for regulatory credits for some time.

2.3 Is Tesla's next growth engine on the horizon for its automotive business?
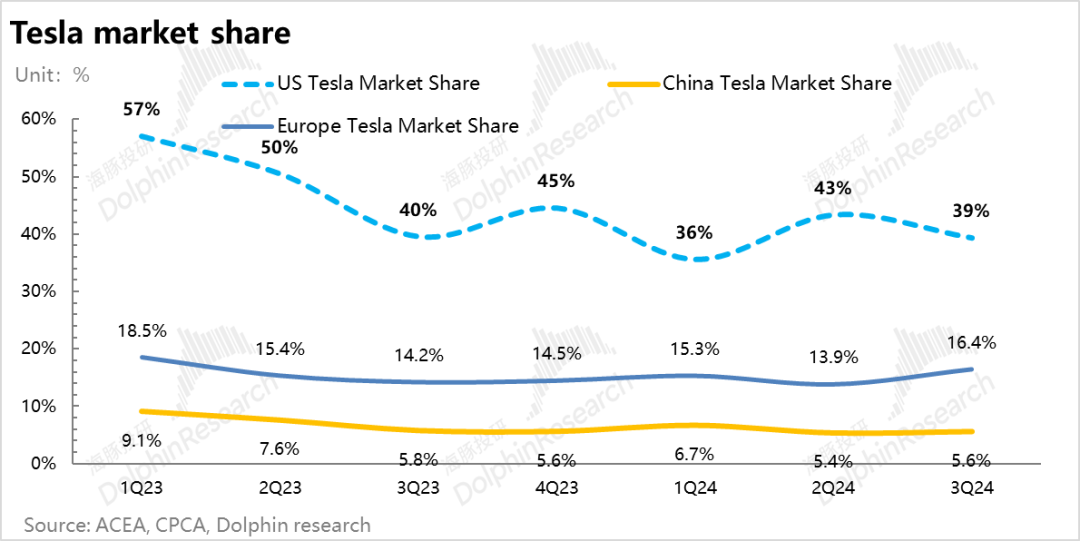
From a fundamental perspective, while Tesla's overall sales volume and market share may fluctuate with seasonal cycles (typically peaking in Q3 and Q4) and adjustments to pricing/incentives due to the aging of Model 3/Y models, Tesla's overall market share in different regions has shown a declining trend over time. Without the stimulus of new models, the fundamental automotive business is poised to deteriorate further, underscoring Tesla's urgent need for the next growth engine.
The consensus market expectation for Tesla's automotive sales in 2024 stands at around 1.79 million units, slightly lower than 1.81 million in 2023. The implied Q4 delivery volume of nearly 500,000 units is expected to be achievable during the peak sales season. However, with limited scope for price increases, Tesla must rely on cost compression to maintain profitability, with uncertainty surrounding Q4 profitability.
Without the stimulus of new models, 2025 is projected to be another challenging year for Tesla's automotive sales, as penetration of new energy vehicles in Europe and the US is unlikely to see significant gains. Facing aging models and intensifying competition, Tesla's global market share and profitability are expected to continue declining.
Fortunately, Tesla's earnings call revealed the delivery timeline and 2025 sales expectations for its next-generation affordable model. Production of this new model is set to commence in the first half of 2025, initially utilizing Tesla's existing production lines (with a maximum capacity of approximately 3 million units). Driven by this new model, Musk anticipates a 20%-30% growth in vehicle sales next year, implying total sales of 2.16-2.34 million units in 2025. Assuming flat sales of existing models, this new model could contribute an incremental 360,000-540,000 units, providing a fresh growth engine for Tesla's automotive business.
Regarding FSD progress, which investors closely monitor, the key to increasing FSD penetration lies in price adjustments and enhanced safety. Musk noted that compared to version V12.5, FSD V13 will increase the driving distance between interventions by 5-6 times. Regarding hardware computing power, Tesla's deployment of additional GPUs (with an expected 50,000 H100 chips by the end of October) eliminates any constraints on hardware computing power.
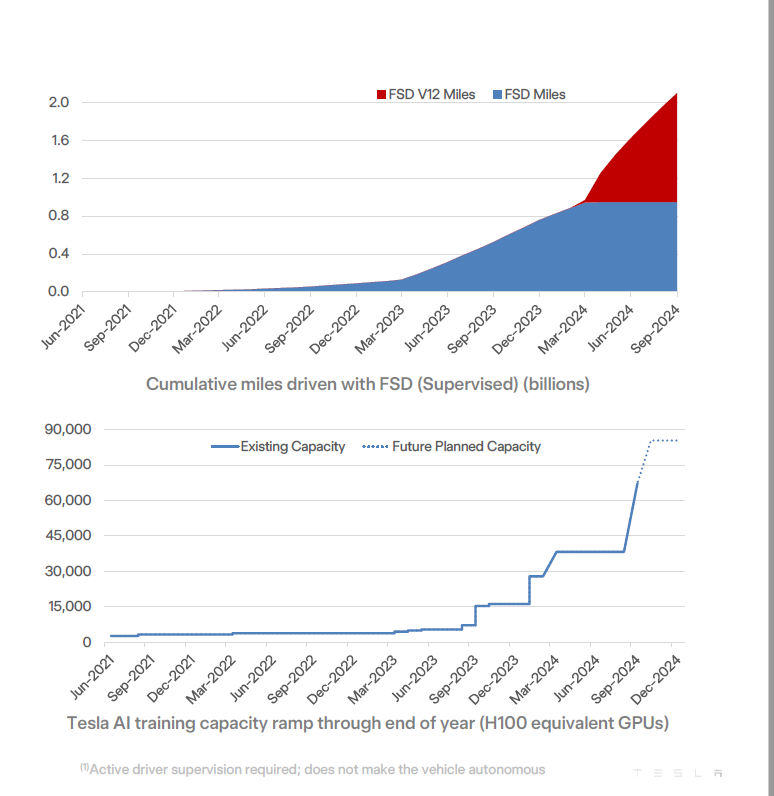
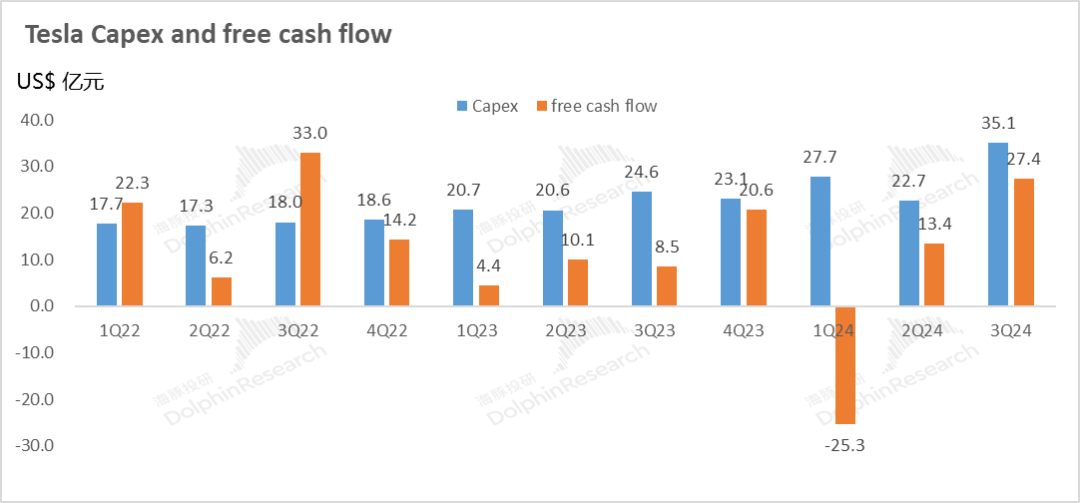
However, Tesla's investment in hardware computing power (through the purchase of H100 GPU chips) is expected to drive quarterly capital expenditures to a new high, increasing 55% quarter-over-quarter to $3.5 billion. Tesla anticipates full-year capital expenditures exceeding $11 billion, implying approximately $2.4 billion in Q4, which remains manageable.
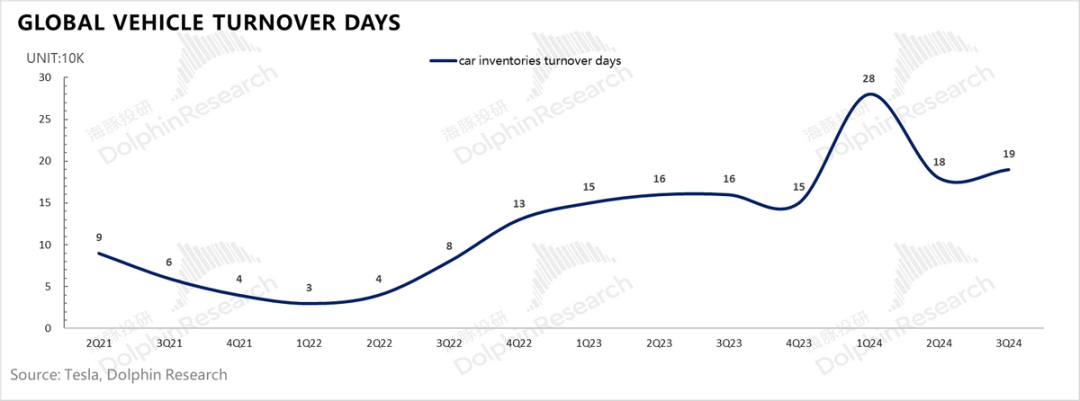
This quarter's improvement in free cash flow primarily stems from the increase in gross margin and the reduction in expenses, resulting in a sequential increase of RMB 1.1 billion in operating profit. Despite a modest increase of only 6,900 units in production-sales differences, inventory turnover days remained largely unchanged from the previous quarter, indicating minimal inventory backlog and limited impact on free cash flow.
III. Expenditure: Tight Control over Operating Expenses
In addition to being more cautious with investments in automotive capacity, Tesla has imposed tight control over both R&D and selling expenses this quarter. R&D expenses amounted to $1.04 billion, lower than market expectations of $1.1 billion, while selling, general, and administrative expenses totaled $1.19 billion, also below market expectations of $1.3 billion. The overall reduction in expenses likely reflects the reduction in headcount following layoffs in Q2.
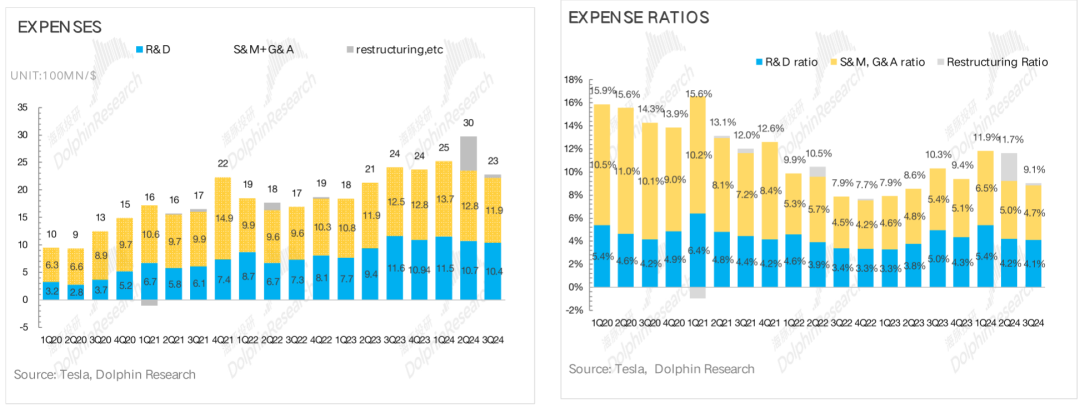
The combination of increased gross margin, reduced operating expenses, and lower restructuring charges related to layoffs (down $520 million quarter-over-quarter, concentrated mainly in Q2) contributed to a quarterly operating profit of $2.7 billion, exceeding market expectations of $2.2 billion.
IV. Moderated Energy Growth and Steady Service Business Progress
4.1 Moderated Growth in Energy Business: Tesla's energy storage and solar business encompasses the sale of photovoltaic and energy storage systems to residential, small commercial, large commercial, and utility-scale customers.
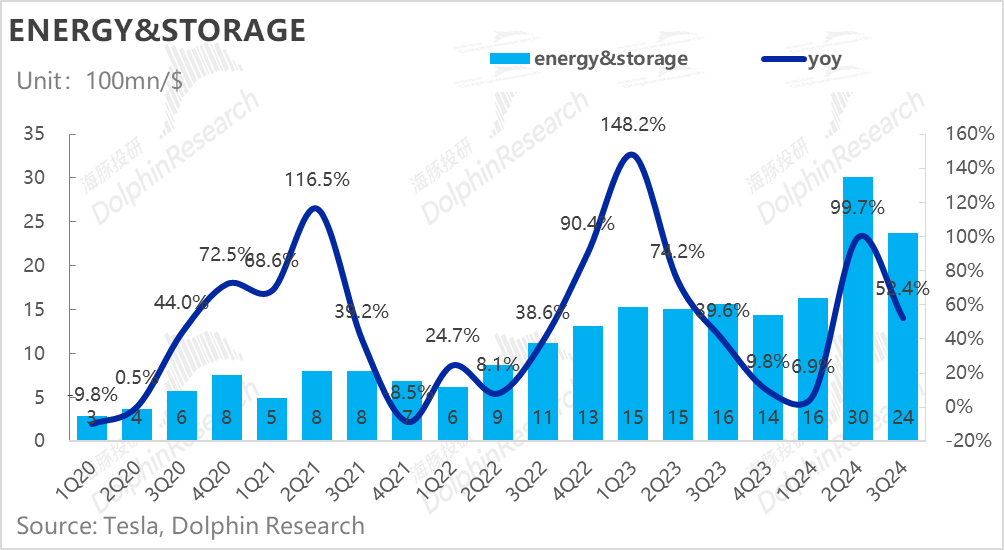
Revenue for Q3 2023 totaled $2.4 billion, lower than market expectations of $2.65 billion, primarily due to a decline in energy storage shipments to 6.9 GWh (down 27% quarter-over-quarter from 9.4 GWh). However, given the project-based nature of energy storage and the strong demand for large-scale storage in the US, moderation in this quarter's growth is not a concern. Tesla anticipates continued sequential growth in energy storage installations in Q4 2024, with annual shipments expected to double year-over-year, implying a potential return to around 9 GWh in Q4. The energy business remains on an upward trajectory.
Moreover, energy storage contracts are typically signed in advance and prices are locked in. Given the declining lithium prices, the higher-priced Powerwall may have comprised a larger proportion of this quarter's product mix, contributing to a record-high gross margin of 30.5% for the energy business, significantly exceeding market expectations of 24.5%.
4.2 Steady Progress in Service Business: Tesla's service revenue reached $2.8 billion in Q3, up 29% year-over-year, indicating steady progress. Gross margin increased sequentially to 8.8%, exceeding market expectations of 5.8%, driven by the continued expansion of the Supercharger network in North America (including non-Tesla users) and improved gross margins from service centers and accessory sales.
