BYD: Don't Be Fooled by Its "Mask"!
![]() 09/05 2024
09/05 2024
![]() 429
429
Halfway through 2024, with the release of a new round of financial reports, the new energy companies covered by Dolphin show a level of severity unmatched by other Chinese companies listed overseas. Led by Tesla, a host of new energy vehicle stocks, including NIO and Leapmotor, have suffered significant setbacks, and even BYD, which had previously boasted a high gross margin, has not been spared.
Especially for BYD, with its declining average vehicle price, falling gross margin, and slipping profits, it might seem at first glance that no amount of sales can escape the curse of the competitive "red ocean."
But if you take a closer look at BYD for a longer period, you'll realize that its approach differs from that of other new energy vehicle companies.
In Dolphin's view, BYD's uniqueness stems from its "bone structure," or the strictest form of vertical integration. In other words, while other companies' declining gross margins are genuine, BYD's initial rise and subsequent fall in gross margin are, to a certain extent, a result of the "mask" provided by vertical integration. So,
1) What exactly is this mask?
2) What lies beneath BYD's mask - the truth and the fiction?
3) How does this affect investment decisions?
Building on our previous in-depth analyses, "BYD: The Final Battle!" and "BYD: The Struggle for Premiumization," this article will focus on how excessive and rapid capital investment cycles under a vertically integrated heavy asset layout distort the profitability of heavy asset companies and how to evaluate their true profitability and investment value.
1) BYD's Mask: A Mismatch Between Investment and Depreciation Periods in Heavy Asset Businesses
For many who follow BYD, a lingering question is why its gross margin has consistently bucked the trend. Initially, it didn't rise with others, and later, it didn't fall when others did. Now, as others recover, it declines.
The knee-jerk answer, difficult to quantify, might be the scale advantage in sales volume or the first-mover advantage in hybrid technology. Dolphin can only say that such answers are correct but unhelpful.
From a quantitative perspective, Dolphin offers another perspective: When vertically integrated heavy asset companies invest heavily in capacity expansion over a period, this, combined with accounting amortization policies, can distort corporate earnings data.
Why is the analysis of capital expenditure and amortization/depreciation changes particularly important for BYD? Simply put, for any company to generate revenue, it must first invest. Revenue does not fall from the sky.
Different types of expenses are handled differently in finance. Recruitment and advertising expenses are typically expensed immediately, while long-lived assets like fixed assets and intangible assets are amortized or depreciated over time. While this is standard practice, it can significantly distort a company's profit trajectory, especially for extreme cases like:
Pinduoduo once complained about accounting policies being unreasonable during a conference call, arguing that their marketing expenses were essentially capital expenditures because they sacrificed current cash flow for future customer loyalty and mindshare. Similarly, BYD's high capital expenditures and the mismatch between its capital expenditure cycle and amortization/depreciation smoothing period distort its profits.
By separating BYD's automotive (including battery) costs into amortized/depreciated fixed costs and other variable costs, Dolphin calculates a gross margin excluding amortization/depreciation. This reveals a marked divergence between the adjusted gross margin trend and the reported gross margin trend at two key points: the first half of 2023 and the first half of 2024. During these periods, while the reported gross margin fell, the adjusted gross margin actually rose.
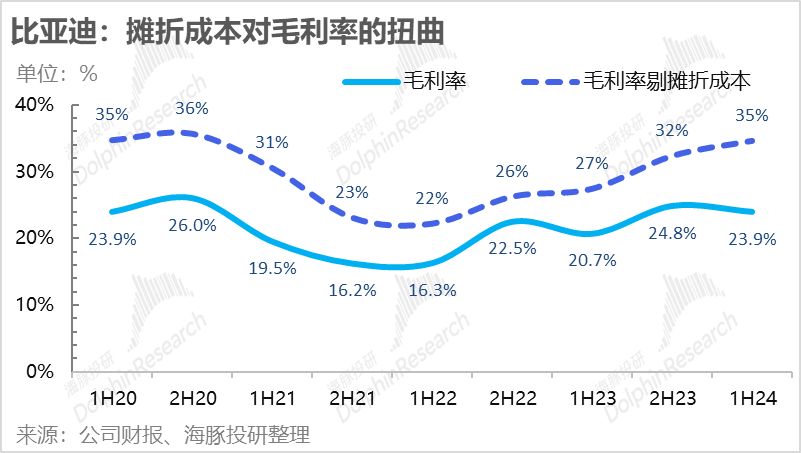
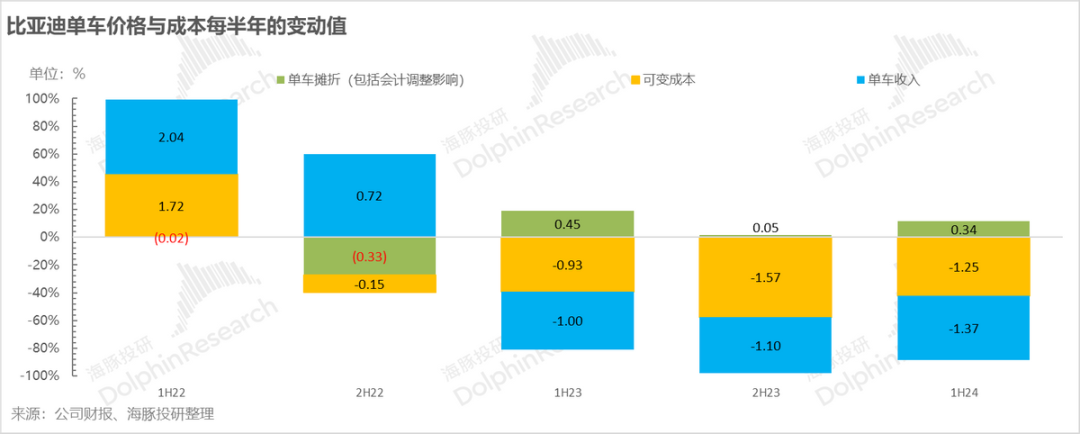
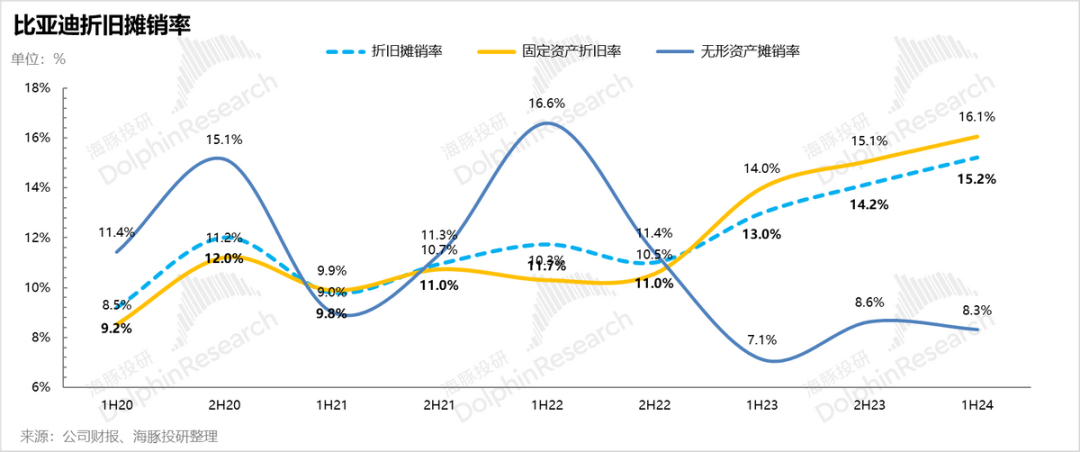
Dolphin traces this divergence to two primary factors: changes in depreciation rates and the mismatch between peak capital expenditure and depreciation periods. From 2023, BYD shortened the depreciation period for some production lines, including batteries, from five to three years, significantly increasing depreciation rates. Despite sales growth, depreciation per vehicle rose sharply in H1 2023 compared to H2 2022, failing to exhibit economies of scale. The trend accelerated further in H1 2024.
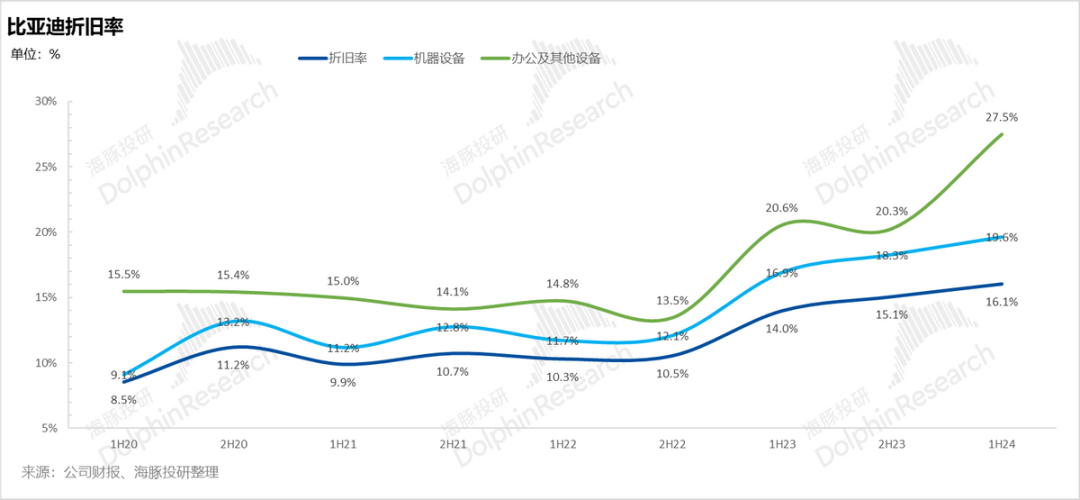
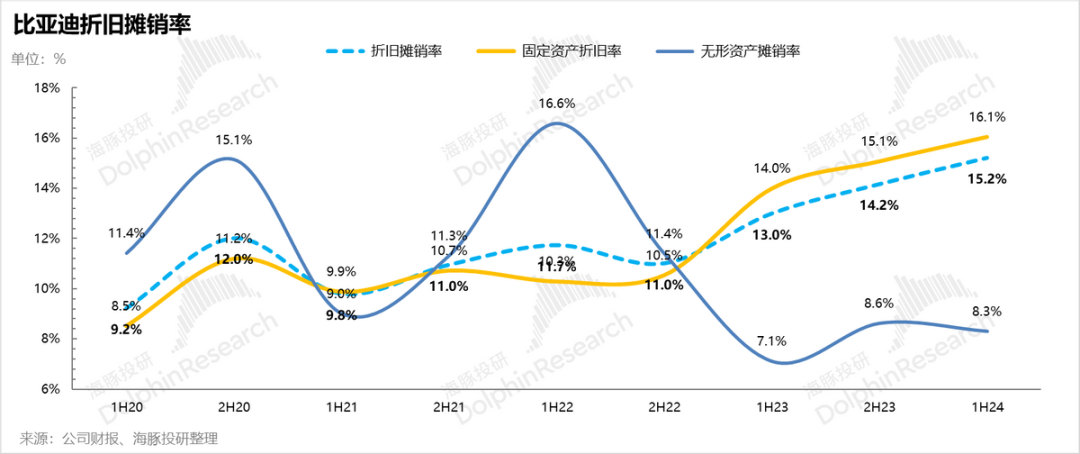
Another factor is the mismatch between peak capital expenditure and depreciation periods. From H2 2021 to the end of 2023, BYD ramped up investments in both fixed assets (completed projects and capacity) and construction in progress (ongoing projects). By 2024, with visible overcapacity in the new energy market, BYD slowed down these investments.
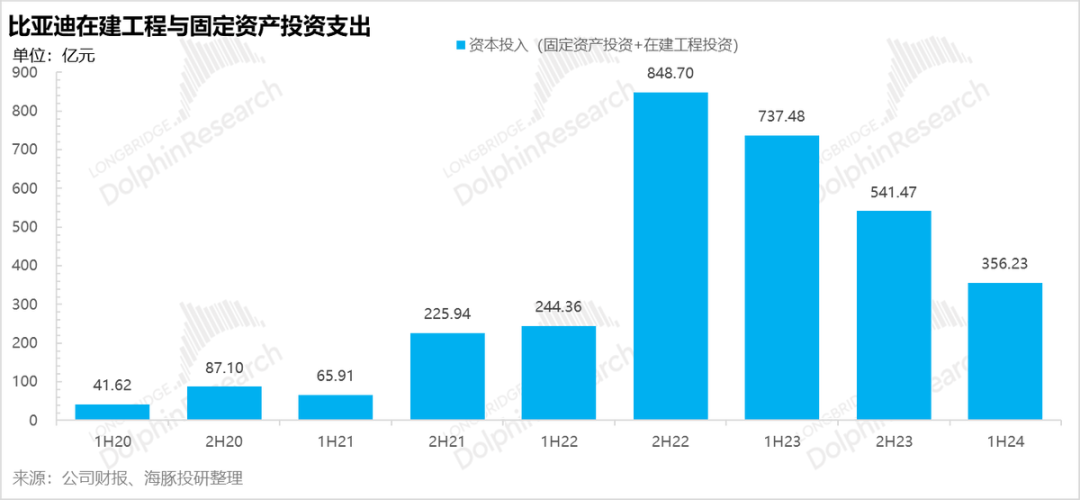
Although BYD's capital expenditures have slowed, the full impact of investments initiated in 2021 on profits is only now being felt in 2023 and 2024. As the full cumulative investment cycle from 2021 to 2023 enters the amortization/depreciation phase, amortization/depreciation expenses have skyrocketed.
Assuming the average original value of fixed assets in H1 2024 remained the same as in H1 2023, even with the increased depreciation rate, depreciation expenses in H1 2024 would have been nearly RMB 8.9 billion lower. This RMB 8.9 billion dragged down BYD's net profit margin by about 3 percentage points in H1 2024, indicating that the increase in the original value of fixed assets was the primary reason for the decline in gross margin during this period.
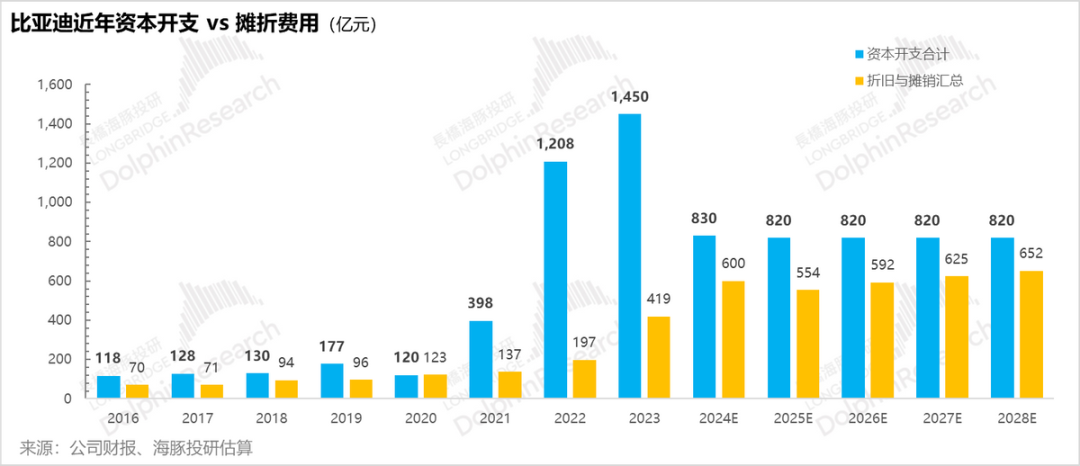
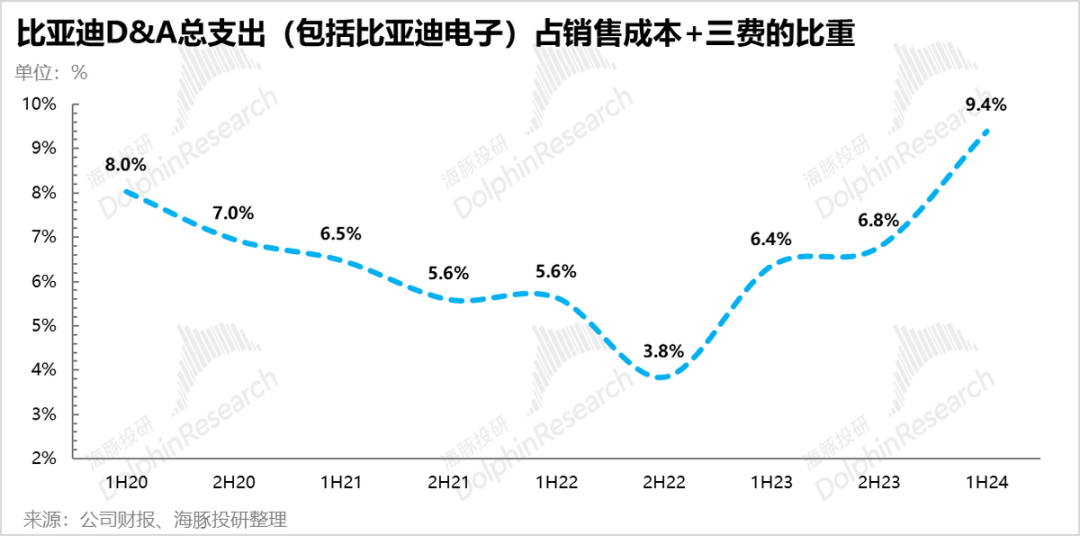
The surge in amortization/depreciation expenses not only reflects an absolute increase but also a rising weight in BYD's overall expense structure (cost + three major expenses). Excluding externally sourced variable costs like raw materials, amortization/depreciation expenses alone exceed the combined sales and R&D expenses of approximately RMB 30 billion per half-year. Such a significant absolute amount, which continues to climb, can only be diluted by sufficient sales volume or high asset utilization rates translating into actual sales revenue.
Examining BYD's vehicle economics over recent half-year periods, amortization/depreciation expenses per vehicle declined in H1 and H2 2022 as sales surged and capacity expansion was in its early stages, supporting gross margin. However, from 2023 onwards, amortization/depreciation expenses per vehicle increased quarter-on-quarter due to the growing fixed asset base and higher depreciation rates. High sales volumes could no longer offset the rising amortization/depreciation expenses, dragging down gross margin per vehicle.
2) Beneath BYD's Mask: The Truth and Fiction Behind Its Gross Margin
If the above explanation remains unclear, at least one conclusion is clear: BYD's reported gross margin is deceptive due to depreciation and investment cycles. Other new energy vehicle companies' meticulous gross margin analysis may not apply to BYD, whose gross margin might be misleading.
So, what are the real issues to investigate beneath the surface? In Dolphin's view, they include:
a. Is accelerated depreciation passive or active?
b. How long will the capital expenditure cycle last?
c. What is the expected future asset turnover rate or capacity utilization rate?
Dolphin's assessment of these questions follows:
a. Is Accelerated Depreciation Passive or Active?
Dolphin believes accelerated depreciation is primarily passive, though sales growth provides additional justification. Rapid advancements in battery technology, such as 4C charging, necessitate capacity upgrades for BYD's older production lines, which were originally designed for lower charging speeds. While the shortened depreciation period of three years poses some risk, with annual depreciation of 33% compared to peers' 20% or less, Dolphin considers this risk manageable.
b. How Long Will the Capital Expenditure Cycle Last?
1) From a fixed asset acquisition perspective, investments have slowed significantly. In H1 2024, fixed asset acquisitions totaled only RMB 13.1 billion, with the ratio of fixed asset acquisitions to revenue falling from 13% in H1 2023 to approximately 4.3% in H1 2024.
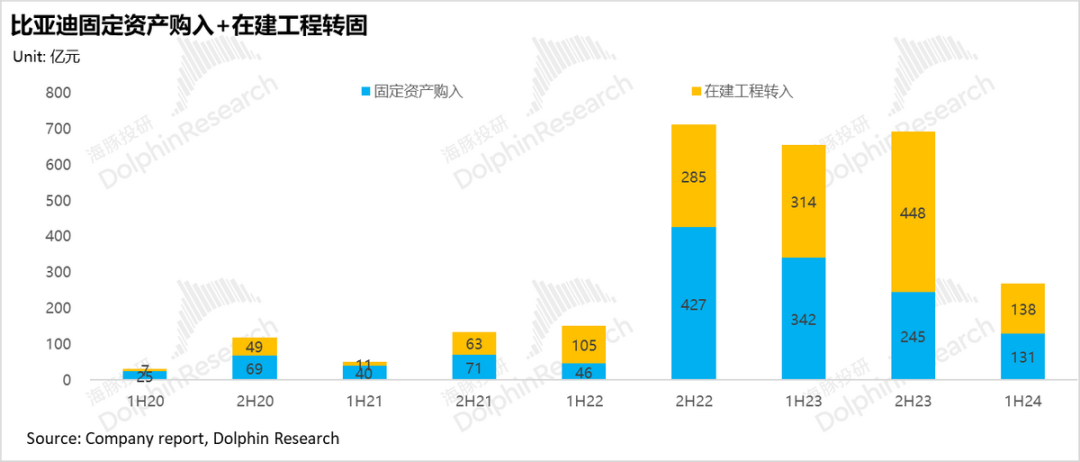
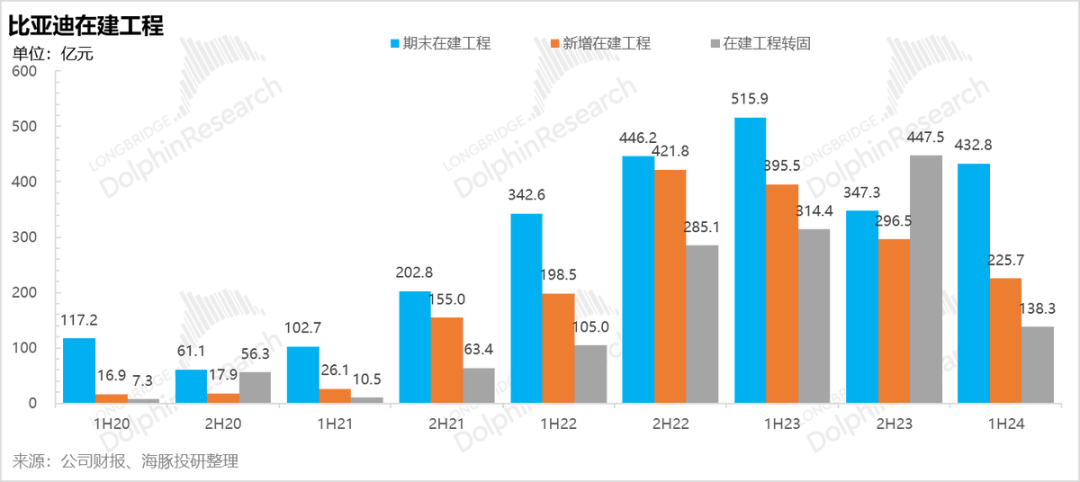
2) Examining changes in construction in progress, both new additions and transfers to fixed assets declined sharply in H1 2024. The previous wave of intensive construction in progress began in H2 2021 and peaked in late 2023, aligning with BYD's heavy investments in automotive and battery capacity.
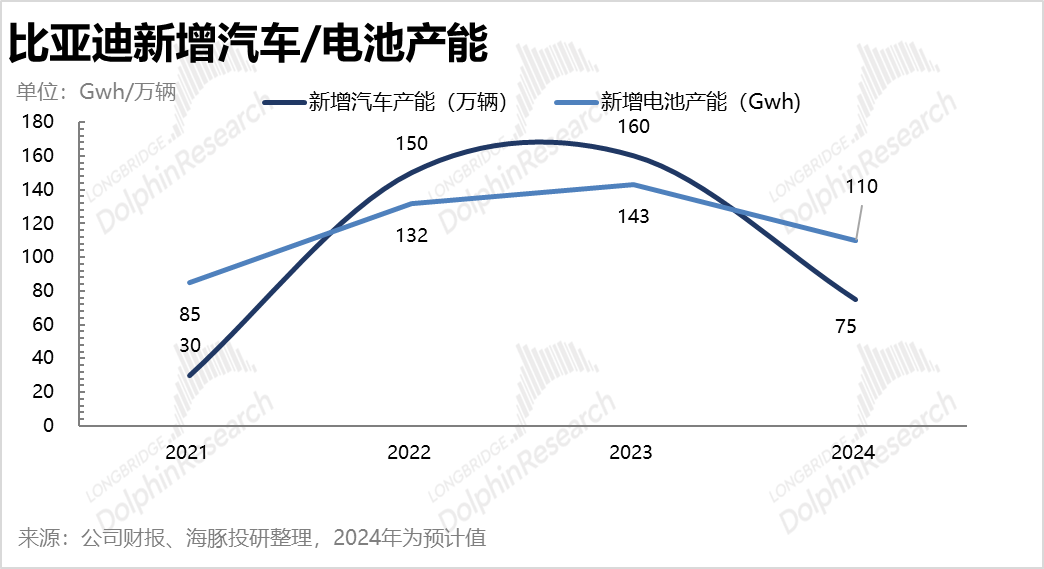
Based on BYD's current capacity plans (see previous article for details), domestic passenger vehicle capacity reached 4.7 million units by the end of 2023, sufficient for its 2023 production target of 4 million units. With an additional 1.97 million units under construction (Dolphin estimates 0.75 million new capacity in 2024, down from 1.6 million in 2023), total available and under-construction capacity exceeds 6.6 million units, meeting demand through at least 2026-2027.
Battery capacity is even more significant: at the end of 2023, BYD had approximately 450 GWh of battery capacity, significantly exceeding Dolphin's estimates of actual internal and external demand for Fudi Battery, even considering multi-shift operations. Without a substantial increase in external battery shipments, Dolphin believes existing capacity is sufficient to meet demand through at least 2027, with further slowdowns expected in under-construction battery capacity.
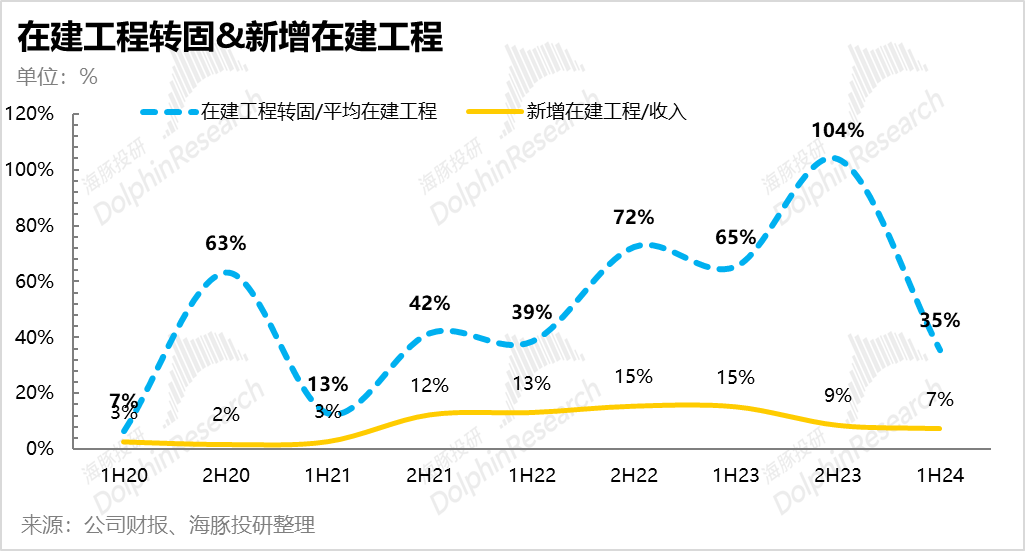
From a transfer-to-fixed-assets perspective, transfers peaked in H2 2023 (accounting for 104% of average construction in progress) but declined sharply in H1 2024, with only RMB 13.8 billion transferred, representing 35% of average construction in progress. Assuming no new construction in progress, BYD could complete all transfers within 1-2 years based on current balances and transfer rates.
The declines in fixed asset acquisitions, new construction in progress, and transfers to fixed assets in H1 2024, combined with ample current and future under-construction capacity (Dolphin expects a significant decline in new energy vehicle/battery under-construction capacity in 2024), suggest that BYD's upfront investments in vertical integration have reached a temporary conclusion.
c. What is the future outlook for capacity utilization, i.e., asset turnover capability?
This question essentially boils down to a study of sales dynamics and demand. As previously analyzed in "BYD: The Final Battle!," Dolphin believes that BYD's key to success in the second half lies in leveraging its vertical integration strategy to gain market share in the mid-to-low-end market through increased sales, thereby enhancing capacity utilization and diluting depreciation costs. The frequent price cuts across BYD's various product lines indicate that it is indeed pursuing this strategy.
Moreover, with a gross margin advantage of over 20% compared to most competitors struggling with negative gross margins or barely breaking even, BYD is well-positioned to execute this downward competitive strategy effectively.
III. How does this affect investment decisions?
By now, it should be clear why investors tend to react less to BYD's gross margin performance and more to sales figures. Given the company's rapid and substantial capital investments in the past, the only viable way to improve asset turnover is through a surge in sales. Any decline in sales momentum can doubly penalize BYD due to its vertical integration strategy.
Given this context, how should we view BYD's investment value? Before delving into this, let's address the potential impact of depreciation on short-term performance:
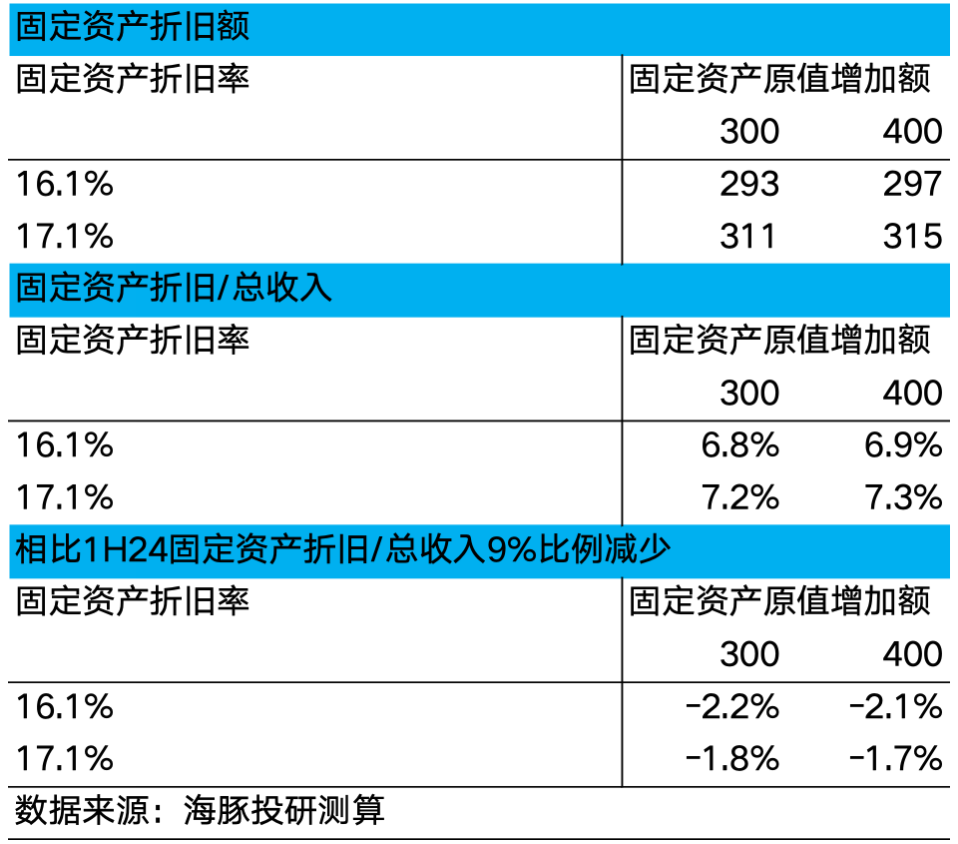
For the second half of 2024, given that fixed asset investments have started to slow down, Dolphin will base its projections on the first-half trends. Meanwhile, the fixed asset depreciation rate has been rising sharply since 2023, indicating that BYD is adopting accelerated depreciation. We will consider two scenarios for the second-half depreciation rate:
① The depreciation rate remains at around 16.1%, similar to that of the first half of 2024.
② The depreciation rate continues to increase by approximately 1% every six months, reaching around 17.1% in the second half.
Turning to revenue, given the strong certainty of DMI 5.0 launches in the second half, we project annual sales of 4 million vehicles, representing a 48% quarter-on-quarter increase from the first half. This should lead to some economies of scale.
Furthermore, the launch of DMI 5.0 models ranging from low to high prices, combined with an increasing proportion of exports, are expected to drive up ASPs in the second half. Dolphin projects a 52% quarter-on-quarter increase in automotive revenue to RMB 347.8 billion, with total revenue rising 43% to RMB 429.5 billion.
We have tested the impact of these scenarios on revenue (and thus profit). Given the slowdown in fixed asset investments and the release of economies of scale coupled with higher ASPs, the proportion of fixed asset depreciation to total revenue is expected to decrease by 1.7-2.2 percentage points quarter-on-quarter in the second half of 2024. In other words, depreciation factors in the second half can still help restore gross margins by approximately two percentage points compared to the first half.
Provided BYD maintains its sales targets in the second half of 2024, its gross margins should experience a modest recovery.
From a long-term perspective, capital expenditures and depreciation primarily impact financial statements in two ways:
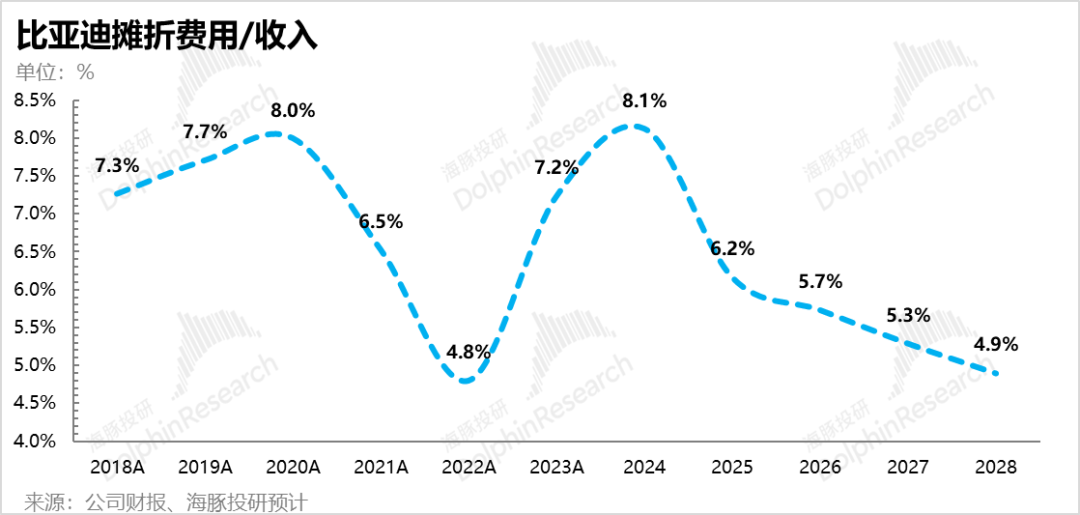
1) As capital expenditures slow down, the growth rate of subsequent depreciation and amortization expenses is expected to decelerate. Meanwhile, economies of scale from increased sales volumes should lead to a gradual decline in the proportion of depreciation and amortization expenses to revenue after peaking in the first half of 2024, thereby releasing profits on the financial statements.
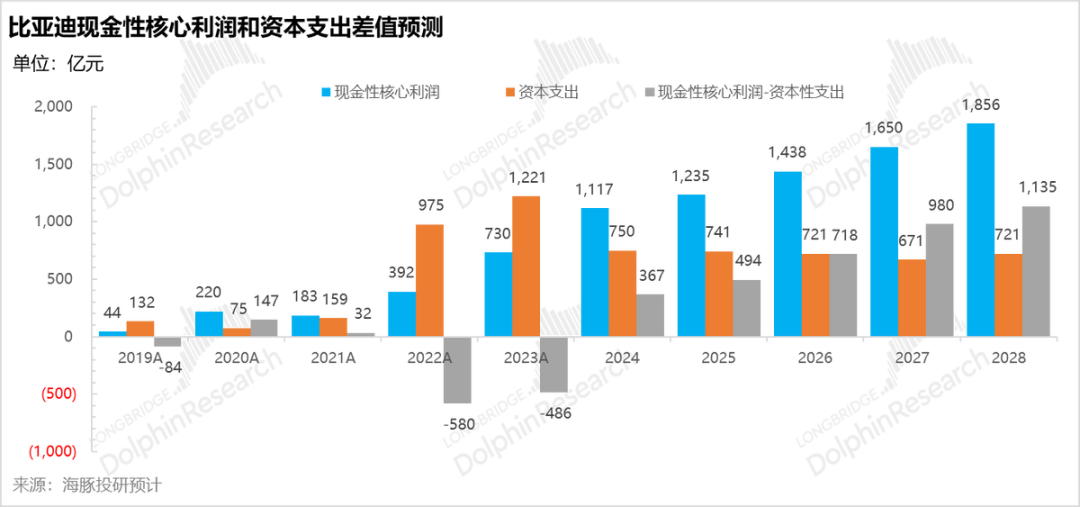
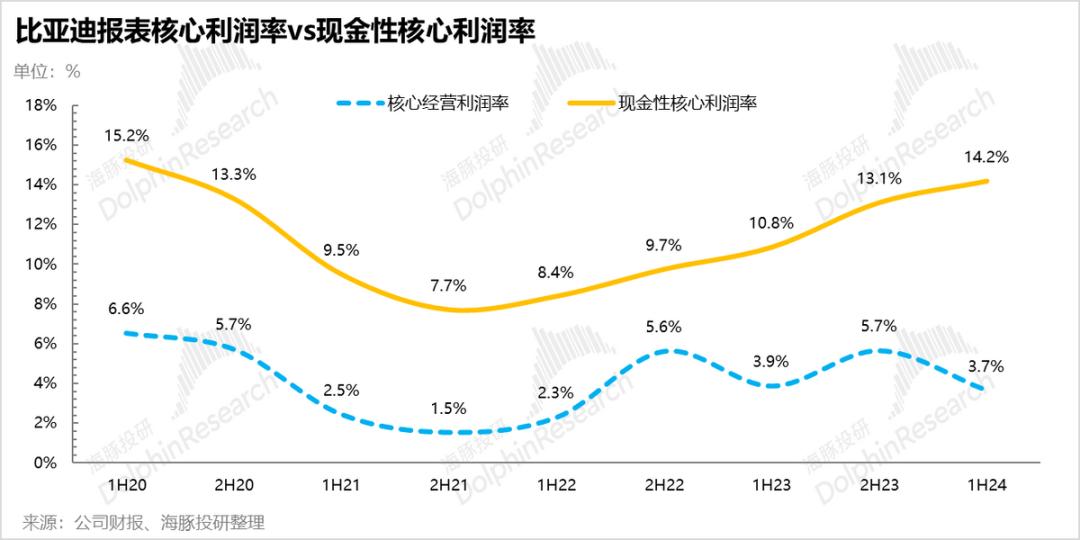
2) Performance Observation: When sales volumes are known or predictable, focus on core operating profits, i.e., revenue minus cost of goods sold, selling, general, and administrative expenses, and asset/credit impairment/asset disposal gains. Additionally, calculate a proxy for cash operating profits by excluding depreciation and amortization expenses to gauge the company's true operating profit trend.
3) Assess the true operating profit after adjusting for the distortions caused by depreciation and capital investments. Building upon the aforementioned cash operating profits, further exclude capital expenditures to determine the true retained earnings available for shareholder distributions.
Dolphin's projections based on current performance trends suggest that the inflection point for BYD's true cash profits has arrived. As capital expenditures slow down in the second half of 2024, true cash profits are beginning to turn positive and be released.
As previously stated in "BYD: The Final Battle!," Dolphin believes that BYD will generate genuine retained earnings for sustained shareholder returns only when its true profits start to materialize. BYD's investment logic is gradually shifting from growth potential to shareholder returns based on business certainty as a leading company. While growth-oriented investors may exit, value-oriented investors will likely discover BYD's appeal once the handover is complete.
