Costco: How Does the Retail “Snail” Achieve Invincibility?
![]() 09/29 2024
09/29 2024
![]() 608
608
In the first article of our Costco research series, we identified two key aspects of Costco's unique value proposition:
1) A demand side that consistently grows, largely unaffected by macroeconomic and technological cycles. This is due to Costco's commitment to low gross margins (i.e., markups), passing savings onto consumers, focusing on high-quality products, catering to middle-class consumers who are more resilient to economic downturns, and specializing in categories with perpetual demand such as food, fresh produce, and daily necessities. Costco's approach prioritizes stability and longevity over rapid growth.
However, Costco's consistent but unspectacular growth alone would not have made it an industry benchmark. 2) The second key aspect of Costco's scarcity lies in how it achieves profitability comparable to its peers despite actively compressing gross margins and self-imposed constraints. This is achieved through superior supply chain, store, cost, and expense management. This is the main topic of our discussion in this article.
Below is the main analysis content:
1. Low Gross Margin, Low Expense Ratio, Yet Respectable Profit Margin
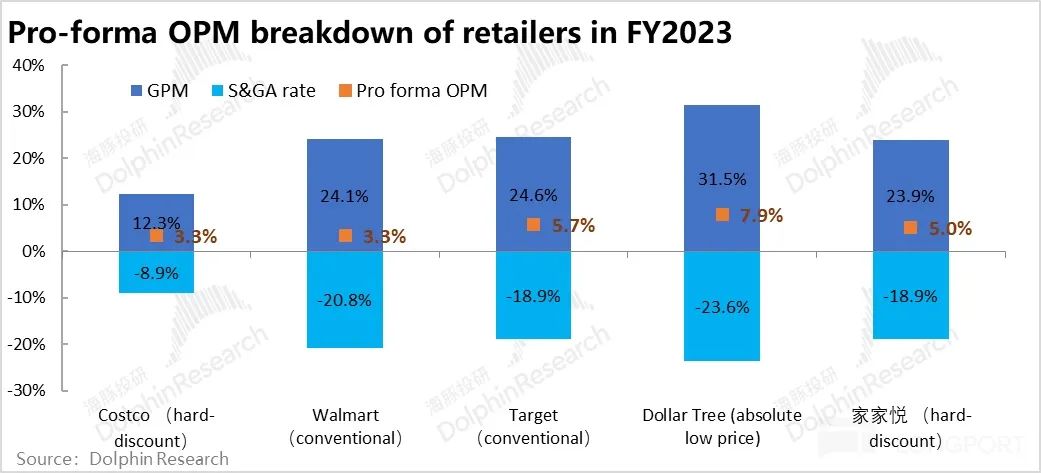
Starting with the results, in fiscal year 2023, Costco achieved a gross margin of just over 10% (10-20 percentage points lower than its peers), with operating expenses accounting for only 8.9% of revenue, compared to at least 19% or more for its typical competitors. Despite the low gross margin, Costco's operating profit margin was slightly above 3%, thanks to its low expense ratio.
Among various retail formats, Dollar Tree, with its soft discount model, had the highest profit margin of nearly 8% (demonstrating that absolute low-priced goods may offer higher profit margins than mass-market products). Most offline retail formats have comparable operating profit margins ranging from 3% to 6%. While Costco's profit margin is at the lower end of this range, it is not significantly lower than its peers.
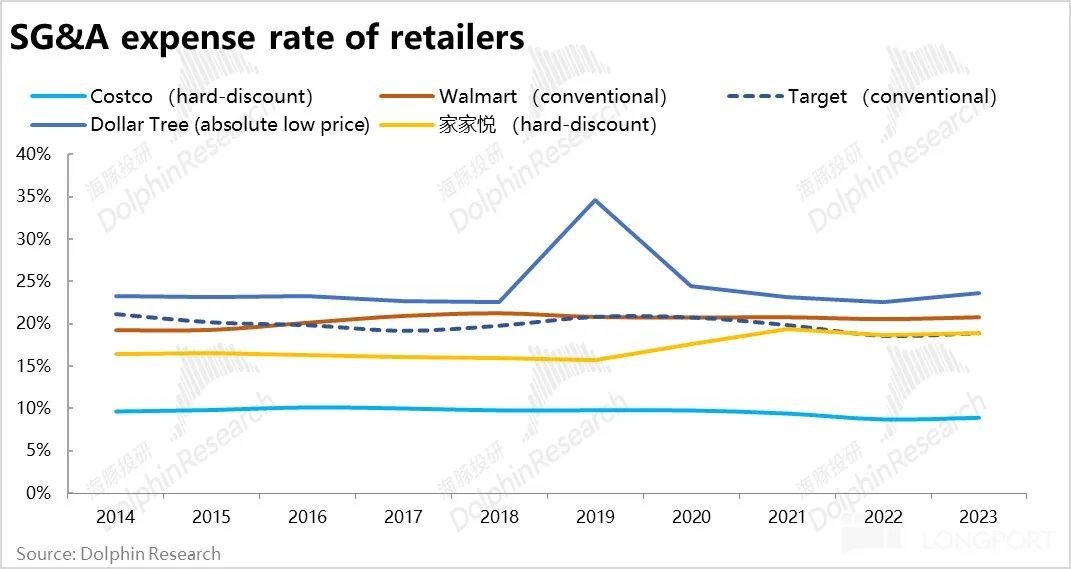
Over time, offline supermarket retail, as a mature business, has seen relatively stable operating expense ratios across formats and markets, with only minor fluctuations around the central levels determined by their respective business models and strategies. Between 2010 and 2023 (excluding the pandemic-affected year of 2020), Costco's operating expense ratio remained stable, fluctuating within the range of 9% to 10%. This suggests that without significant changes to its business model, there is limited room for a trend-based reduction in operating expenses for offline supermarkets.
This leads to the main purpose of this article: to explore how Costco manages to maintain a comparable operating profit margin despite its significantly lower gross margin compared to its peers. Furthermore, how does Costco deliver superior service quality and customer appeal while maintaining operating expenses that are less than half of its peers?
2. The True Secret Behind Costco's Low Expense Ratio: Exceptionally High Store Productivity
From a results perspective, Costco's operating expense ratio (as a percentage of revenue) is nearly 10 percentage points lower than that of other leading offline supermarkets. What are the specific reasons for this gap? Logically, there are two angles to consider: absolute efficiency advantages (i.e., lower absolute operating expenses per store) or the ability to spread costs over higher sales volumes.
Since a significant portion of operating expenses in offline supermarket retail are relatively rigid, such as rent, equipment depreciation, utilities, and personnel costs, these expenses remain largely constant regardless of sales volume. Therefore, analyzing store-level data can help us unravel the mystery behind Costco's low operating expense ratio.

In the chart above, we compare the store-level revenue and operating costs of Costco and BJ's Wholesale (a North American-focused membership warehouse retailer, highly comparable to Costco). Costco's average store operating expense in fiscal year 2023 exceeded $25 million, while BJ's was approximately $8.4 million. While Costco's absolute store-level operating expenses are higher, they are not significantly lower than BJ's. Furthermore, Costco and BJ's have similar store sizes (both over 10,000 square meters), and BJ's has a higher number of SKUs, suggesting that BJ's lower store-level operating expenses are not due to smaller store sizes or lower inventory levels.
The true secret behind Costco's lower operating expense ratio is its exceptionally high store-level sales, averaging nearly $290 million, which is 3.4 times that of BJ's. In other words, Costco invests twice as much in store-level expenses to generate three times the sales. Costco is not “stingy” with its expenses; it actually incurs higher operating costs than its peers to deliver superior service quality and user experience (as discussed in more detail later). The key to Costco's success is generating higher store-level sales that spread these higher costs.
3. What Drives Costco's High Store Productivity?
As discussed earlier, one of Costco's key strengths is its significantly higher store-level sales capacity, or sales per square meter. Compared to other membership warehouse retailers like Sam's Club and BJ's, Costco's store-level sales are nearly double that of Sam's Club and over three times that of BJ's. Even after adjusting for store size differences, Costco's sales per square meter remain significantly higher. The question we seek to answer is: what factors enable Costco to achieve store-level sales and productivity multiples of its peers?

Based on customer spending per visit and shopping frequency data from several typical supermarkets, Costco's average annual spending per customer is approximately $3,000, similar to Walmart's $2,800. However, Costco's store-level sales are approximately three times that of Walmart.
With little difference in per capita spending, the significant disparity in store-level sales can only be explained by the fact that Costco serves significantly more customers per store than its peers, estimated to be approximately 2-3 times that of Walmart and Target.
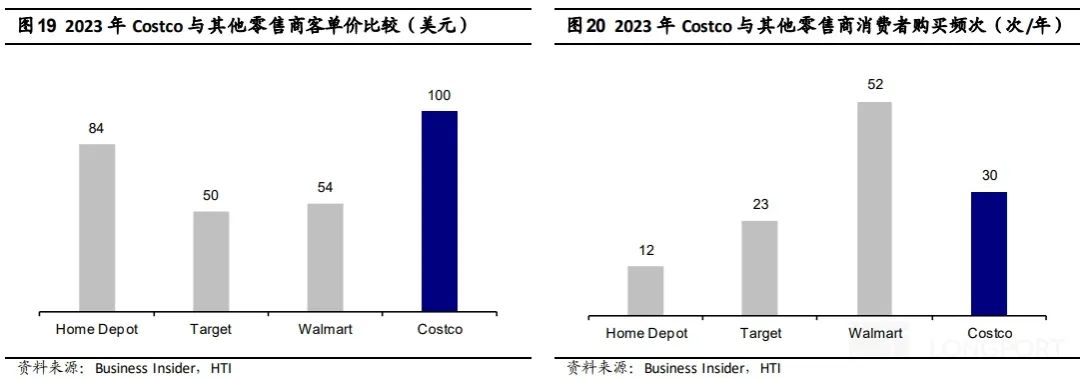
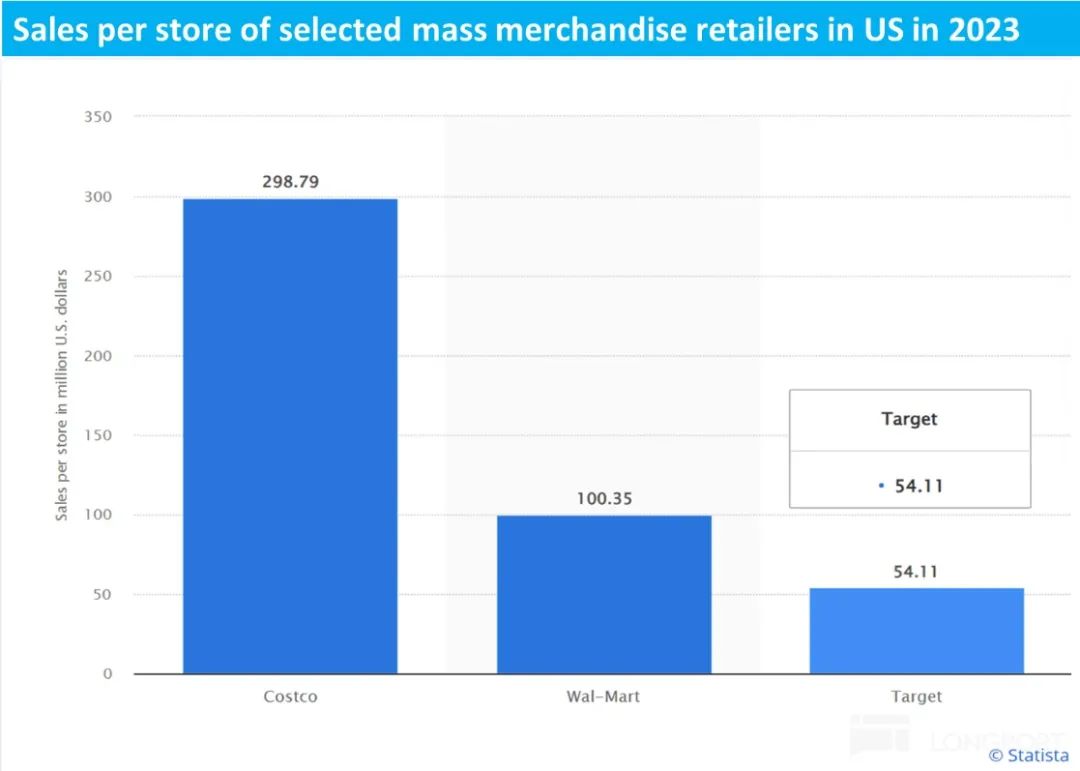
As a cross-validation, the average number of members served per store by Costco is approximately three times that of BJ's, which aligns with the approximately three-fold difference in store-level sales between the two companies. This suggests that Costco generates comparable revenue per customer as compared to Walmart and BJ's (i.e., Costco does not significantly outperform its competitors in terms of average spending per customer or shopping frequency). Instead, the primary driver of Costco's higher store productivity and sales is the significantly larger customer base served per store.

How can we interpret Costco's ability to serve several times more customers per store than its peers? Dolphin Research believes there are several possible explanations:
① Firstly, comparing Walmart and Costco, we believe the difference in store density is likely the primary factor contributing to the approximately 2-3 times higher customer base per Costco store. Currently, Walmart has over 4,600 stores in the US, including over 3,500 supercenters. In contrast, Costco has only around 600 stores nationwide. Walmart has 7.7 times more stores nationwide and 5.8 times more supercenters than Costco.
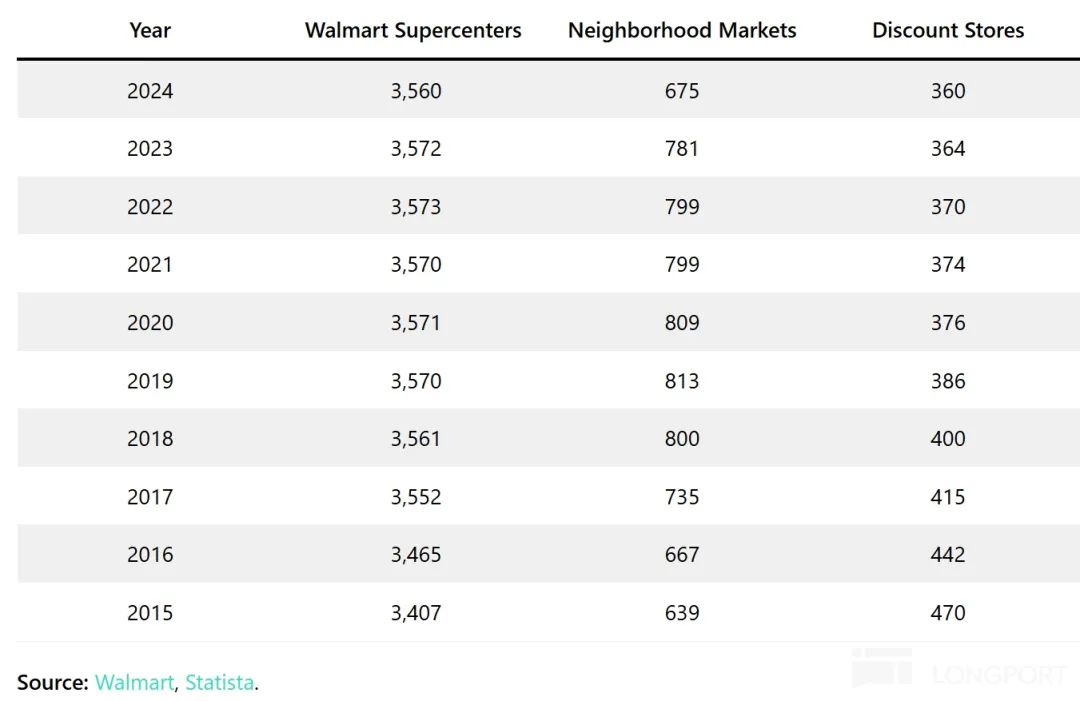
How does store density impact store productivity? Let's consider an idealized scenario where there are 100 consumers in a given market with equal spending power. Assuming Walmart and Costco offer identical service/product quality and consumer appeal, but differ only in store density (at a 7:1 ratio), both retailers would attract 50 consumers each, generating equal total revenue. However, Costco would serve seven times as many customers per store as Walmart. In this scenario, to generate the same revenue, Costco would incur the expense of operating just one store, while Walmart would bear the cost of seven stores, leading to a significant difference in expense-to-revenue ratios.
In reality, Walmart's larger and denser store network reaches more consumers than Costco. However, the difference in customers per store is 1:2-3, not 1:7 as in the idealized scenario. While increasing store density can help reach more new customers, the marginal benefit of new stores inevitably diminishes as the total store count grows, leading to a decline in store productivity. This is a well-known principle.
Costco's decades-long commitment to a “slow” store opening pace (typically just a dozen new stores per year) reflects this philosophy. By carefully controlling store openings, Costco minimizes cannibalization between stores, prioritizing customer base and sales per store over total revenue, thereby spreading operating costs. In other words, Costco prefers earning a full revenue from one store over earning partial revenue from ten stores.
② However, this logic holds only if retailers can sufficiently attract consumers to visit their stores despite their lower density. Quantitatively assessing the attractiveness of different retailers to consumers is challenging. Nonetheless, given that Costco's average store operating costs are more than double those of BJ's, Dolphin Research believes that Costco spends more on expenses and labor costs to provide high-quality services, thereby enhancing its appeal to consumers.
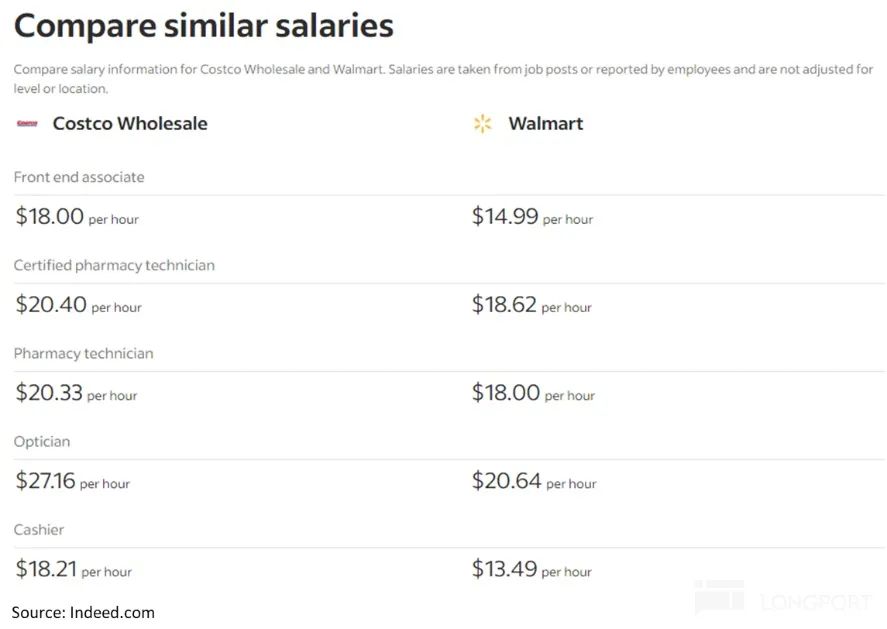
As indirect evidence, according to survey data from a US job recruitment website (which may deviate from official disclosures), Costco's frontline employees earn an average wage at least 10-20% higher than Walmart's. This suggests that Costco offers better employee compensation than its peers.
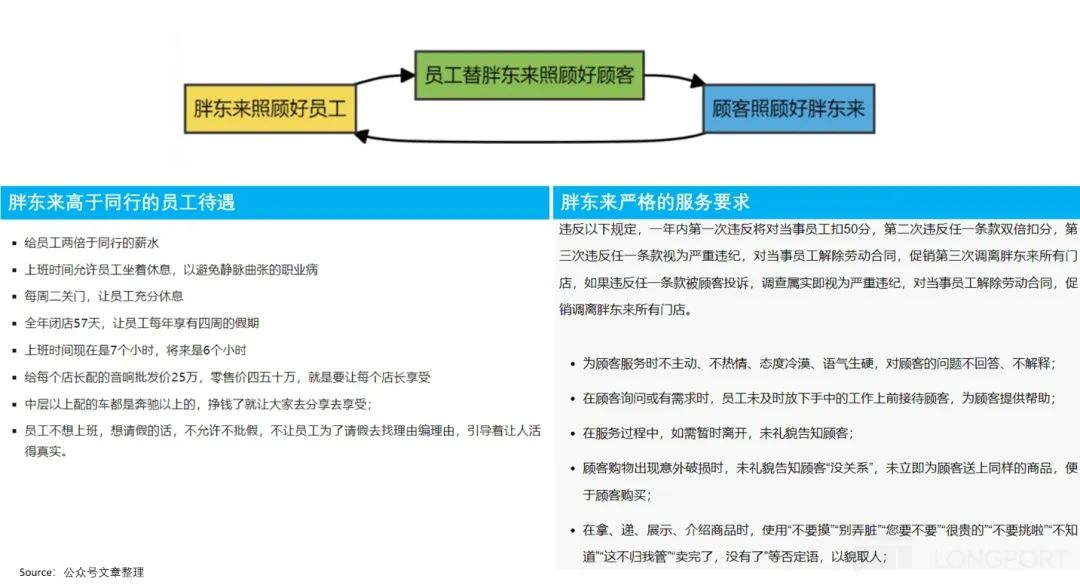
Another indirect validation of the logic “higher employee compensation → better service & exceptional customer experience → stronger customer appeal/loyalty” can be found in the Chinese market with the case of Pangdonglai.
According to online accounts of Pangdonglai's business practices, its employees enjoy significantly higher wages, vacation time, and various employee benefits compared to industry peers. At the same time, Pangdonglai imposes stringent service standards on its employees, with contract termination for three instances of poor customer experience. In essence, Pangdonglai invests in high compensation and benefits to ensure employee stability and service willingness, which, combined with rigorous service standards, delivers a superior shopping experience to customers. Despite having only a few stores with low density, Pangdonglai attracts local and national customers who travel specifically to shop there, validating the feasibility of the strategy of making customers come to the store.
Thus, we believe that Costco, with similar experience and concepts, is likely to achieve low store density & high operating cost investment, but higher store coverage of users & high per-store sales through similar strategies, which in turn dilutes operating costs in a "roundabout way".
Summarizing the analysis in the second and third paragraphs above, it can be seen that similar to Costco's strategy of providing relatively low prices for high-quality, high-priced goods on the sales side, rather than absolute low prices for low-quality goods, Costco also chooses high costs & good service on the expense side, relying on stronger per-store sales to dilute expenses, rather than low costs & low service, which is a simplistic cost-control logic.
4. Streamlining SKUs and reducing supply chain burden
In addition to the top-notch store performance brought about by "actively" controlling store density and the "people finding stores" approach, Costco's "streamlining" of SKUs has also contributed to diluting operating costs. According to statistics, Costco's sales per SKU are approximately 3.9x that of Sam's and up to 16x ~ 40x compared to BJ's / Walmart / Target. Taking the reciprocal of this significant difference in sales per SKU reveals the obvious advantage of Costco's average per-SKU supply chain & management costs being diluted by sales.
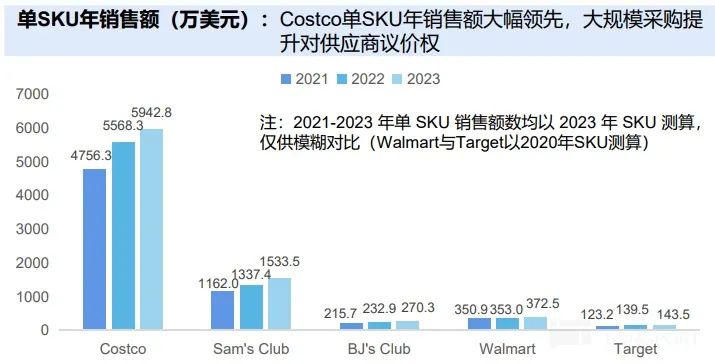
Put more bluntly, Costco's significantly lower SKU count of around 4,000 compared to its peers logically translates to relatively lower management costs on the numerator side (e.g., fewer suppliers to coordinate with, fewer points of difference in storing and transporting goods), while per-store sales on the denominator side are 2~3x higher than peers. The resonance between these two factors underscores Costco's significant efficiency and cost advantage in its merchandise procurement supply chain.
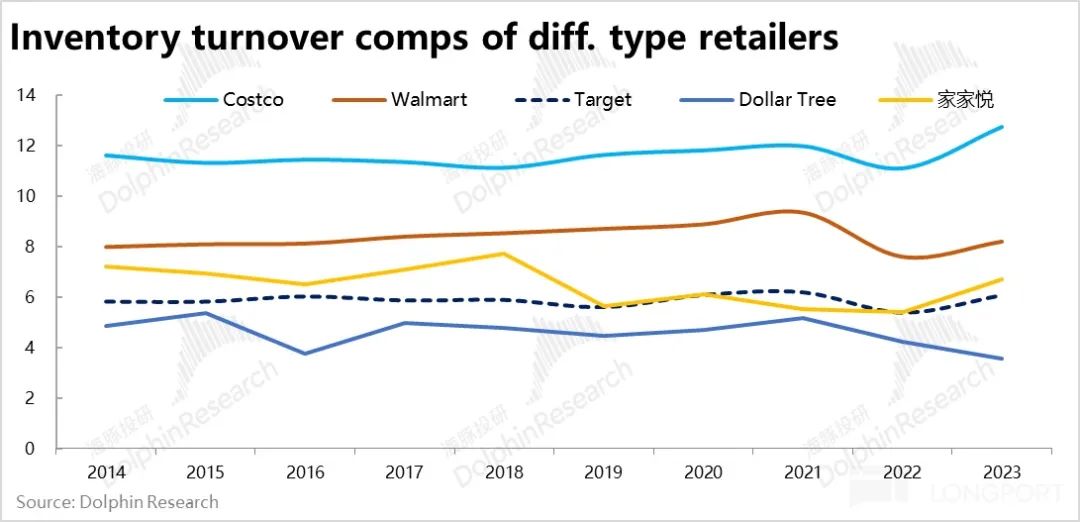
Extending from Costco's significantly higher sales/SKU ratio compared to its peers, with fewer inventory types and stronger sales per square meter, Costco's annual inventory turnover rate has consistently been above 12x over the years, while its peers are generally below 8x. This means that Costco's inventory ties up capital for at least 1/3 less time than its peers, with potentially fewer inventory losses.
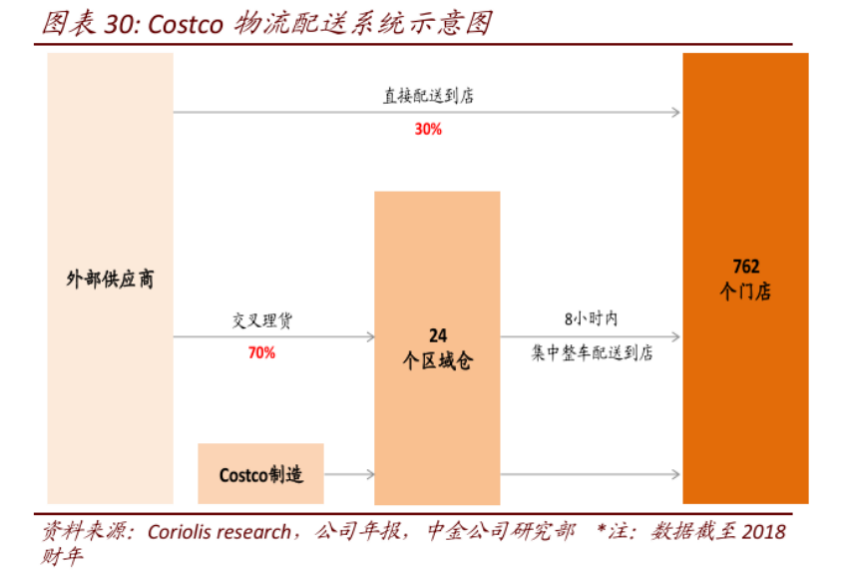
And to further reduce supply chain and transportation costs, Costco has specifically established a supporting logistics and distribution system. As shown in the figure below, only about 30% of Costco's total merchandise (possibly those with higher timeliness requirements) is directly delivered to its 800 stores, while 70% of supplies are first centrally distributed to over 20 regional warehouses before being delivered to the stores. In essence, this compresses the complexity of distribution from 800 to 20+, thereby reducing distribution costs.
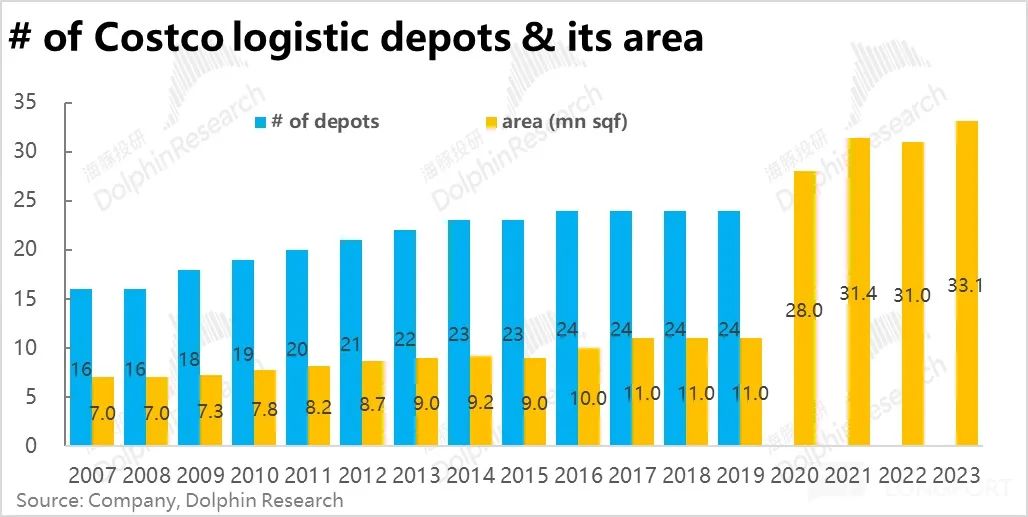
From 2007 to 2019, it can be seen that Costco's distribution centers and areas have both grown by nearly 60%, which is close to the approximately 60% increase in the number of Costco stores from 488 to 783 during the same period. In other words, the pace of new distribution centers and new stores is almost a 1:1 match, and it has not slowed down as Dolphin Investment Research had hoped. It can also be seen that Costco is not pursuing increased workload per distribution center to dilute costs.
On the contrary, Costco acquired Innovel (a logistics company) in 2020, and as seen in the figure below, the area of distribution centers jumped more than twofold in 2020 to enhance logistics and distribution efficiency and timeliness and cope with the growth of Costco's online retail business.
5. Private label accounts for 1/3, but is not outstanding
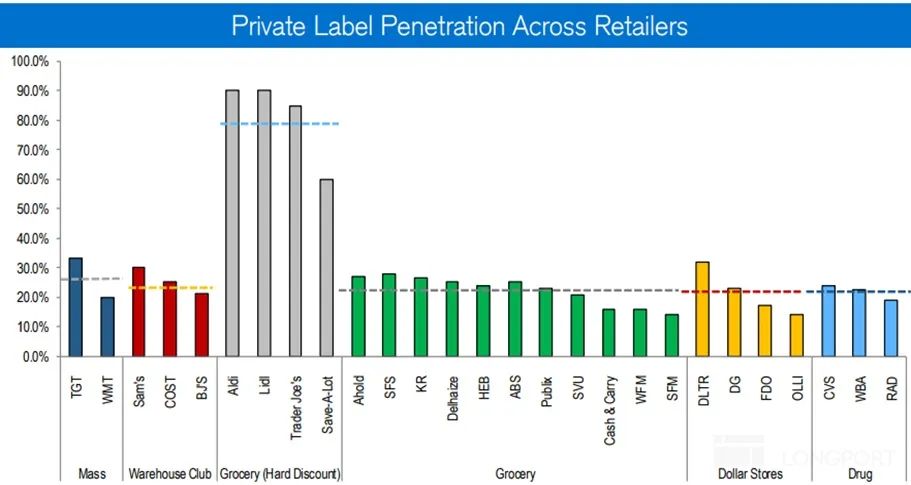
Private label/own-brand merchandise is a common practice across various retail channels (not just supermarkets), and Costco is no exception. The benefits of private label merchandise include: ① Reducing supply chain layers, thereby lowering backend production costs and frontend prices; ② To some extent, private label merchandise also addresses the issue of product homogeneity in retail channels, mitigating the problem of "me too" offerings and enhancing customer loyalty. In terms of results, both revenue and SKU share from Costco's private label, Kirkland, are already around 30%. From an absolute perspective, Costco's achievements in private label merchandise are quite good.

However, comparatively speaking, across various retail industries (including mass merchandisers, membership discounters, $10 stores, pharmacies, etc.), Costco's approximately 30% share of private label merchandise can only be considered average. In contrast, Aldi's private label merchandise accounts for up to 70%~80%. Therefore, Costco's private label merchandise does not stand out significantly.
6. Self-owned properties, slow store openings but no rent to pay
As mentioned earlier, despite Costco's growing scale and market capitalization, the number of new stores opened each year has mostly remained below 20. This conservative pace of store openings actually contributes to cost and expense savings. Nearly 80% of Costco's store properties are self-owned, and in many cases, Costco handles land site selection, auction, and store construction itself, which takes much longer than leasing and building properties. This explains why Costco's pace of store openings is notably slow, constrained by objective conditions.
Compared to the asset-light model, which allows for rapid expansion through leasing and reduces upfront capital investment pressure, Costco has chosen to go against the grain by adopting a heavier model, consistently pursuing stability over speed. However, Costco's majority ownership of its properties significantly reduces the company's exposure to rising rental costs over time and inflation. According to company disclosures, Costco's rental costs account for less than 0.15% of revenue, compared to low single-digit percentages (e.g., 2%~5%) of total operating expenses for typical supermarkets, where rental costs typically account for around 15%~20% of total expenses. In other words, after the depreciation period of self-owned properties, rental costs alone could contribute a few percentage points to Costco's profit margin.

7. Membership fee revenue - a bonus and "stabilizer" for profits
So far, we have primarily discussed how Costco's operating expense ratio is significantly lower than that of its peers (by at least 5 percentage points) from the perspective of "efficiency enhancement and cost reduction." However, Costco's operating/net profit margins are not overly lagging behind those of its peers. From a "revenue generation" perspective, the membership model adopted by Costco, which generates membership subscription revenue, is also a crucial factor. Besides the functions mentioned in our first research article, such as actively screening user groups, precisely matching supply and demand, and enhancing user stickiness, membership fees are also an important supplement to Costco's profits on the financial level.
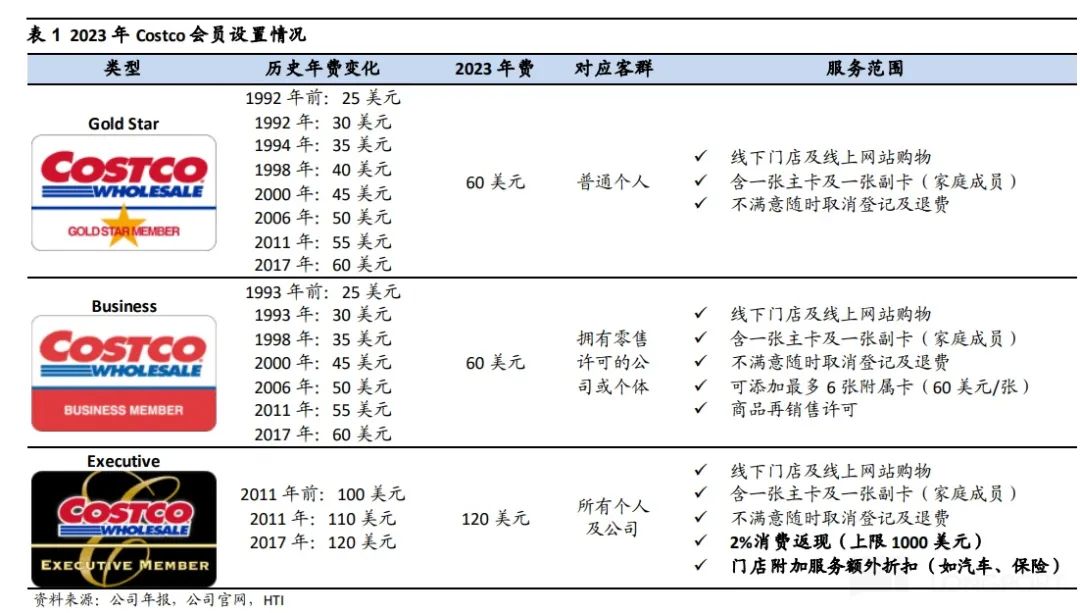
As shown in the figure below, Costco offers a three-tier membership system, colloquially known as "regular membership," "business membership," and "executive membership," with annual fees of $60, $60, and $120, respectively. Historically, membership fees have increased every few years, but the increases have been modest (ranging from $5 to $10 per increase).
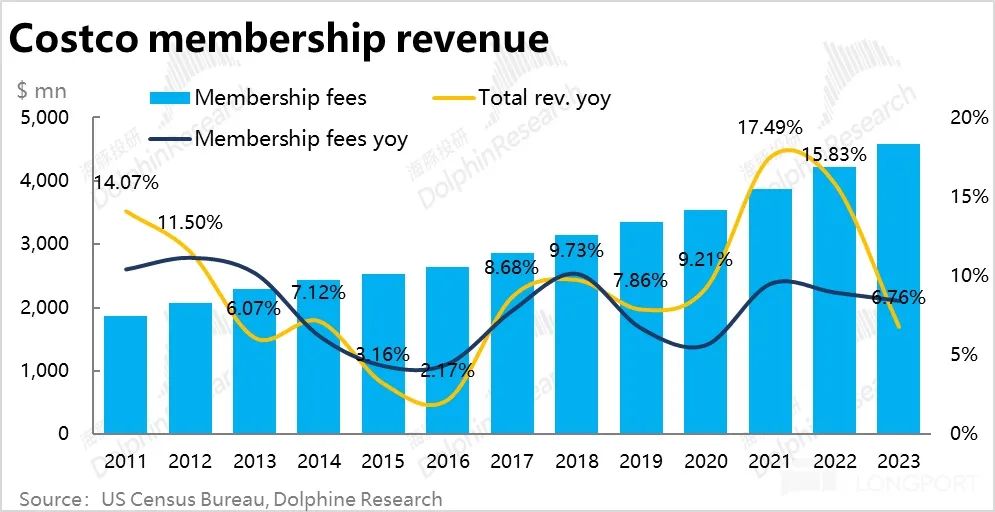
As seen in the figure below, membership fees have consistently contributed tens of millions of dollars in revenue over the years, accounting for approximately 2% of total revenue. The year-on-year growth rate of membership fee revenue has generally been around 10% since 2011, with lower volatility compared to overall revenue. It can be said that membership fee revenue is more of a "stabilizer" rather than a "driver" of revenue growth.
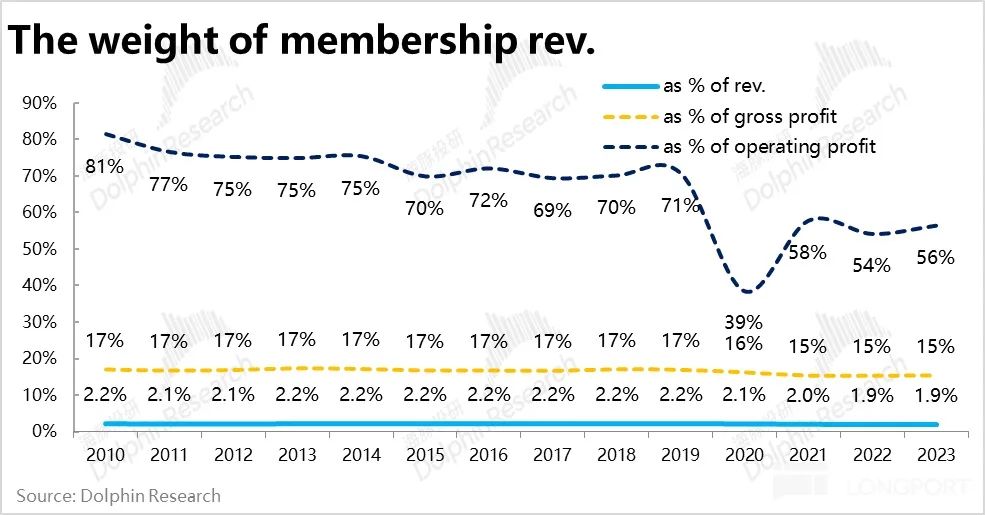
In terms of profit contribution, membership fee revenue once accounted for 70~80% of Costco's total operating profit in the 2010s but has been slowly declining, falling sharply to around 50~60% post-pandemic. However, unlike some market views that membership fee revenue is the primary source of Costco's profitability, Dolphin Investment Research believes this perspective is misguided. From a gross margin perspective, we believe that membership fee contributions of approximately 15~17% more accurately reflect their importance to Costco's profits, with the retail business itself being the true crux.
While this may seem inconsequential, it underscores how we view Costco's true value. Membership fees are built upon the outstanding and scarce shopping experience that Costco provides through various operational trade-offs, as discussed in our previous analyses. Rather than the other way around, membership fees are more of a bonus to profits, not qualitatively different from the company choosing to slightly increase markups by 1~2%. Furthermore, as Costco's retail profits continue to improve, the declining share of membership fee revenue speaks for itself.
Fundamentally, the greater value of membership fees lies in: ① They are prepaid, preceding costs and expenses, providing a predictable and stable source of cash flow, which is particularly crucial during the early stages of a company's development (and indeed contributed a higher proportion of early profits). ② By substantially supplementing and securing the company's bottom-line profits through membership fee revenue, Costco has more motivation and possibilities to make operational decisions from the perspective of serving members well, rather than determining its own gross margins or profits (e.g., selling products with potentially inferior quality but higher profit margins for the company). This better ensures the interests of both users and the company are aligned.
8. Summary
Through these two articles, we have explored Costco's business strategies from both the revenue and cost/expense perspectives. Costco's approach of opening stores slowly, offering a small but curated selection of SKUs, and pursuing "relatively low prices for high quality" rather than "absolutely low prices for low quality" in both merchandise and services aligns with a strategy of "subtraction" and "going slow but steady." This choice of "subtraction" actually lightens the operational load, as fewer stores and better SKUs naturally reduce the breadth and complexity of Costco's store and supply chain management. However, the crux is that Costco relies on its superior service and products to generate strong customer loyalty and multiple times the store and sales per square meter of its peers, effectively diluting its actually substantial expense investments.
In the final article of this series, we will focus on potential untapped opportunities, exploring whether Costco offers unique shareholder returns beyond its financial performance, and how to interpret Costco's current valuation.
Dolphin Investment Research's previous Costco research:
September 10, 2024, "Pinduoduo's Idol - Is Costco the Ideal Retail Model?"
- END -
// Reprint Authorization
This article is an original work of Dolphin Investment Research. For reprinting, please obtain authorization.


