Global Auto Financial Insights: The Stability of Chinese Auto Companies
![]() 05/12 2025
05/12 2025
![]() 506
506
In recent years, China's automotive industry has witnessed rapid growth, intensifying competition. Concurrently, there has been considerable debate regarding the debt ratio within the sector.
Typically, manufacturing enterprises maintain an asset-liability ratio of 40%-60%. However, the automotive industry, with its extended supply chain and higher financialization, often registers a relatively higher asset-liability ratio, frequently exceeding 60% and sometimes even touching 80%.
Focusing on China, the question arises: Are Chinese auto companies' asset-liability ratios truly high? Beyond this metric, what is the genuine debt profile of these companies? The answers to these queries lie within their publicly disclosed financial reports.
Are Chinese auto companies' debt ratios excessively high?
Let's address this with data:
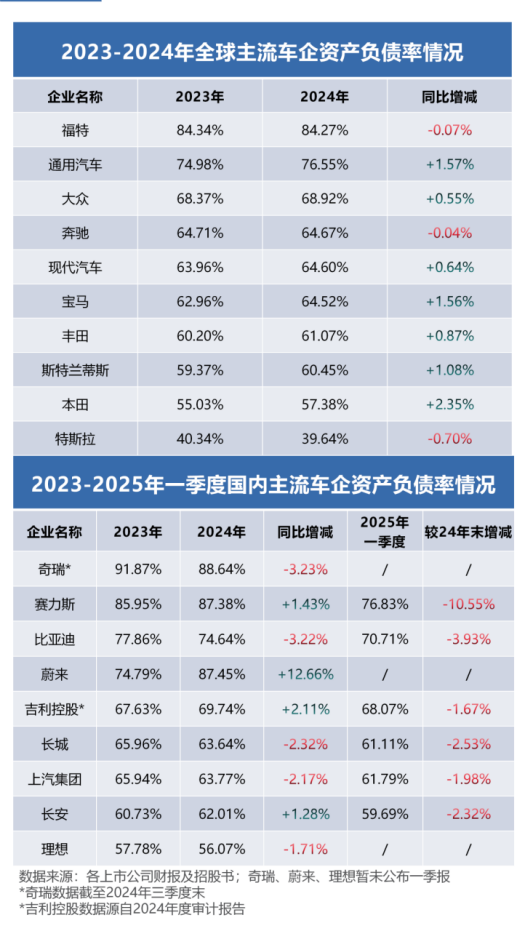
The chart clearly indicates that Chinese auto companies' asset-liability ratios are on par with the international average. Moreover, the debt ratios of most Chinese auto companies are on a declining trend, suggesting improved financial health.
It's crucial to note that a single asset-liability ratio does not encapsulate a company's entire debt situation. Alongside this metric, the revenue-to-liability ratio is equally significant. This ratio, which measures liabilities against revenue, reflects the debt level per unit of revenue, offering insights into debt under similar operating conditions.
For instance, at the end of 2024, Volkswagen Group's revenue stood at 2.5 trillion yuan, with total liabilities amounting to 3.4 trillion yuan, equivalent to 136% of its revenue. Ford's revenue was 1.3 trillion yuan, with liabilities totaling 1.7 trillion yuan, or 131% of its revenue. Toyota reported a revenue of 2.2 trillion yuan, with liabilities reaching 2.7 trillion yuan, or 123% of its revenue. Similarly, General Motors, BMW, Mercedes-Benz, and Hyundai Motor's total liabilities exceeded the trillion-yuan mark.
In contrast, domestic auto companies exhibit a relatively lower revenue-to-liability ratio, with mainstream players generally falling below 100%. For example, SAIC Motor recorded a revenue of 627.6 billion yuan and liabilities of 610.4 billion yuan, equating to 97% of its revenue. Chery's revenue was 182.2 billion yuan, with liabilities of 174.9 billion yuan (as of the third quarter), representing 96% of its revenue. Geely Holding's revenue stood at 574.8 billion yuan, with liabilities of 504.7 billion yuan, or 88% of its revenue. BYD reported a revenue of 777.1 billion yuan and liabilities of 584.7 billion yuan, amounting to 75% of its revenue.
It's important to acknowledge that, despite their rapid growth, Chinese auto companies started relatively late and have accumulated fewer fixed and intangible assets compared to international counterparts. Thus, a straightforward comparison of asset-liability ratios between Chinese and international auto companies is unfair to the former. However, when evaluated using the revenue-to-liability ratio, it becomes evident that Chinese auto companies maintain a healthier debt level.
The Debt of Chinese Auto Companies: A Healthier Perspective
Beyond the numerical value of debt ratios, the nature of debt is crucial. Corporate debt can broadly be categorized into interest-free and interest-bearing debt:
Interest-free debt comprises operational liabilities incurred in daily business operations, without interest costs, such as unpaid supplier invoices, pending employee salaries, taxes, and fees.
Interest-bearing debt, on the other hand, includes liabilities that require interest payments, typically loans from banks and other financial institutions, as well as bonds issued in the capital market. Poor business performance can plunge a company into a debt crisis due to these liabilities.
Analogizing a company to a household, a family's mortgage, car loan, and credit card debt would be interest-bearing, whereas unpaid utility bills and savings for children's expenses could be considered interest-free.
Interest-free debt is generally viewed as benign and healthy, whereas interest-bearing debt aligns more closely with the public's perception of "debt." Therefore, a company's interest-bearing debt data offers a more accurate reflection of its true debt situation.
In terms of interest-bearing debt, Chinese auto companies fare better compared to their international counterparts:
Toyota's interest-bearing debt stands at approximately 1.87 trillion yuan, constituting 68% of its total liabilities. Volkswagen Group's interest-bearing debt is about 1 trillion yuan, accounting for 32% of its total liabilities. Ford's interest-bearing debt is roughly 1.1 trillion yuan, representing 66% of its total liabilities. Similarly, General Motors, Mercedes-Benz, BMW, Stellantis, Honda, and Hyundai Motor's interest-bearing debts also reach into the hundreds of billions.
In contrast, among domestic auto companies, Geely Holding's interest-bearing debt is 86 billion yuan, making up 17% of its total liabilities. Chery's interest-bearing debt is 21.1 billion yuan, accounting for 12% of its total liabilities (as of the third quarter). Great Wall Motor's interest-bearing debt is 16.8 billion yuan, or 12% of its total liabilities. BYD's interest-bearing debt stands at approximately 28.6 billion yuan, constituting merely 5% of its total liabilities, one of the lowest among mainstream domestic and foreign auto companies.
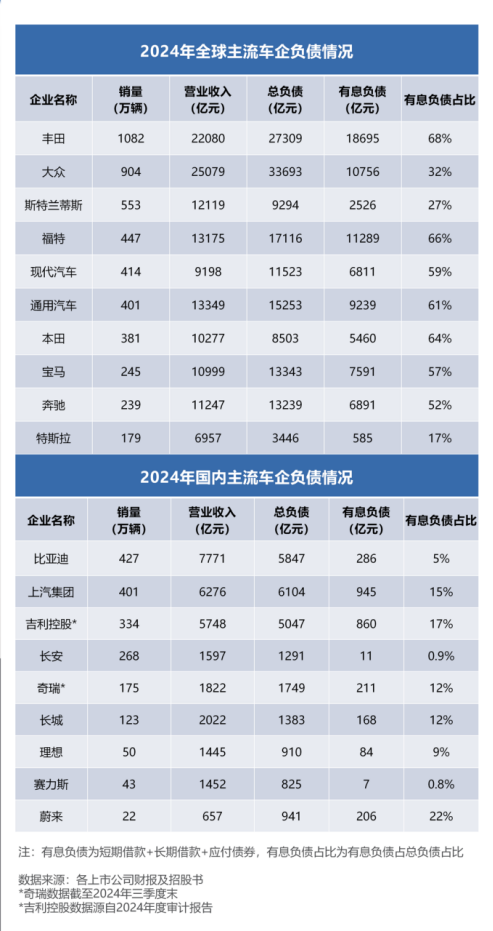
Thus, some financial experts, analysts, and self-media outlets have exaggerated Chinese auto companies' debt ratio indicators while overlooking the scale and proportion of interest-bearing debt. Consequently, their conclusions, such as certain Chinese auto companies being on the verge of "insolvency" or even "collapse," are inherently biased.
Beyond Debt: Enhancing Automotive Supply Chain Stability
Another topic related to auto companies' debt and widely criticized by outsiders is the issue of corporate account periods, particularly the reputation of some OEMs for "delaying supplier payments." BYD, for instance, frequently faces such accusations.
However, BYD's payment cycle within China's automotive industry is not unusually long. According to Wind data, in 2024, BYD's average payment cycle to upstream suppliers was 127 days, Chery's was 143 days (as of the third quarter), Great Wall Motor's was 163 days, NIO's was 195 days, and Changan's exceeded 200 days.
By analyzing financial reports, we can assess the reasonableness of a company's accounts payable scale using the "accounts payable to operating revenue" ratio. A lower ratio indicates a smaller proportion of unpaid supplier payments. The data reveals that NIO's accounts payable accounted for 52% of its operating revenue, Changan's for 49%, Great Wall Motor's for 39%, SAIC Motor's for 38%, and BYD's for 31%. Evidently, the scale of accounts payable for companies like BYD is relatively manageable, posing no significant supply chain risk.
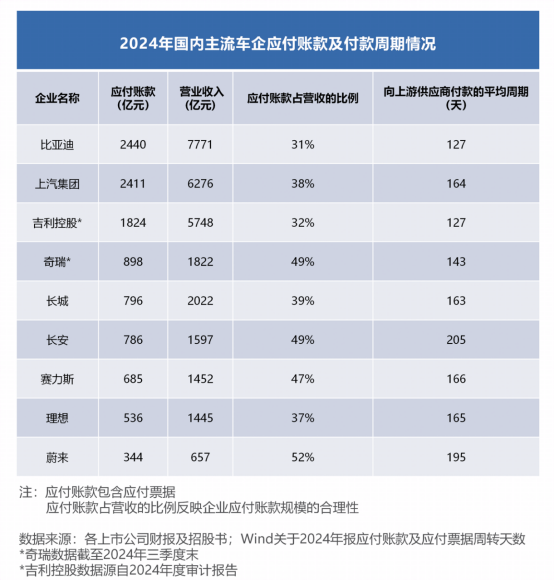
Today, both OEMs and supply chain enterprises are transitioning from "fuel" to "new energy." Both corporate debt situations and supply chain stability are gradually improving. The entire industry is moving towards maturity, stability, and health.


