Pupil Function → PSF → MTF: A Three-Tiered Numerical Framework for Optical Assessment
 09/24 2026
 347
347
Abstract: In the realms of optical engineering and AR imaging assessment, clarity cannot be solely determined by subjective perception.
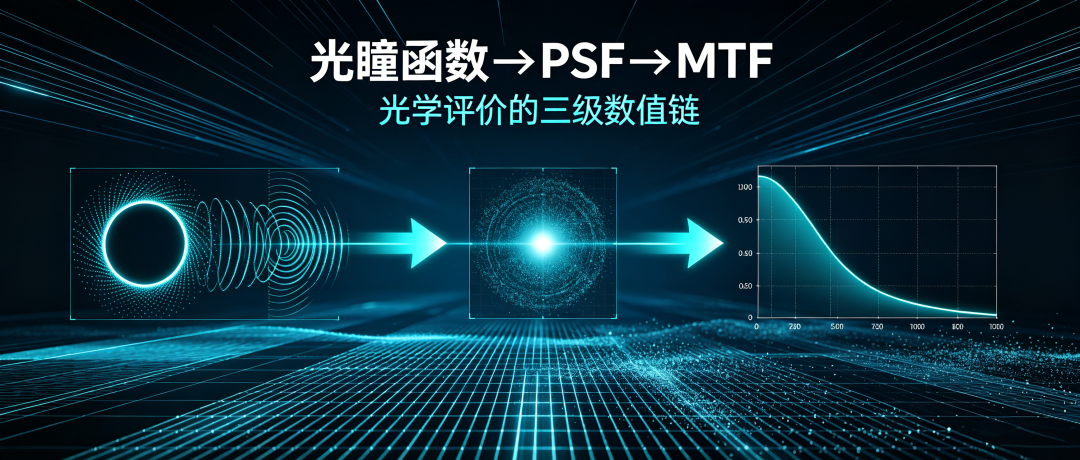
This article delves into the three-tiered numerical assessment framework of Pupil Function—PSF—MTF, elucidating their mathematical transformations, physical interpretations, and engineering applications. It establishes a foundational logic for optical simulation, measurement, and image quality evaluation, serving as a pivotal theoretical construct for comprehending AR optical imaging quality.
Core Insight: The Pupil Function embodies the 'genetic blueprint' of an optical system, PSF represents its 'phenotypic expression,' and MTF delineates its 'frequency spectrum.'
These three elements are interconnected through Fourier transforms and autocorrelation operations, forming a cohesive numerical framework—this constitutes the fundamental language employed by optical engineers to assess imaging quality. The question, 'Does this optical system produce clear images?' is among the most frequently posed inquiries in optical R&D.
However, 'clarity' is a subjective visual perception and cannot serve as a reliable basis for R&D, benchmarking, or mass production evaluation. To translate subjective perceptions into objective, quantifiable, benchmarkable, and iterative technical indicators, a standardized mathematical toolkit is essential. The Pupil Function → PSF → MTF sequence forms the core three-tiered numerical framework for optical imaging assessment, elevating the evaluation of imaging clarity in optical systems from qualitative descriptions to precise quantitative analyses.
Pupil Function—The 'Genetic Blueprint' of an Optical System
The Pupil Function denotes the complex amplitude distribution across the exit pupil plane of an optical system and is the most fundamental parameter defining its performance, encompassing two key types of information.
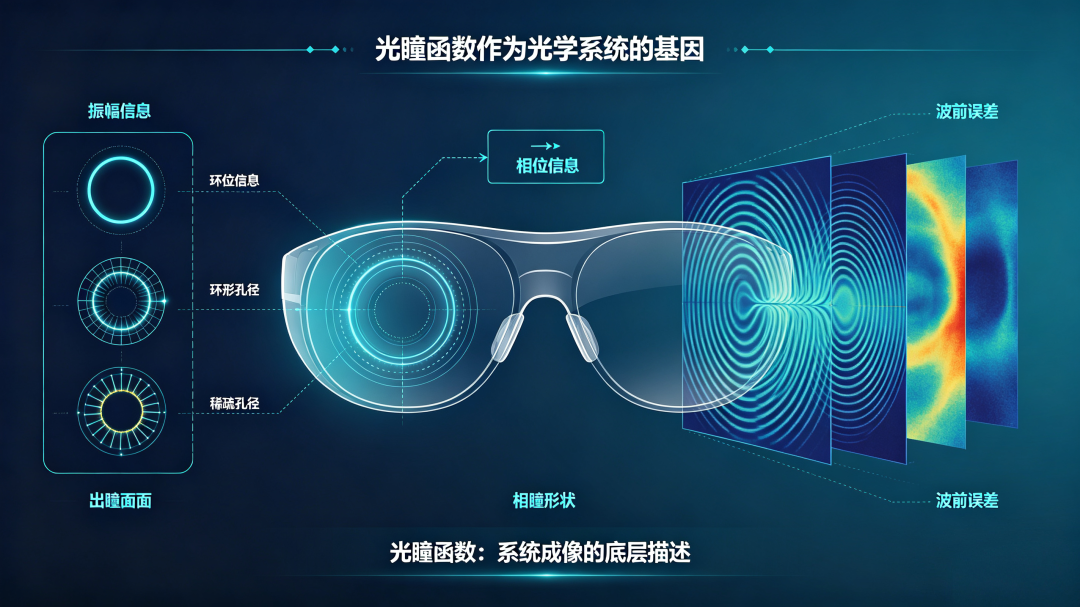
1. Amplitude Information: Encompasses the pupil's geometric configuration and light transmission efficiency, directly mirroring the system's light transmission characteristics, such as circular, annular, or sparse aperture designs, as well as optical edge vignetting.
2. Phase Information: Corresponds to the system's wavefront error, accurately reflecting core imperfections like optical aberrations and defocus levels. The Pupil Function can be viewed as the 'innate genetic makeup' of an optical system, fundamentally dictating its theoretical imaging limits. All imaging quality issues can be traced back to this foundational parameter.
PSF—The Tangible 'Phenotypic Expression' of 'Genes'
The Pupil Function is an abstract mathematical construct that cannot be directly observed or measured. In contrast, PSF (Point Spread Function) is the tangible, directly measurable physical manifestation of the Pupil Function, intuitively reflecting the imaging capability of the optical system.
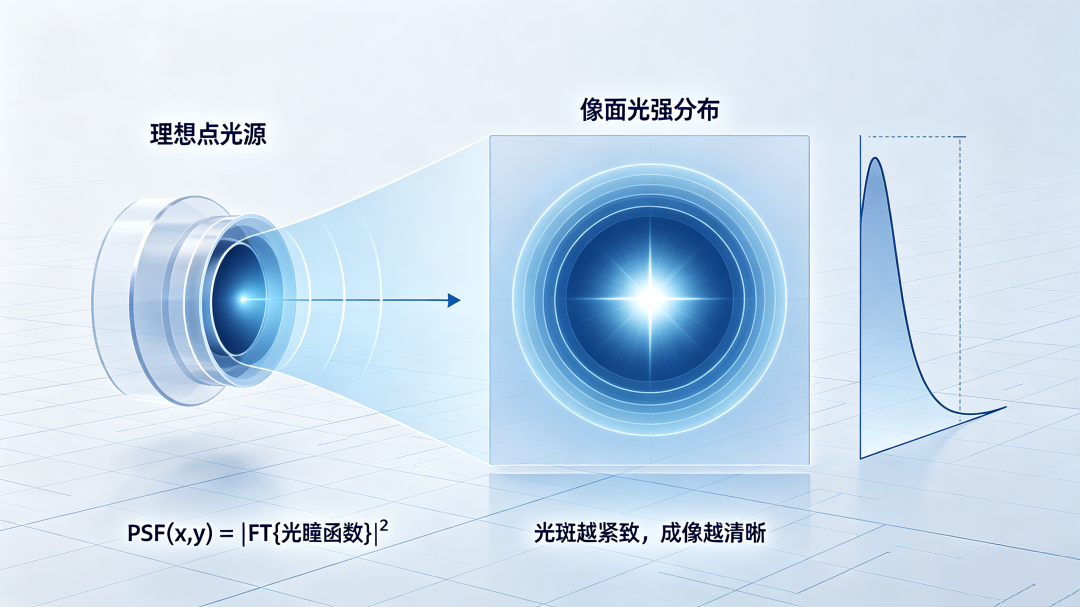
PSF describes the light intensity distribution on the image plane when an ideal, infinitesimally small point light source traverses an optical system. Mathematically, there exists a rigorous correspondence: PSF(x,y) = |FT{Pupil Function(u,v)}|, which is essentially the squared modulus of the Fourier transform of the Pupil Function.
From a physical standpoint, an ideal light point, upon passing through an optical system, will diffuse into a finite-sized Airy disk. PSF represents the precise intensity distribution of this light spot. The more compact the PSF spot and the more concentrated its energy, the higher the imaging sharpness; conversely, the more diffuse the spot and the longer the tail, the blurrier the imaging.
In AR devices, PSF directly influences the imaging quality of virtual content. Optical design flaws can lead to severe PSF trailing, ultimately resulting in blurred text edges on the screen, diminished detail clarity, and a significant decline in readability. PSF thus serves as a core intermediate metric for evaluating AR imaging quality.
MTF—Precise Image Quality Assessment from Spatial to Frequency Domains
PSF can only describe single-point blur in the spatial domain and cannot quantify the system's ability to reproduce varying levels of fine detail. MTF (Modulation Transfer Function) bridges this gap, becoming the industry's universal standard for ultimate imaging evaluation.
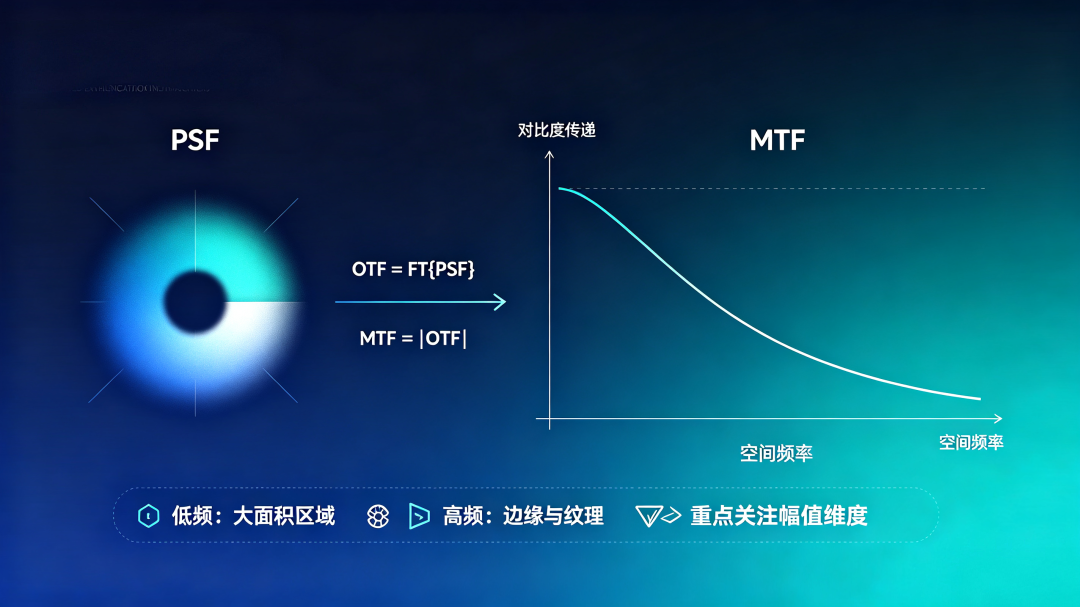
Its core physical rationale and mathematical pathway are clear: First, perform a Fourier transform on PSF to obtain OTF (Optical Transfer Function), then extract the amplitude to derive MTF, i.e., OTF = FT{PSF}, MTF = |OTF|.
OTF is a complex number encompassing both amplitude and phase information, but in engineering practice, the focus is typically on the MTF amplitude dimension, which measures the optical system's ability to preserve contrast across different spatial frequencies.
Low frequencies correspond to large color blocks, while high frequencies correspond to image edges, fine textures, and small text. The MTF curves of all optical systems exhibit a declining trend, with the most pronounced contrast degradation occurring at high frequencies.
For AR waveguide devices, three core factors—grating diffraction losses, waveguide transmission losses, and structural assembly tolerances—gradually erode the MTF curve, directly diminishing high-frequency imaging performance.
Three Calculation Pathways, Converging on a Unified Objective
From the foundational Pupil Function to the top-tier MTF metric, the industry employs three equivalent calculation pathways, each tailored to different R&D data scenarios, with theoretically identical outcomes.
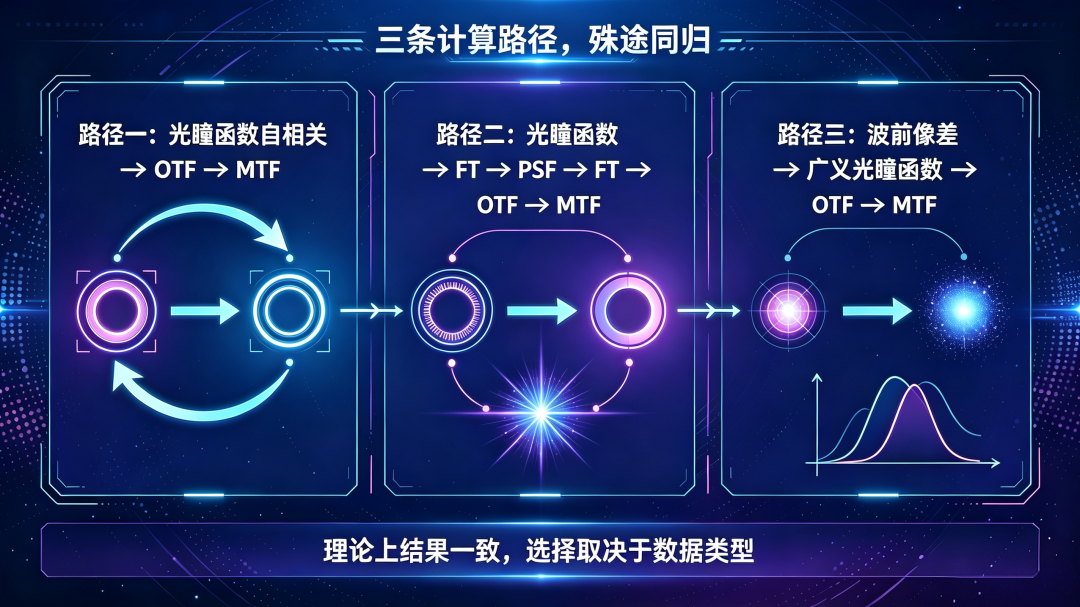
Path 1 (Frequency-Domain Direct Method): Pupil Function autocorrelation → OTF → MTF. This approach offers intuitive physical logic, directly reflecting the decisive influence of pupil shape and aperture size on imaging performance, making it suitable for simulation modeling scenarios.
Path 2 (Spatial-Domain Indirect Method): Pupil Function → Fourier Transform → PSF → Fourier Transform → OTF → MTF. This pathway aligns with measurement logic, relying on directly measurable PSF data, making it more appropriate for experimental testing scenarios.
Path 3 (Hybrid Method): Constructs a generalized Pupil Function based on system wavefront aberration data, then applies any of the aforementioned pathways for calculation.
During R&D, selections can be made based on specific needs: If Zemax simulation data is accessible, Path 1 is preferred; if physical PSF measurement data is available, Path 2 is more suitable, allowing for flexible adaptation to different R&D stages.
Conclusion: Understanding the Three-Tiered Numerical Framework is Key to Mastering Optical Clarity
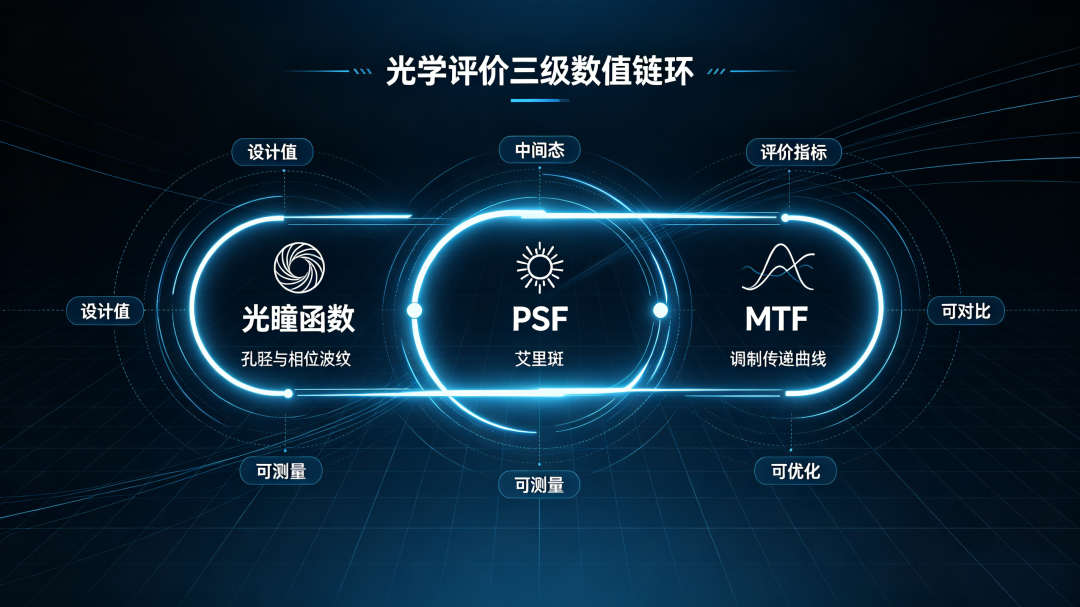
The entire optical assessment chain is logically coherent and progressively layered: The Pupil Function serves as the system's inherent design parameter and the foundational basis for imaging performance; PSF acts as the intermediate carrier of imaging effects, bridging theory and measurement; MTF represents the standardized quantitative evaluation metric and the core basis for mass production benchmarking and performance iteration.
This comprehensive numerical framework transforms abstract optical design parameters into measurable, comparable, and optimizable quantitative data.
Only by comprehending it can one truly grasp the core essence of 'imaging clarity' in optical engineering.
Interactive Topic: When evaluating AR optical systems, do you prefer to directly analyze MTF curves or assess imaging quality based on PSF morphology? Feel free to leave a comment sharing your work habits.
— AR Andy | Focused on waveguide and AR microdisplay technologies, deeply dissecting the underlying logic of the optical industry.
Note: This article is intended for industry optical science popularization. The mathematical models and evaluation logic are based on general optical engineering theory and are meant solely for technical learning and exchange, not as a basis for product R&D or mass production calibration.
-
China’s PC Market Defies Downturn: Huawei Surges 82%, Apple Up 63%
-
![]()
Pupil Function → PSF → MTF: A Three-Tiered Numerical Framework for Optical Assessment
-
![]()
GW is Becoming the Unit of Measurement for Cloud Providers
-
![]()
Doubao Enters Smartphone Arena, Qianwen Ventures into Tablets
-
![]()
After 40 Years of Competition, It's Time to Clear the Field in China's Auto Market
-
![]()
Manus Valued at $27 Billion: Revenue Surges 4x, Marketing Outshines Technology
-
![]()
【Electric Equipment】Weichai Foton Signs Agreement Again
-
![]()
Wan Gang and Zhu Huarong: How to Transform, Upgrade, and Achieve Resilient Growth Amid Declining Sales