
How to Calculate MTF from a Slanted Edge? A Three-Step Derivation from ESF to the Curve
 09/28 2026
 457
457

Abstract: MTF is not a theoretical construct derived from simulations; rather, it is a concrete, measured performance metric for optical systems.
The Slanted Edge Method, an industry-standard approach, adheres to the ISO 12233 international standard. It employs a clear and comprehensive measurement rationale: capture an image of a slanted edge, derive the Line Spread Function (LSF) by differentiating the Edge Spread Function (ESF), and subsequently generate the MTF curve through a Fourier transform. This method is currently the most widely accepted and authoritative scheme for MTF evaluation in the mass production testing of AR waveguide modules.
The MTF curve stands as a pivotal parameter in the specifications of AR optical modules. However, the origins of this crucial curve remain obscure to many.
Contrary to popular belief, the MTF curve is not a theoretical output simulated by software; instead, it is measured data meticulously derived from captured images using standard algorithms.
This industry-standard measurement approach, known as the Slanted Edge Method, strictly conforms to the ISO 12233 international standard. Transforming an ordinary captured image of a slanted edge into a complete MTF curve necessitates only three fundamental operations: ESF extraction, LSF differentiation, and Fourier transformation.
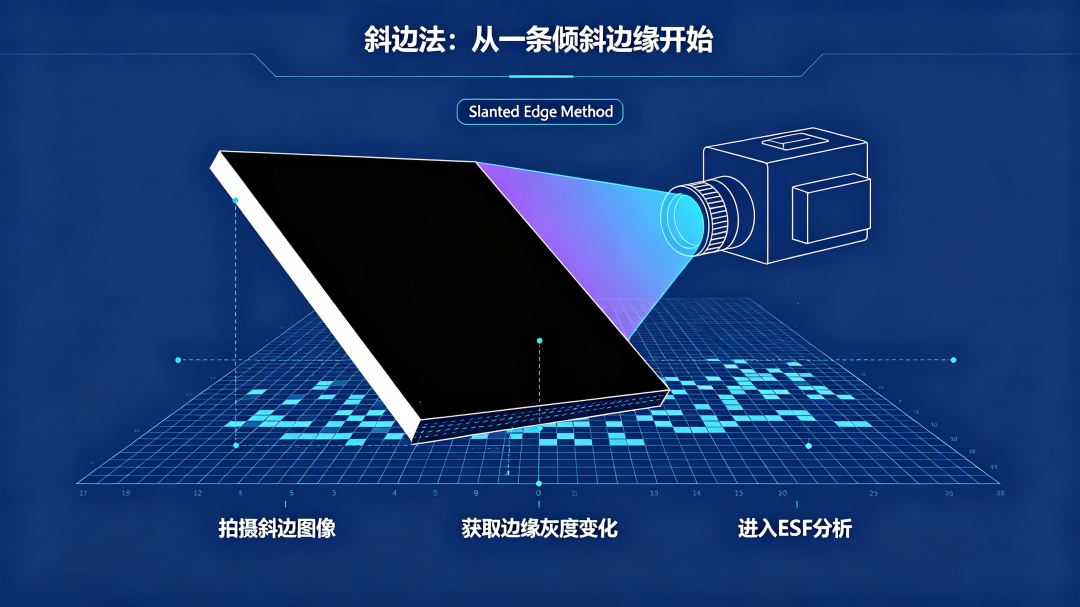
1. ESF—Ideal Edges Are Never "Sharp Cuts" in Reality
Consider placing an ideal slanted edge target, characterized by an absolutely clear black-and-white boundary, in front of an optical system and capturing its image using a device.
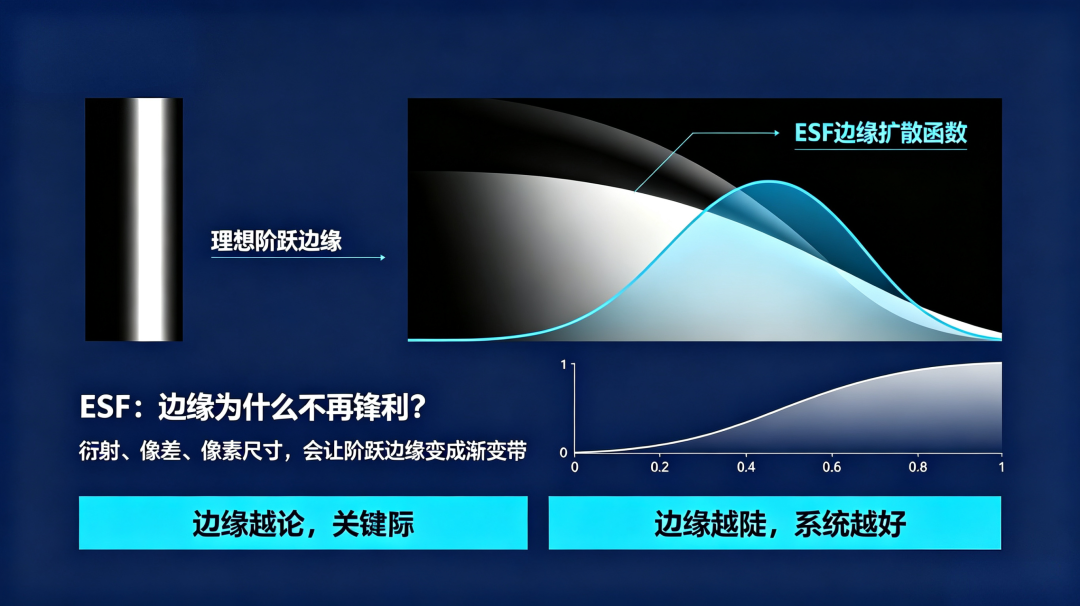
Theoretically, in a flawless optical system, the image edge would mirror the actual object, exhibiting an instantaneous transition between black and white areas with a distinct boundary. However, in real-world imaging scenarios, factors such as optical diffraction, lens aberrations, and sensor pixel size preclude abrupt switching at the image edge, resulting in a smooth, gradual transition zone of light and dark.
The grayscale intensity distribution pattern within this transition zone is termed the Edge Spread Function (ESF).
The essence of ESF lies in its ability to visually depict the imaging distortion state of an ideal step edge after traversing the optical system. A steeper edge transition signifies superior imaging fidelity of the optical system, whereas a more gradual and blurred edge indicates poorer imaging performance.
2. LSF—Differentiate ESF to Obtain the Core Imaging Response
While ESF provides an intuitive assessment of imaging blur, it cannot directly yield an MTF curve and necessitates further computational processing.
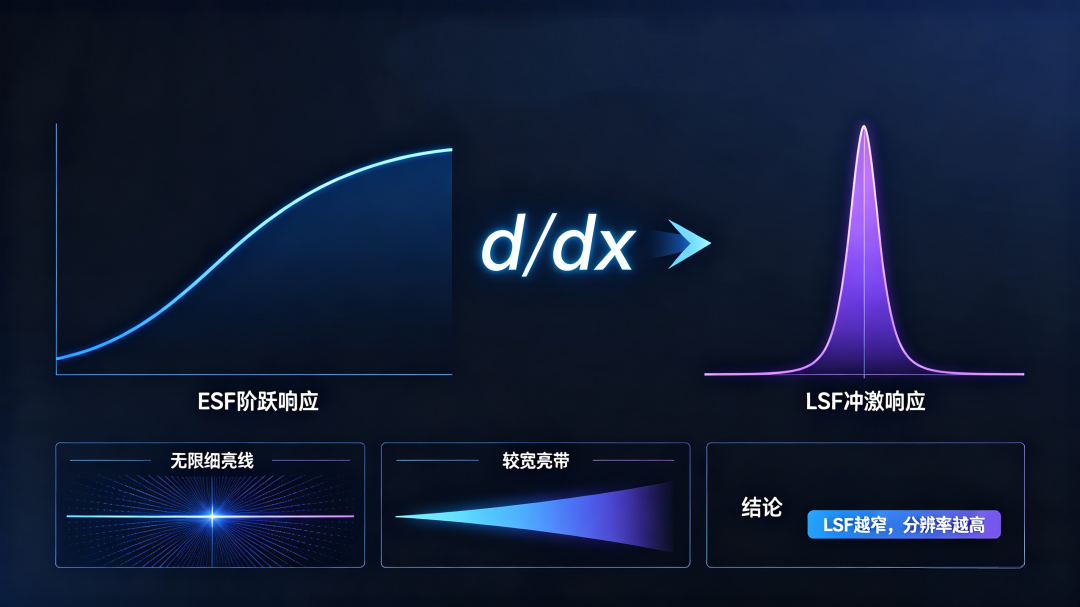
Differentiating the ESF curve produces the Line Spread Function (LSF). The underlying mathematical rationale is straightforward: ESF corresponds to the step response of the optical system, representing the imaging state of the entire edge; LSF, on the other hand, corresponds to the impulse response of the optical system, representing the imaging state of a single thin line light source.
In mathematical terms, the derivative of a step function is precisely an impulse function, which forms the basis for obtaining LSF through ESF differentiation.
LSF characterizes the extent to which an infinitely thin bright line will spread into a bright band after passing through the optical system.
A narrower LSF waveform with a more concentrated peak indicates higher system resolution, whereas a wider waveform with severe dispersion suggests increased imaging blur.
3. MTF—Fourier Transform of LSF Unlocks Imaging Contrast Limits
After acquiring an accurate LSF curve, the final step involves performing a Fourier transform, which is also the pivotal step in generating the MTF curve.
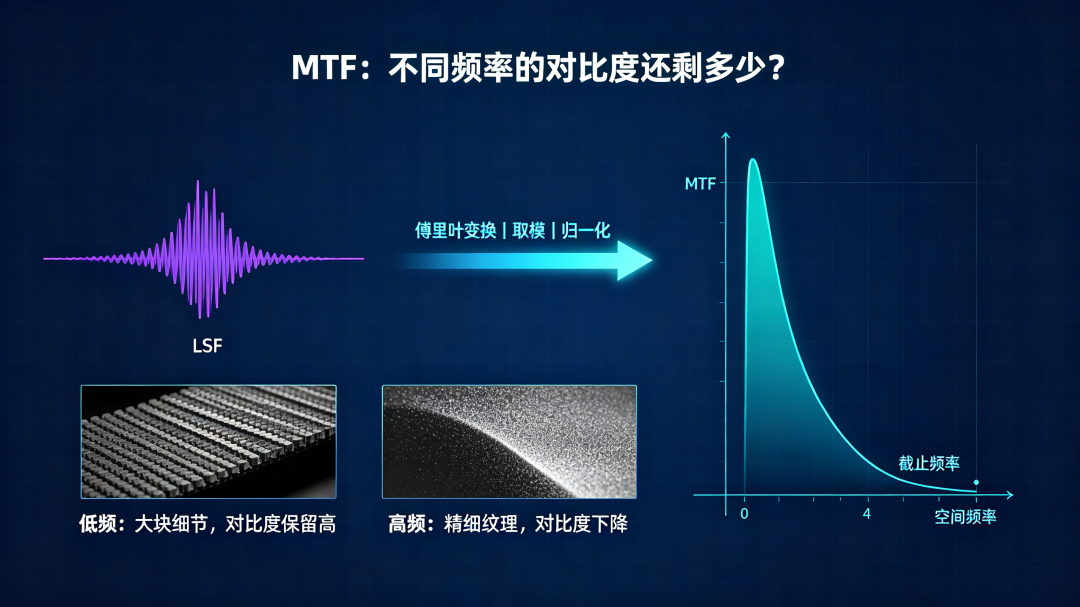
Subjecting the LSF to a Fourier transform, extracting the modulus, and completing normalization processing ultimately yields the standard Modulation Transfer Function (MTF) curve.
The core value of MTF lies in its ability to quantify the imaging contrast retention capability for details at varying spatial frequencies.
Low frequencies correspond to expansive areas in the image, with minimal contrast loss and MTF values approaching 1; high frequencies correspond to fine textures in the image, with increasing contrast loss and gradually declining MTF values.
The critical frequency point at which the MTF curve decays from 1 to 0 represents the imaging cutoff frequency of the optical system, directly determining the device's ultimate resolving power.
In essence: ESF → Differentiation → LSF → Fourier Transform → MTF constitutes the complete closed-loop mathematical logic of the Slanted Edge Method for measuring MTF.
4. Key Question: Why Must the Edge Be "Slanted" in the Slanted Edge Method?
Many individuals are curious about the core requirement of the Slanted Edge Method: the imaging edge cannot be purely vertical or horizontal but must be slanted at a specific angle, with the industry-standard being approximately 5°.
The underlying reason lies in the discrete arrangement of sensor pixels. Utilizing vertical or horizontal edges would result in sampling points consistently falling on the same column or row of pixels, leading to severely insufficient sampling density and ultimately significant errors in the measured MTF data.
A slanted edge traverses different phases across various pixel rows and columns, integrating multiple discrete sampling data points to achieve pixel-level supersampling and equivalently enhance sampling accuracy. An angle that is excessively large or small would disrupt sampling uniformity. Around 5° is the optimal balanced angle certified by the ISO 12233 standard, striking a balance between sampling density and data uniformity.
5. Practical Application: Slanted Edge Method in AR Waveguide Mass Production
Measurement Logic In the mass production testing of AR waveguide modules, the Slanted Edge Method serves as a standard testing scheme.
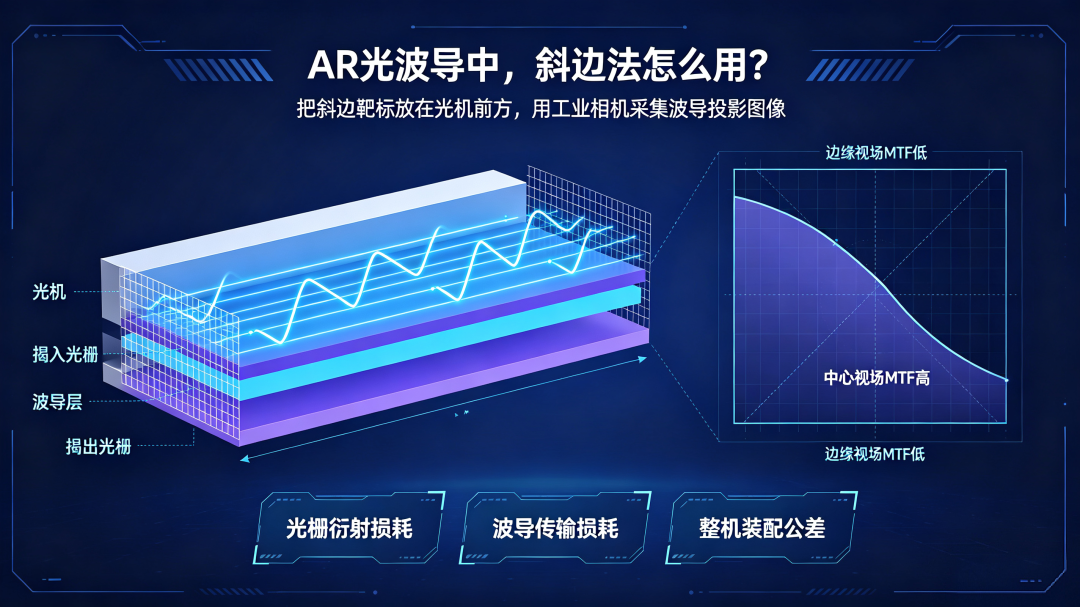
The conventional measurement process is highly standardized: position a standard slanted edge target in front of the optical engine, project a complete slanted edge image through the waveguide, and then employ a high-precision industrial camera to capture the image and analyze the data using algorithms.
Influenced by the core characteristics of waveguides, the diffraction efficiency of the coupling grating varies for light rays with different angles and polarization states, ultimately resulting in differential MTF performance across the field of view: high MTF values and clear imaging in the central field of view, with significant attenuation of MTF values in the peripheral field of view.
This perfectly corroborates the three-tier attenuation logic of waveguide imaging: grating diffraction loss, waveguide transmission loss, and overall assembly tolerance, all of which are directly reflected in the MTF measurement data.
The Slanted Edge Method is capable of measuring more than just a single value; it can fully reconstruct the spatial distribution differences of MTF.
Conclusion
A seemingly simple slanted edge conceals the core logic of AR optical imaging. From ESF edge spread, LSF linear differentiation, to Fourier transformation generating the MTF curve, three standard operations construct a comprehensive imaging evaluation system.
Grasping this derivation logic is the key to truly comprehending MTF: it is not a parameter arbitrarily assigned by manufacturers but a measured imaging indicator with standards, traceability, and reproducibility.
Subsequently, when encountering various AR waveguide MTF parameters, you can clearly discern the measurement principles and data logic underlying them.
Interactive Topic: Have you utilized the Slanted Edge Method to measure MTF in your work? Have you encountered issues with inaccurate edge extraction or uneven supersampling? Feel free to share your experiences in the comments.
[Industry Risk Note] The content of this article is solely intended for the popularization of industry principles and standardized measurement methods. The technical principles and measurement logic presented are based on the ISO 12233 general industry standard and do not constitute any endorsement of manufacturers' technologies, mass production, or investments. Specific device performance and test data should refer to official enterprise measurement reports.
— AR Andy | Focusing on the waveguide and AR microdisplay sectors, deeply dissecting the underlying logic of the optical industry
-
![]()
Honor Magic9 Pro Max Review: Imaging Gets More Exciting, Agent System Impresses
-
What questions does the Third Pioneering Venture of Volkswagen in China Need to Answer with ID. UNIQ 09?
-
Why is Geely introducing Zhichong now, and what stage has Geely's new energy strategy reached?
-
![]()
Fuel Vehicle Sales Slump and New Energy Gaps Present Limited Growth Avenues for Joint Ventures
-
![]()
How to Calculate MTF from a Slanted Edge? A Three-Step Derivation from ESF to the Curve
-
![]()
The Other Side of the 'First Year of Mass Production' of Optical Waveguides: Has Capacity Been Built Up and Yield Kept Up?
-
![]()
Huawei Set to Unveil '10x Zoom Module Camera'! Patent Visuals Unveiled: Boasts Built-in CMOS
-
![]()
Silicon Carbide Optical Waveguides: From 'Performance Option' to 'Mass Production Element'