Oracle Plummets? The Irreparable Flaws Beyond AI Infrastructure - 'High Interest, High Debt + Stagnant Software'
 06/12 2026
 557
557
Oracle, the most closely watched and controversial player in the new cloud landscape, released its Q4 FY26 results (ending May) after the market closed on June 11. Overall, the results were a mixed bag. For example, while OCI business accelerated growth, traditional pan-software business growth weakened. Another example is that while gross margins bottomed out and improved sequentially, they still fell significantly short of expectations. Although the guidance for the next quarter was better than expected, the guidance for the full FY27 was relatively conservative. Therefore, the overall performance for the quarter was relatively lackluster, with specifics as follows:
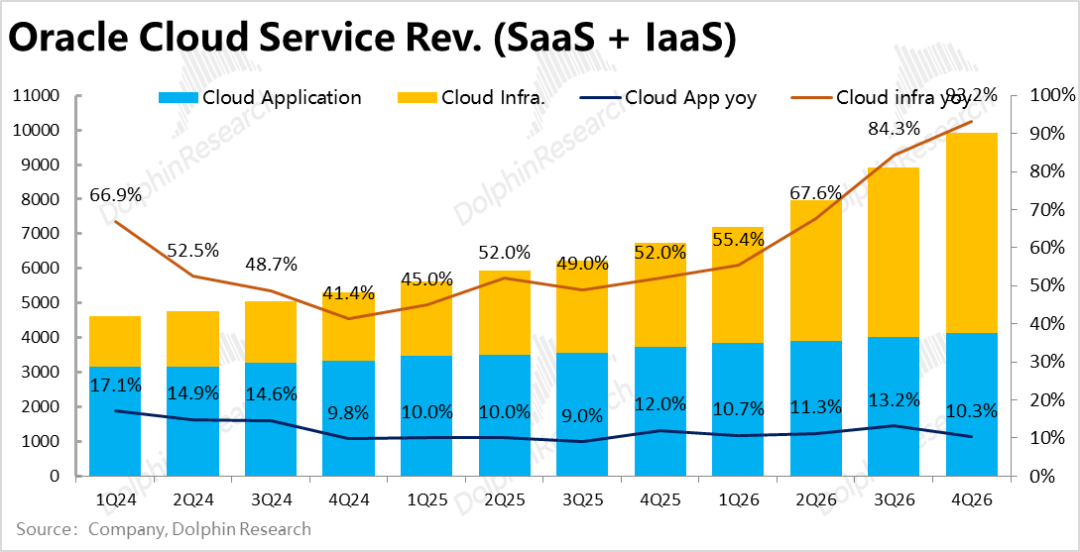
1. Core Business - OCI Accelerates Growth as Expected: Under the cloud segment, IaaS-type OCI business revenue reached nearly $5.8 billion this quarter, up about 93% year-over-year. After excluding the positive impact of exchange rates, the actual growth rate was 92%, continuing to accelerate as expected from the previous quarter's 81%, but the acceleration pace slowed slightly. Moreover, the actual growth rate was basically in line with expectations, offering no pleasant surprises.
In other words, although the absolute growth rate is strong, from a relative perspective, the performance of the most critical OCI business this quarter cannot be considered 'good.'
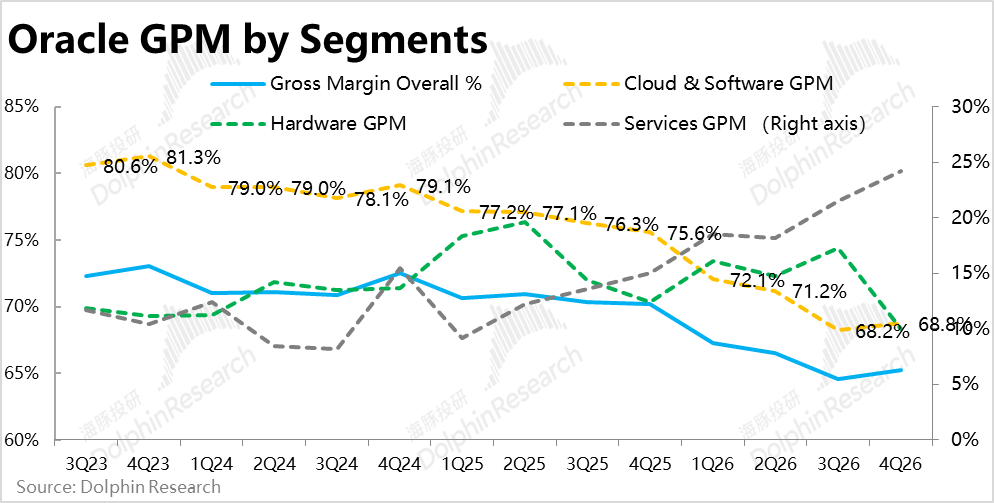
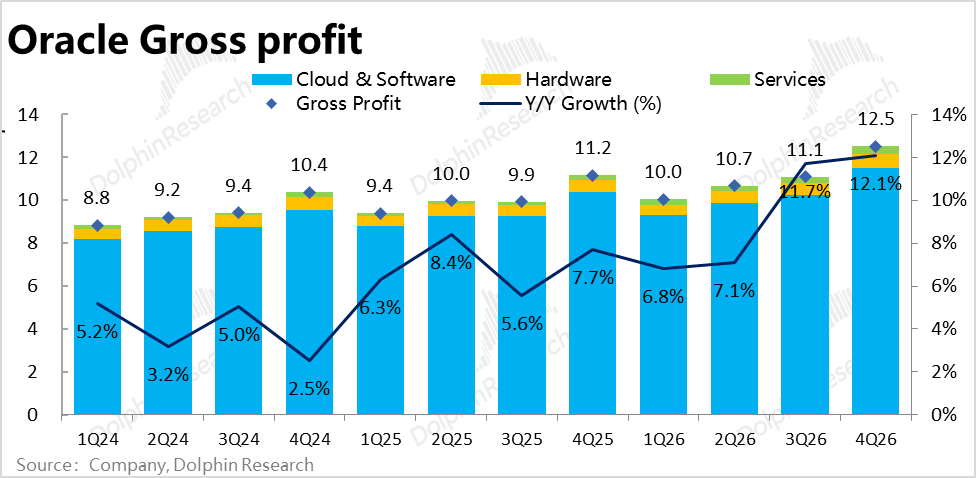
2. Gross Margin Bottoms Out Sequentially but Still Falls Short of Expectations: The combined gross margin for cloud + software businesses this quarter was 68.8%, showing signs of bottoming out and rebounding from the previous quarter's 68.2%. Although the year-over-year decline was still 6.8 percentage points, it narrowed from the previous quarter.
However, since this includes multiple businesses such as OCI, SaaS, and traditional software, it is not possible to directly determine whether the improvement was due to OCI's gross margin stabilizing or an increase in the gross margin of pan-software businesses.
From an expectations perspective, the market expected an overall gross margin of over 66%, but the actual figure was 65.2%, still falling short of expectations. Therefore, overall gross profit performance this quarter was slightly negative.
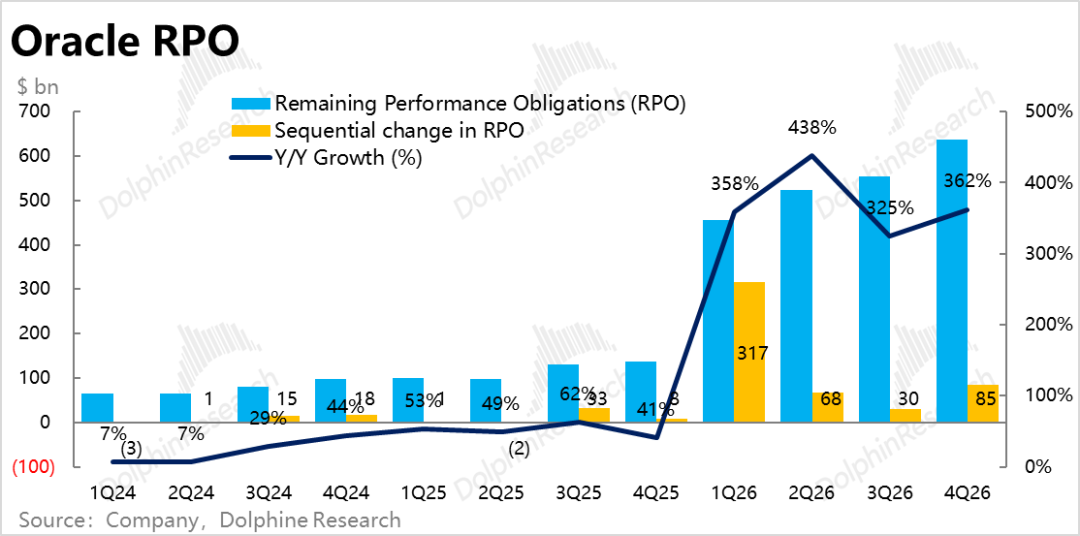
3. RPO New Orders Exceed Expectations, Capex Sharing Model Implemented: The remaining performance obligation (RPO), reflecting new order demand, actually increased by $85 billion sequentially, bringing the total RPO to $638 billion. Since there were no rumors or reports of the company signing major new contracts before the results, market expectations were not high, around $590 billion. Combined with recent news reports, this increase may stem from newly announced government contracts.
Additionally, it is noteworthy that the company stated that approximately $75 billion in orders are currently based on the Capex sharing model—where the Capex requirements corresponding to the orders are partially covered by customer prepayments or self-procured hardware. This is good news for the company's cash flow and balance sheet structure.
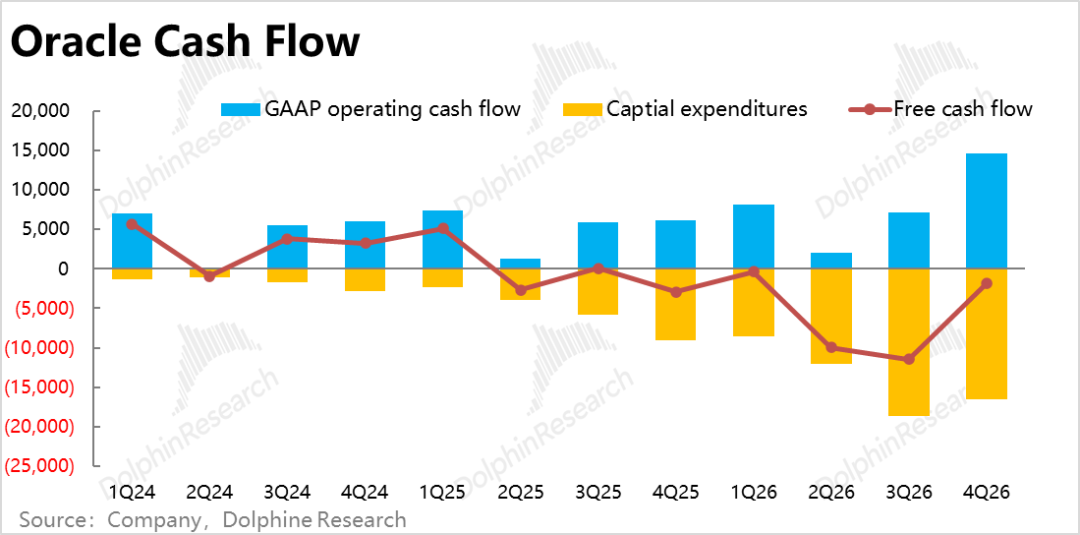
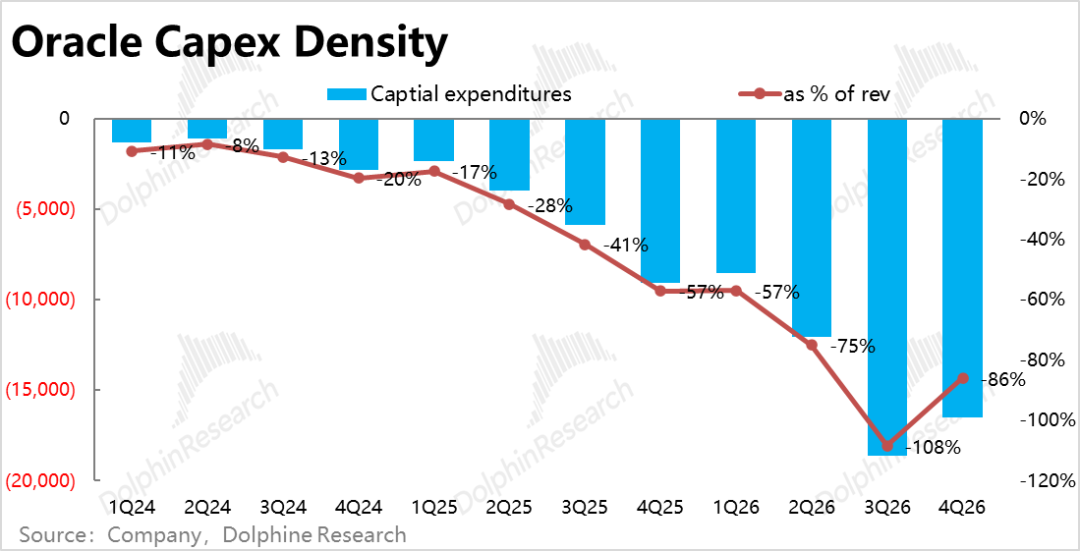
4. Capex Higher Than Expected but Cash Flow Improves Significantly: Correspondingly, Capex this quarter was nearly $16.5 billion, down from $18.6 billion in the previous quarter. The market's expectation of $11 billion was mechanically derived from the full-year Capex guidance of $50 billion, appearing significantly higher than expected, but its reference value is limited.
More noteworthy is that the sharing model covered approximately $4.6 billion in Capex expenditures this quarter. As a result, the company's free cash flow improved from an outflow of $10 billion per quarter previously to a net outflow of $1.9 billion this quarter, indeed alleviating cash flow pressure.
5. Reduced Financing Needs?: The company stated that for FY27, it will conduct $20 billion in debt and $20 billion in equity financing (both previously disclosed), totaling $40 billion, less than the approximately $48 billion in financing for the current fiscal year. This locks in funding sources for most Capex investments in the next fiscal year.
Moreover, Dolphin Research and the market generally expected a free cash flow gap of over $50 billion in 2027. We believe this is likely because some funding needs are shared with customers, thus reducing the company's own financing needs.
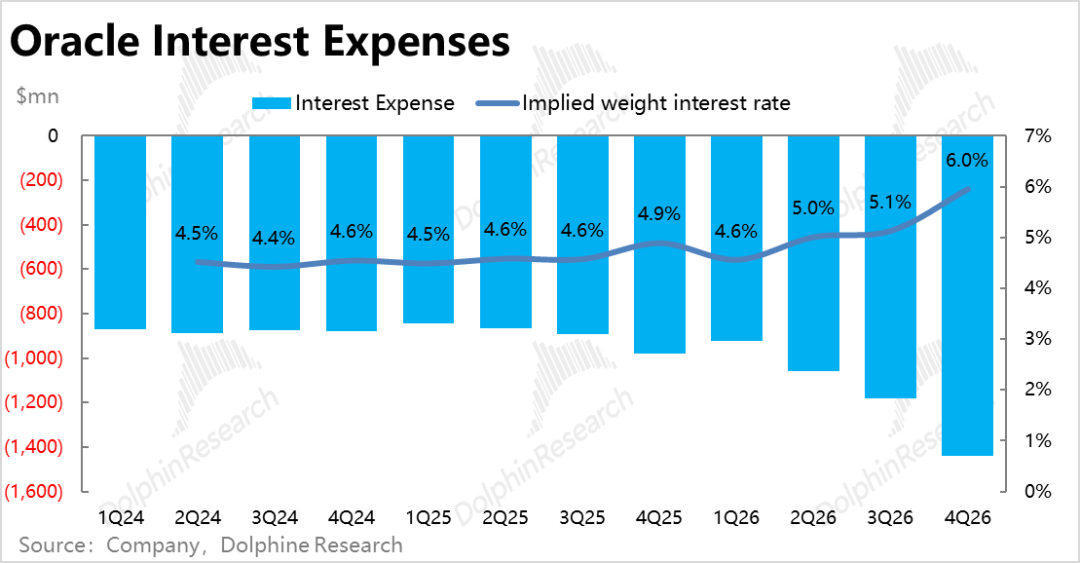
However, long-term logic remains favorable, but current pressures are still high. Actual interest expenses this quarter reached $1.44 billion, up nearly 22% sequentially. The proportion of interest expenses to total revenue also increased to 6%.
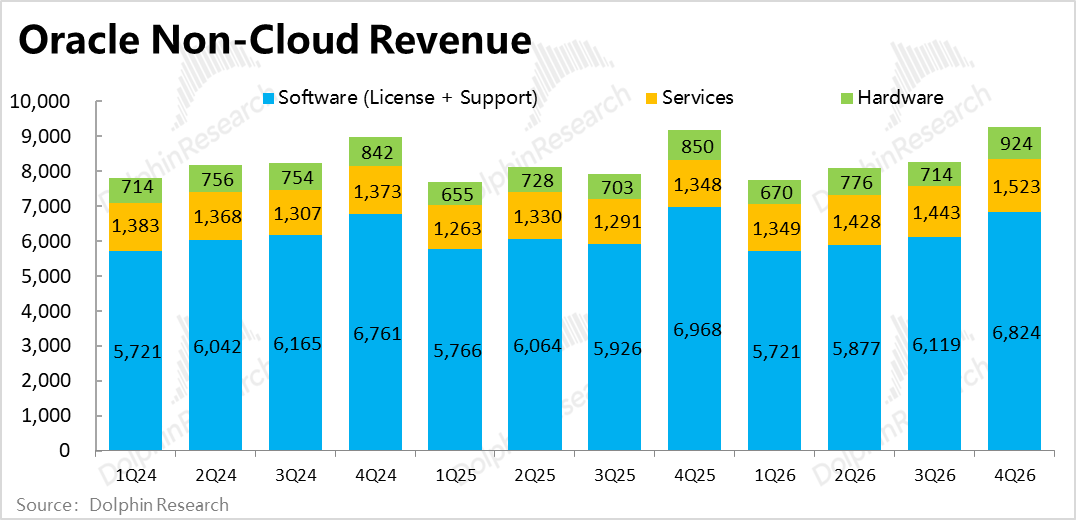
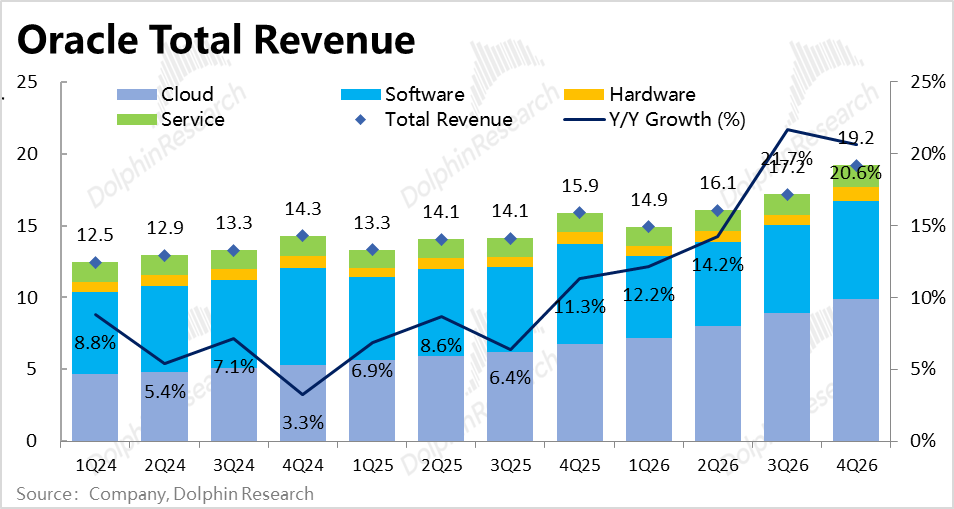
6. Other Businesses Further Weaken: The performance of traditional segments, still accounting for about 75% of total revenue, is deteriorating. SaaS and software business revenues grew by +10% and -2%, respectively, with growth rates slowing sequentially and both falling short of market expectations. Although hardware and service revenue growth was significantly better than expected, these two businesses combined account for just over 10% of total revenue, limiting their impact.
7. Overall Performance
The company's overall revenue grew by 20.6% this quarter. After excluding the impact of exchange rates, the actual growth rate was 20%, accelerating slightly by 2 percentage points from the previous quarter.
Due to the significant year-over-year decline in gross margins mentioned earlier, the year-over-year growth rate in total gross profit was 12%, still significantly lower than revenue growth and slightly below market expectations.
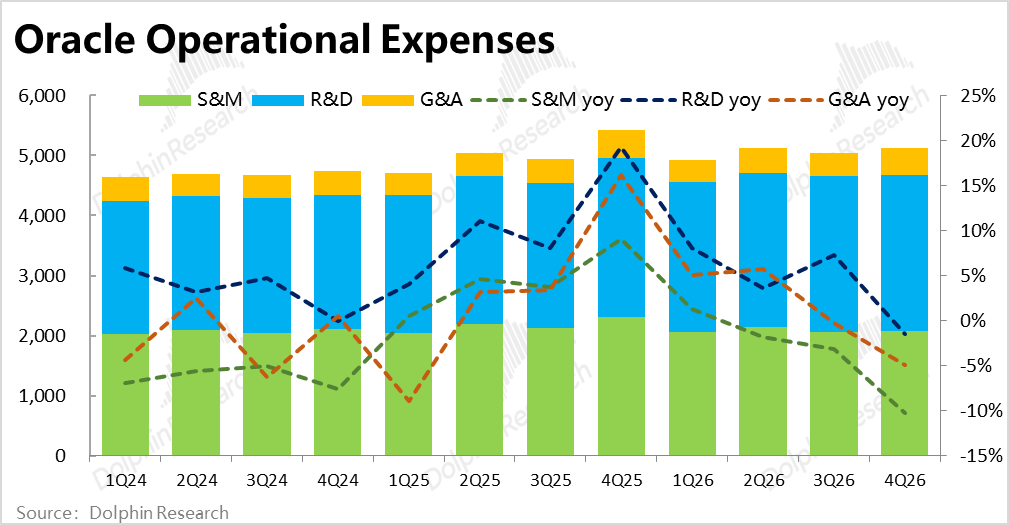
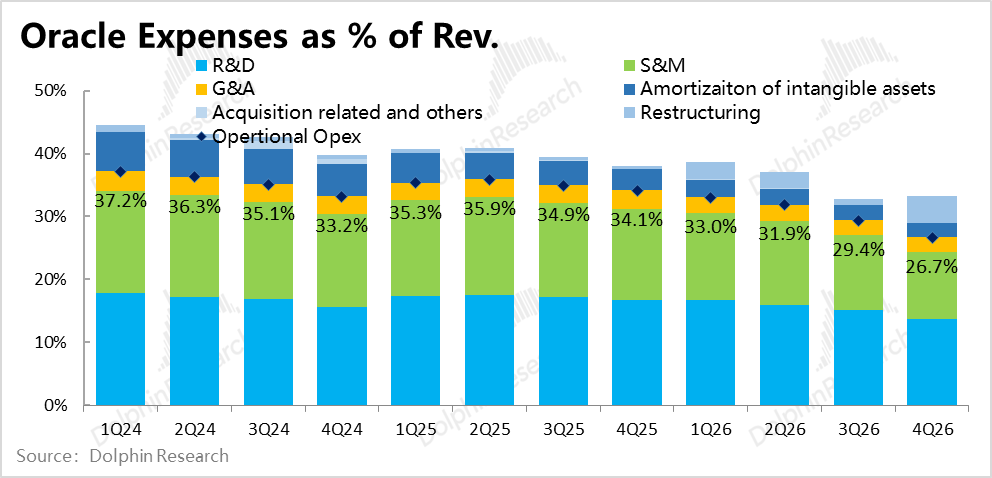
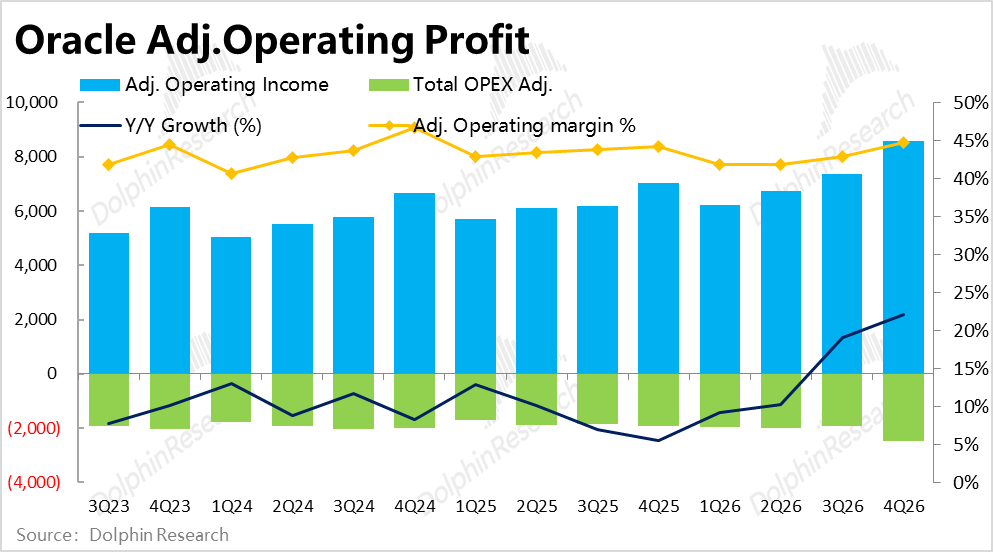
Fortunately, excluding one-time expenses from layoffs and focusing on the three regular operating expenses, actual expenses decreased by about 5.6% year-over-year this quarter, 7 percentage points lower than market expectations. Under strict cost control, although gross margins declined significantly, the adjusted operating profit margin stopped declining year-over-year and returned to positive growth of about 0.5 percentage points, better than market expectations.
Ultimately, adjusted operating profit reached $8.6 billion, up about 22% year-over-year. Despite gross profit falling short of expectations and revenue, profit growth outpaced both revenue and expectations.

Dolphin Research's Viewpoints:
1. Currently, the market's focus on Oracle's short- to medium-term performance mainly includes: a. The speed and acceleration of OCI revenue growth, which reflects the smooth progress and pace of computing power construction. In comparison, there is less recent focus on newly signed orders (i.e., RPO). b. Whether the issue of lower profit margins despite higher AI business revenue has changed. c. The pace of Capex investment and ramp-up, as well as the acquisition of corresponding financing.
However, attitudes have shifted from previously negative (disliking high Capex, worrying about ROI) to more positive (high Capex indicates fast progress in computing power construction).
In response to the above concerns, the performance in this earnings report is as follows:
a. OCI business did accelerate growth as expected, but the acceleration pace was fully in line with expectations, so it was not outstanding. At the same time, while OCI benefits from AI, the larger proportion of traditional pan-software businesses are logically 'victims' of AI. Therefore, Oracle cannot be considered a pure 'AI beneficiary stock.'
b. Gross margins did show signs of bottoming out, but on the one hand, it is temporarily impossible to accurately attribute the cause, and on the other hand, they still fell short of market expectations. More quarters of observation are needed to determine whether the bottoming out of gross margins is temporary or a true inflection point.
Since Amazon and Google's cloud business profit margins did not significantly decline in recent quarters, the widely accepted 'underlying assumption' in the market—that AI cloud business profit margins will be significantly lower than traditional cloud businesses—is now open to question. However, for NeoCloud players like Oracle, the situation where a higher proportion of AI business leads to lower profit margins is more pronounced. This earnings report from Oracle makes this issue even more worthy of discussion.
c. The most positive signal this quarter is actually the company's adoption of a Capex sharing model with customers, which, from a long-term logical perspective, significantly reduces the pressure and risks the company would otherwise face in bearing massive Capex investments and computing power construction for downstream AI customers using its own cash flow and balance sheet.
Dolphin Research believes this is a significant logical shift. However, in the short to medium term, the company's net debt and interest expenses will likely continue to rise, so it is necessary to monitor how much of the Capex can be shared with customers in the future.
2. From an investment logic perspective, as we mentioned in our last review, after successfully completing $50 billion in equity + debt financing, concerns about whether the company could obtain funds to continue large-scale computing power construction have eased. Additionally, with the explosive growth of Tokens/computing power consumption driven by Agents, market concerns about potential overbuilding of computing power or insufficient end-user demand have also significantly decreased.
With the improvement of these two issues, Oracle's investment logic has undergone a certain reversal. The company's stock price has rebounded by over 40% from its low in early April, while recent macro risks and market volatility have risen again. Therefore, before the earnings report, investment banks generally believed that the market's requirements for performance would be relatively high this time.
Therefore, the truly mixed performance in this report will indeed disappoint funds with relatively high expectations.
In terms of guidance, the company expects cloud segment (including IaaS and SaaS combined) growth to be 60% in the middle of the range next quarter, continuing to accelerate sequentially and slightly exceeding market expectations of 57%. The guidance for next quarter's Non-GAAP EPS is a median of $1.74, implying year-over-year growth of 18%, also slightly exceeding market expectations by about 3%.
However, while the guidance for the next quarter is good, the company's guidance for the full FY27 maintains revenue at $90 billion, unchanged, and the newly updated full-year Non-GAAP EPS is $8.05, which is only in line with current market expectations. The full-year guidance is flat, so the market cannot overly 'reward' the good guidance for the next quarter.
In response, Dolphin Research speculates that this is likely because the company itself does not yet have a clear outlook for the full year's performance, so it is providing guidance in line with market expectations for now.
In recent developments, after the last earnings report, Oracle has been relatively 'low-key,' with no particularly significant new moves/news announced. However, there are still two noteworthy trends:
a. Introducing AI into software businesses: Recently, the company has not made many moves in its IaaS business but has consecutively introduced AI capabilities into its SaaS and database businesses, launching Fusion Agent Application and Agentic AI for Database, respectively.
Dolphin Research believes this is a typical defensive move. After all, as of FY26, the revenue from OCI, which directly benefits from AI, accounts for only about 25% of the company's total. The remaining larger portion comes from software, SaaS, and databases, which are seen as potential 'victims' that could be replaced by AI. However, judging from the example of peer company Salesforce, introducing AI capabilities into traditional businesses does not seem to have a significantly positive impact. Whether it can help traditional businesses maintain current growth or even accelerate again requires careful observation.
b. Promoting government cooperation: In late March and early May, Oracle consecutively announced contracts with U.S. federal agencies and the Department of War, providing various services including OCI, AI Database, and Enterprise AI. Before the earnings report, the market generally believed that compared to enterprise orders, which can reach hundreds of billions in scale, the actual impact of government cooperation on performance might be limited. However, it now appears that government orders may also contribute tens of billions in actual order value. Moreover, the significance of government orders may not lie in their actual performance contribution but in reflecting government support for the company, which would also be positive for market sentiment.
3. From a valuation analysis perspective, it can be viewed from two angles: one is the short- to medium-term valuation that fluctuates with the company's quarterly performance; the other is the valuation based on the company's long-term prospects or steady-state conditions, which does not change significantly with short-term performance unless there are major logical changes or adjustments to long-term guidance.
From a short- to medium-term perspective, the market generally prices the company directly based on its Non-GAAP EPS for FY27. In other words, the company can already be supported by its near-term visible performance, and even without an upward revision in valuation, there is room for returns driven by potential upward revisions in performance/profits.
However, Dolphin Research itself prefers to measure based on the steady-state conditions from a long-term perspective. After a significant rebound from the bottom, the current valuation relatively neutrally reflects the company's guided mid- to long-term performance space. Therefore, it is reasonable for the stock price to decline somewhat after not-so-good earnings.
Of course, the implied multiple of this valuation is still not high, and the reduction in the company's own cash flow needs and financing debt pressure conveyed this time may fundamentally improve the company's logical narrative. Assuming no systemic issues emerge with AI, Dolphin Research believes that while Oracle may not be a high-certainty top pick at present, it is worth paying attention to.
Below is a detailed review
I. Oracle's Business & Revenue Classification Introduction
As a software industry 'veteran' established in the 1980s, Oracle's historical core businesses have mainly been databases and software services (traditional license model). However, in recent years, with the company's cloud transformation efforts and the explosion of AI, cloud services have surpassed to become the most important and closely watched segment.
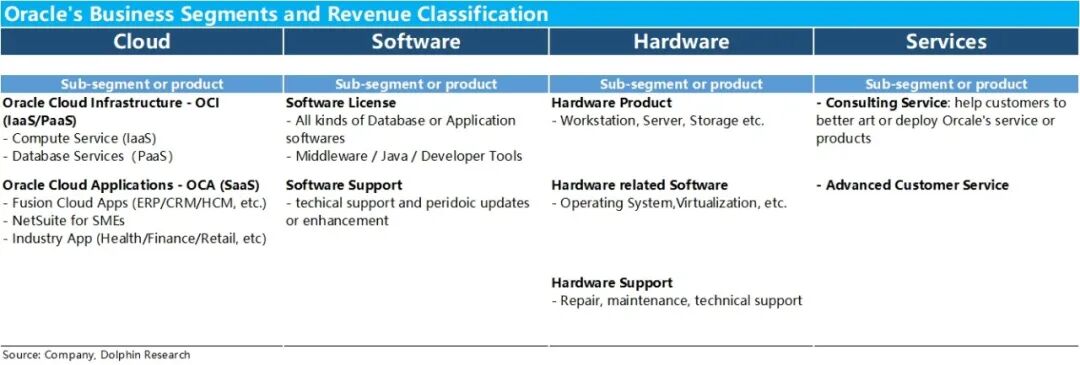
In FY26, the company just adjusted its financial reporting disclosure categories, dividing its business and revenue more clearly into four segments: Cloud, Software, Hardware, and Services. Further details are as follows:
a. Cloud Business: Can be subdivided into two business lines: IaaS-type OCI and SaaS-type OCA. OCA mainly includes SaaS-based ERP/CRM/ERP and other general management tools, as well as some vertical industry tools. OCI mainly includes the company's distinctive database services and computing power leasing business.
In the early years, OCA accounted for a higher proportion within the cloud segment. However, in the past 1-2 years of rapid growth, OCI's proportion has gradually surpassed OCA.
b. Software: Refers to traditional software businesses deployed and managed by customers themselves, which was originally the company's largest revenue segment but has now been surpassed by the cloud segment.
It can be divided into two main parts: one-time license sales revenue (Software License) and accompanying ongoing service support revenue (Software Support), such as providing usage support and daily updates and maintenance.
c. Hardware: Similar to the software business, it includes one-time hardware (such as servers) sales revenue and accompanying hardware maintenance & support revenue, accounting for the smallest proportion of revenue.
d. Services: Refers to other service businesses beyond the above software and hardware businesses, including consulting services or other customized services, accounting for a high single-digit percentage of revenue in recent years.
II. Core Focus: OCI Performance
1. Key Business - OCI Continues to Accelerate Growth as Expected
The most critical IaaS/PaaS-type OCI business revenue reached nearly $5.8 billion this quarter, up about 93% year-over-year. After excluding the positive impact of exchange rates, the actual growth rate was 92%, continuing to accelerate as expected from the previous quarter's 81%. However, the acceleration pace slowed slightly, with the previous quarter at 16 percentage points and this quarter at 11 percentage points.
The market consensus expectation for growth was also nearly 92%, so although OCI business has indeed been accelerating growth, there was no pleasant surprise of outperforming expectations. In comparison, growth in the SaaS-type business under the cloud segment deteriorated. After excluding the impact of exchange rates, actual revenue declined by 3% year-over-year this quarter, with the decline widening from the previous quarter's 1%. This shows that while AI benefits the upstream infrastructure layer, the company's downstream SaaS businesses still face significant growth pressure.
2. Is gross profit still under pressure but showing signs of bottoming out?
It is widely accepted in the market that the revenue growth of AI businesses is accompanied by a decline in gross profit margins, especially for new cloud companies like Oracle. The combined gross profit margin for the cloud + software businesses was 68.8% this quarter, showing signs of bottoming out and rebounding from last quarter's 68.2%. Although the year-over-year decline was still a significant 6.8 percentage points, it was narrower than last quarter.
However, since the cloud and software businesses are both included, it is not easy to determine whether the rebound in gross profit margin is due to the stabilization of OCI's gross profit margin or improvements in the gross profit margins of other businesses. From an expectations perspective, the market expected an overall gross profit margin of over 66%, but the actual figure was only 65.2%. Therefore, overall, the gross profit performance this quarter was still negative and did not fundamentally alleviate market concerns about profit margins.
3. Leading Indicator – RPO Growth Exceeds Expectations, Has Capex Sharing Become Mainstream?
Since there were no rumors before the earnings announcement about the company signing significant new deals, the market's expectations and focus on RPO this quarter were relatively low, at only RMB 590 billion, a slight sequential increase of less than RMB 40 billion. However, after an actual sequential increase of RMB 85 billion, the total RPO reached RMB 638 billion, making it one of the few bright spots this quarter.
The company still did not disclose specifics about the new orders, but given its recent announcement of collaborations with the U.S. federal government and the Department of War, it is speculated that the unexpectedly high volume of new orders may have come from the government.
Additionally, it is noteworthy that last quarter, the company indicated that some orders' Capex investments would be partially covered by customer prepayments or self-purchased hardware. This quarter, the company announced that approximately RMB 75 billion in orders are currently based on this Capex-sharing model.
Considering that most of these orders were likely signed in the past two quarters, it implies that more than half of the recent new orders may have adopted this Capex-sharing model. This is a positive signal for the company's own cash flow and balance sheet structure.
III. Recent Balance Sheet Continues to Deteriorate, but Medium- to Long-Term Positive Signs Emerge?
With the continued acceleration of OCI revenue growth, Capex this quarter was approximately RMB 16.5 billion, down from last quarter's RMB 18.6 billion. However, since the market, based on the previous earnings report, had expected the company to maintain its full-year Capex guidance of RMB 50 billion without an increase, it mechanically deduced that this quarter's spending would only be around RMB 11 billion, making the actual spending significantly exceed expectations. Nevertheless, given the accelerated capacity deployment, it is more accurate to say that expectations were too low rather than actual Capex being too high.
Additionally, the company disclosed that the Capex-sharing model mentioned earlier covered approximately RMB 4.6 billion in Capex spending this quarter. As a result, the company's free cash flow has improved from outflows of RMB 10 billion per quarter previously to a net outflow of RMB 1.9 billion this quarter, clearly reflecting a reduction in the company's cash flow pressure.
To support large capital expenditures, the company stated that it has completed RMB 43 billion in bond financing and RMB 5 billion in equity financing in FY26, and will conduct RMB 20 billion each in debt and equity financing (totaling RMB 40 billion) in the new FY27 (which had been previously disclosed), securing funding sources for most of the Capex investments in the next fiscal year.
In fact, this financing target is lower than the free cash flow gap originally expected by Dolphin Research and the market (over RMB 50 billion). Dolphin Research believes that it is likely because some funding needs have been borne by customers themselves, reducing the company's own debt burden. This is also a positive signal from a long-term perspective.
However, these positive signs are not yet apparent. Actual interest expenses this quarter reached RMB 1.44 billion, showing another significant sequential increase of nearly 22%. The proportion of interest expenses to total revenue further increased to 6%. Based on the balance sheet, the company's net interest-bearing debt also increased by over RMB 16 billion year-over-year.
From a medium- to short-term perspective, the company's balance sheet and debt repayment pressure are still expanding.
IV. Traditional Segments Continue to Decline
Unlike the accelerated growth of the OCI business, the performance of traditional segments, which still account for about 75% of total revenue, is deteriorating. The revenue growth of the second-most critical SaaS and software businesses was +10% and -2%, respectively, with growth slowing sequentially and falling short of market expectations. Although hardware and service revenue growth was significantly better than expected, these two businesses combined account for just over 10% of total revenue, making the deterioration of software and SaaS businesses the primary issue.
Therefore, although the company's infrastructure-layer OCI business benefits from the rise of AI, its larger traditional pan-software businesses face increasing pressure.
V. Overall Performance Mixed
1. Strong Infrastructure Layer, Weak Software Layer, Overall Growth Steady
Summarizing the four major business segments, the accelerating OCI segment and the weakening software business offset each other, resulting in overall revenue growth of 20.6% this quarter, which at first glance appears to be a deceleration from last quarter. However, after excluding the impact of exchange rates, the actual growth rate was 20%, still a slight acceleration of 2 percentage points from last quarter.
2. Gross Profit Margin Continues to Decline
As mentioned earlier, the company's overall gross profit margin showed initial signs of stabilization sequentially this quarter but remained in a clear contraction trend year-over-year. Consequently, the year-over-year growth rate of total gross profit was 12%, still significantly lower than revenue growth and slightly below market expectations by about 0.6 percentage points.
3. Good Cost Control Helps Profit Growth Outpace
In terms of expense spending, at first glance, overall expenses grew by 5.4% year-over-year this quarter, significantly higher than last quarter's 1% growth and exceeding market expectations by 1.7 percentage points, suggesting a potential increase in expense investment. However, this is because approximately RMB 800 million in "restructuring" expenses were recognized this quarter, likely due to the impact of previous news reports that the company would lay off nearly 30,000 employees (accounting for about 19% of the workforce, though the company did not confirm this directly).
Looking only at the three regular operating expenses, actual spending this quarter decreased by about 5.6% year-over-year, 7 percentage points lower than market expectations. All three expenses showed negative year-over-year growth, with marketing expenses declining by over 10%. This demonstrates that, despite pressure on gross profit margins and tight cash flow due to Capex, the company's cost control efforts and results have been commendable.
Benefiting from excellent cost control, despite a significant decline in gross profit margins, the adjusted operating profit margin rebounded year-over-year, returning to positive growth of about 0.5 percentage points, better than market expectations.
Ultimately, adjusted operating profit was RMB 8.6 billion, up about 22% year-over-year. Despite gross profit falling short of expectations and revenue, profit growth outpaced both revenue and expectations.
- END -
// Reprint Authorization
This article is an original piece by Dolphin Research. Reprinting is only allowed with authorization.
// Disclaimer and General Disclosure
This report is for general comprehensive data purposes only, intended for general reading and data reference by users of Dolphin Research and its affiliated institutions. It does not take into account the specific investment objectives, investment product preferences, risk tolerance, financial status, or special needs of any individual receiving this report. Investors must consult with independent professional advisors before making investment decisions based on this report. Any person making investment decisions using or referring to the content or information in this report does so at their own risk. Dolphin Research shall not be liable for any direct or indirect responsibilities or losses that may arise from the use of the data contained in this report. The information and data in this report are based on publicly available sources and are for reference purposes only. Dolphin Research strives to ensure but does not guarantee the reliability, accuracy, and completeness of the information and data.
The information or opinions expressed in this report shall not, in any jurisdiction, be construed as or deemed to be an offer to sell securities or an invitation to buy or sell securities, nor shall they constitute recommendations, inquiries, or endorsements of relevant securities or related financial instruments. The information, tools, and data contained in this report are not intended for or proposed for distribution to jurisdictions where such distribution, publication, provision, or use of the information, tools, and data would contravene applicable laws or regulations or result in Dolphin Research and/or its subsidiaries or affiliated companies being subject to any registration or licensing requirements in such jurisdictions, nor to citizens or residents of such jurisdictions.
This report only reflects the personal views, insights, and analytical methods of the relevant creators and does not represent the stance of Dolphin Research and/or its affiliated institutions.
This report is produced by Dolphin Research, and the copyright is solely owned by Dolphin Research. No institution or individual may, without the prior written consent of Dolphin Research, (i) make, copy, reproduce, duplicate, forward, or distribute in any form any copies or reproductions, and/or (ii) directly or indirectly redistribute or transfer to other unauthorized persons. Dolphin Research reserves all related rights.
-
![]()
AI Giants Start Borrowing to Fuel Computing Power Race
-
ByteDance Initiates Largest B2B Structural Adjustment, This Time It's Truly Different
-
![]()
Let's Talk About Kingsoft Office's Mid-Year Outlook and the True Strength of Its AI-Powered Office Solutions
-
Despite 150 Million Users, Struggles Persist: AIShige Faces Tough Competition from Seedance and Kling in AI Video Monetization
-
![]()
Ensuring Safe Gear Shifting in the Automotive Industry: Transitioning from 'Product Oversight' to 'Full-Chain Governance'
-
![]()
Net Profit Soars to $133.7 Billion! Azure Revenue Tops $100 Billion, with AI Fueling Microsoft's Growth
-
![]()
Before 6G Hits the Market, the U.S. Forges a 'Rules Alliance': What Challenges Await Chinese IoT Enterprises?
-
![]()
Intelligent Driving's 'Little Blue Light' Faces Ban: Night Glare and Cut-in Risks Prompt Official Action