Volkswagen's Market Share in China Drops to 9.7% in a Decade, U.S. Brands Down to 5%: Chinese Automakers Take the Offensive to Competitors' Doorsteps
 07/07 2026
 385
385
Author | Jiang Xu
For more financial insights | BT Finance Data Pass
The full text is 2,542 words, with an estimated reading time of 9 minutes
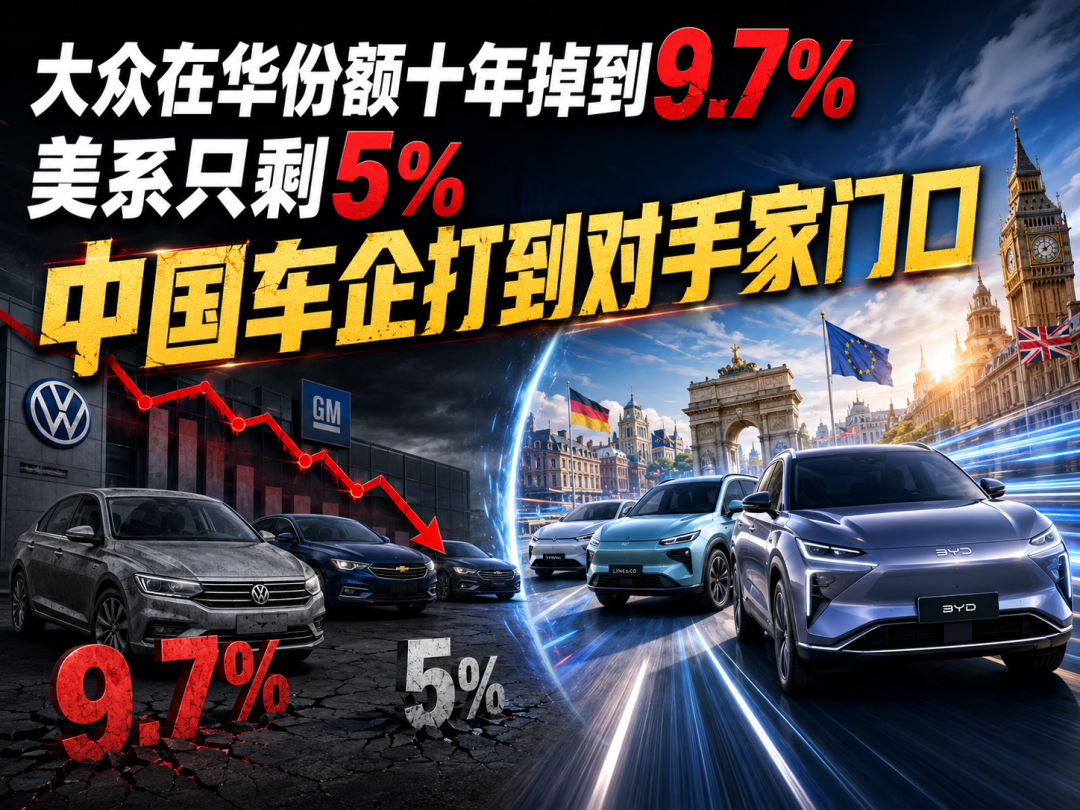
On July 1, 2026, a set of data from consulting firm AlixPartners drew attention in China’s auto circle: Volkswagen, the largest Western automaker in China, saw its market share drop from 14.7% in 2015 to 9.7% in 2025 (Source: AlixPartners, cited by Kuaikeji, July 1, 2026).
In the same dataset, the total market share of U.S. brands in China fell from 12% in 2014 to 5% in 2025. In a decade, both figures nearly halved. For Chinese automakers, this is not just an ordinary shift in market share but a complete reversal of offensive and defensive positions on their home turf—even beginning to push the frontline to their competitors’ doorsteps.
1. A Decade of Shifting Market Share

Market share is just the surface; profits are even more glaring. Volkswagen’s business profits in China have shrunk from a peak of around $5 billion to an estimated $228 million to $684 million in 2026 (Source: AlixPartners / Kuaikeji, July 1, 2026). What was once a “profit cow” is visibly bleeding.
Chinese brands, meanwhile, have captured about two-thirds of new vehicle sales in China with richer configurations, more advanced intelligence, and competitive pricing, nearly squeezing out foreign brands from the pure electric and plug-in hybrid markets (Source: AlixPartners / Kuaikeji, July 1, 2026). Foreign brands still hold about half of the fuel-powered vehicle (internal combustion engine vehicle) market, but this segment itself is continuously shrinking.
The backdrop is the overall size and structure of China’s auto market. In 2025, China’s auto production and sales reached 34.531 million and 34.40 million units, respectively, with new energy penetration exceeding 50% (Source: China Association of Automobile Manufacturers, 2026). When half of new vehicles are new energy, and foreign brands are almost absent from this main track, a halving of market share is almost a structural inevitability.
2. Speed: Chinese Automakers’ Killer Move
Why is this happening? Stephen Dyer, head of AlixPartners’ Asia-Pacific automotive practice, gave a straightforward answer: Unlike the lengthy development cycles of Western automakers, Chinese automakers prefer to launch products quickly and then continuously improve functionality through software updates (Source: AlixPartners / Kuaikeji, July 1, 2026).
Breaking it down, Chinese automakers’ advantages can be attributed to three factors. First is product rhythm: launch vehicles first, then iterate continuously via OTA, shifting from “slow and meticulous” to “sell while upgrading.” Second is intelligence: smart cockpits and advanced driver-assistance systems have become new competitive focal points, areas where traditional giants are slowest to adapt. Third is cost: vertically integrated supply chains and economies of scale allow vehicles with the same configurations to be priced lower. Combined, these form a “home-court strategy” that competitors find hard to replicate.
3. The Giants’ Profit Cows Are Bleeding
Volkswagen is not alone in bleeding. In fiscal 2025, Mercedes-Benz Group’s revenue fell about 9% year-on-year to approximately €132.2 billion, with net profit plunging nearly 48.8% from €10.4 billion to €5.331 billion, and full-year sales dropping 9.2% to 1.8013 million units (Source: Economic Observer, February 28, 2026). Porsche, which once contributed over 30% of Volkswagen Group’s profits, reported its first quarterly loss since going public in Q3 2025, with a loss of €960 million (Source: Economic Observer, February 28, 2026).
Japanese and Korean automakers are also under pressure. Nissan expects a net loss of about ¥650 billion in fiscal 2025 and is advancing its “Re:Nissan” restructuring, planning to close 7 factories globally and lay off 20,000 employees; Honda has sharply lowered its global pure electric vehicle sales target for 2030 from 2 million units to 700,000–750,000 units (Source: Economic Observer, February 28, 2026).
These giants face the same triple pressures: high investment in electrification transformation, intense competition in the Chinese market, and weak global demand. The larger the fuel-powered vehicle (internal combustion engine) system, the more staggering the “bleeding” during the transition.
4. Price Wars Are Being Replicated on Competitors’ Home Turf
A more alarming signal is that this home-court offensive is spilling over. To counter Chinese brands, Kia decided to narrow the price gap between its European models and Chinese competitors from 20–25% to 15–20%; Volkswagen plans to re-export Chinese-made models to Europe, using cost advantages to retaliate (Source: Wangtongshe, May 2026).
The following is speculation for readers’ reference. When multinational giants begin cutting prices in their European and Southeast Asian home markets—or even using “Made in China” cost weapons to strike back—it means the efficiency and cost advantages honed in China are spilling over globally through supply chains and products. The rules of the home-court offensive are being brought to competitors’ doorsteps by Chinese automakers.
But Chinese automakers cannot focus solely on market share. In 2025, China’s auto industry profit margin dropped to 4.1%, nearly halving from 7.8% in 2017 (Source: National Bureau of Statistics, 2025). With scale at its peak but profits thin, the profit per vehicle still lags far behind international giants. Winning market share does not necessarily mean winning profits—this is the most genuine concern in this showdown.
Takeaway Framework · Home-Court Offensive Triangle (Product Rhythm × Intelligence × Cost): To judge whether an incoming giant will be overturned by local players, don’t just look at brand age or reputation—check if it is simultaneously slow, outdated, and expensive in these three areas. Slow product launches, a generation behind in intelligence, and higher costs: if all three are lost, a halving of market share is only a matter of time. This yardstick can also measure Chinese automakers’ global expansion: can they bring these three advantages to competitors’ home markets?
5. This Shift Is a Century-Old Value Chain Restructuring
Zooming out, this is not just about a few companies’ success or failure but a deep restructuring of the auto industry’s century-old value chain. Profits are shifting from traditional fuel-powered vehicle (internal combustion engine) powertrains and some multinational parts giants to the three electric systems (battery, motor, electric control), intelligent driving, smart cockpits, and Chinese automakers with systemic advantages. The ebb and flow in market share figures are just the visible part of this restructuring.
A decade ago, foreign brands taught China how to build cars; a decade later, Chinese automakers are returning the favor on their home turf with “faster, smarter, cheaper” strategies. But replacing market share with profits and scale with brand premium—the true second half of this showdown—has only just begun.
6. What Does This Mean for You?
First, for practitioners and investors in the automotive, parts, and intelligent driving industries: the value chain is restructuring. Those aligned with the three electric systems and intelligence are positioned in the direction of profit migration.
Second, for those in manufacturing globalization, supply chains, and cross-border trade: Chinese automakers are exporting cost and efficiency globally, creating opportunities but also inviting retaliatory tariffs and trade barriers. The path to global expansion is not easy.
Third, for anyone following China’s overall manufacturing upgrade: the auto industry is just a sample, reflecting how far “Made in China” has progressed from a processing hub to a technological innovator. What are your thoughts? Feel free to share them in the comments.
This article is for information sharing and industry analysis only and does not constitute any investment advice, investment analysis opinions, or trading solicitations. Data cited comes from named sources such as AlixPartners, Kuaikeji, Economic Observer, Wangtongshe, China Association of Automobile Manufacturers, and the National Bureau of Statistics, with dates as specified; data is subject to the original sources. Foreign enterprises mentioned are for comparison only, without endorsement or criticism; “speculation” content is logical deductions based on public information and does not represent official positions. Market risks exist; decisions should be made cautiously.
This article is an original work by BT Finance and may not be used, reproduced, disseminated, or adapted without permission. Infringement will result in legal action.

The views expressed in this article are the author’s own. For questions or feedback, please leave a comment directly in the comments section.
-
![]()
The Surprisingly Significant Impact Difference Between Quiet and Noisy Cars!
-
![]()
Breaking Through Storage Cycle Barriers: How AI Large Models and Coding Technology Synergize to Drive Transformation in the Security Industry
-
Facilitating the Slimming of Camera Modules! O-film Obtains Utility Model Patent for Periscope-Type Reflective Component
-
![]()
Hikvision Raytine’s Millimeter-Wave Body Imaging Security Inspection Device Achieves ECAC SSc Category A Standard Level 2.1 Certification for European Civil Aviation
-
![]()
Global Market Share for Security Windows Hits 26%! This Optical 'Little Giant' Makes Its Debut on NEEQ
-
![]()
The Evolutionary Path of Agent Engineering: From Prompt to Harness by Zhang Yutao, Co-founder of Moonshot AI
-
![]()
Profits and stock prices are both declining, so why are executives from these auto companies increasing their purchases?
-
![]()
Burning Tens of Billions of Dollars, Yet No Unified Definition for World Models