Tech Stocks Plunge Across the Board, but Industry Giants Say "Don't Panic"
 11/05 2026
 463

A Tech Stock "Plunge" Triggered by Layoffs
Image source: Internet (contact us for removal if infringing). Partially AI-generated.
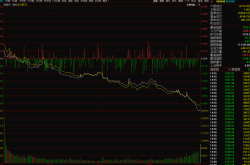
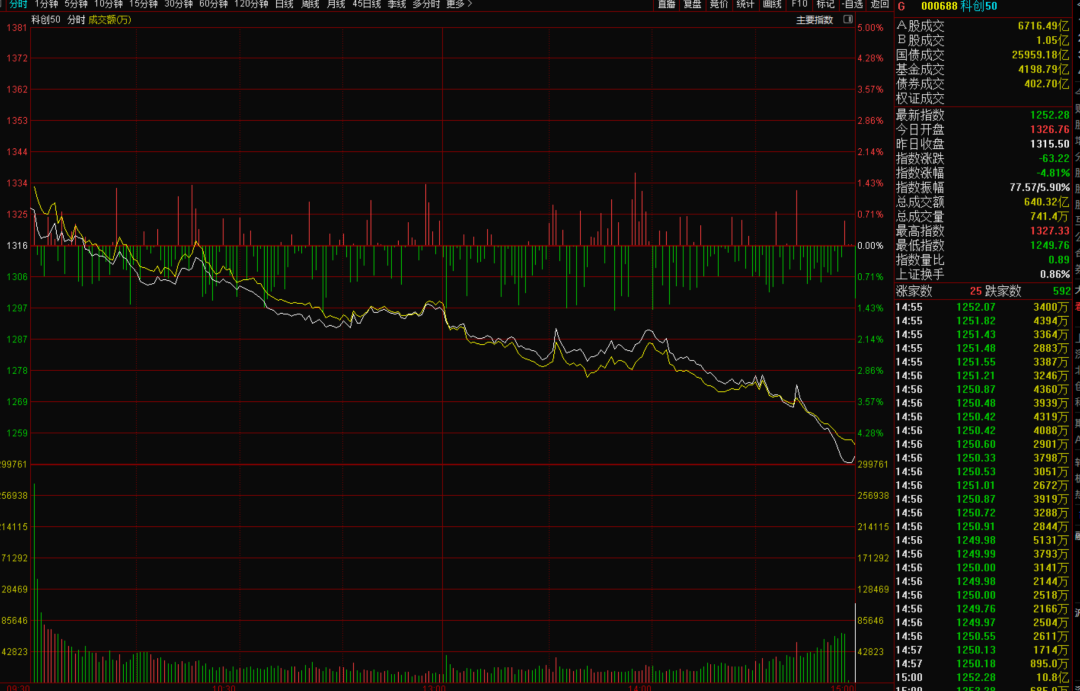
On November 3, the Shanghai Composite Index fell 0.82%, the ChiNext Index dropped 2.73% and lost the 2,400-point mark, the STAR Composite Index plunged 4.84%, and the dual-innovation boards hit a new low for the year.
The selloff was unusually concentrated in its core targets: the CPO concept index fell 6.77% in a single day, PCB dropped 5.14%, memory chips fell 6.47%, and AI hardware broadly "hit new lows across the board."
Zhongji Innolight fell 12.69% in a single day, wiping out 82.2 billion yuan in market value; Tianfu Communication dropped 12.80%, while Cambricon and Muxi shares fell more than 10%. The three optical module giants collectively shed 127.3 billion yuan in market value in one day, and the STAR 50 directly hit a 52-week low.
Then, almost simultaneously, two voices flooded the market at once.
On one side, the candlestick chart was speaking: sell, sell first and ask questions later. On the other side, announcements and research reports were speaking: don't panic—this is a delivery pace issue, not a demand issue.
STAR Market leaders ChangXin Technology, Cambricon, and AMEC spoke out intensively, voicing firm optimism about the long-term trend. Cambricon's chairman proposed a 400 million to 500 million yuan buyback, and AMEC's chairman proposed a buyback of the same scale—making a statement with real money.
CSC Financial's research report was repeatedly cited by the media: the four major North American cloud providers' combined Q3 capital expenditure was 208.7 billion US dollars, up 84.2% year-on-year, with a full-year guidance of about 730 billion—only 0.3% lower than the 732.5 billion after the second-quarter report—characterized as "a delivery pace adjustment, with the overall investment scale still at a high level."
Stock prices are falling; companies are shouting. When the candlestick chart and announcements point in opposite directions, which one should you believe?

The 5 Billion US Dollar Fuse + Who Is Lying?
Microsoft slightly adjusted its calendar 2026 capital expenditure guidance from 175 billion US dollars to 170 billion US dollars. Five billion US dollars is almost negligible against Microsoft's operating cash flow for a single quarter. But the market exploded.
What exploded was not the number itself, but the narrative shift potentially implied behind the number. Over the past two years, the stock price logic of the AI computing power chain has been built on a very simple chain: unlimited expansion of major companies' capital expenditure → unlimited growth of optical module/GPU/memory orders → valuations can be given on a "forward" basis.
This chain does not require every link to be perfect, but it requires a psychological premise: the direction will not change.
Once any signal appears that may point to "the direction has changed," even if the signal itself is weak, the link with the most crowded positions and the largest gains will be sold off first.
The real reason for Microsoft's downward revision, according to multiple information sources, points to the same explanation: delivery delays from third-party GPU suppliers, with capacity postponed to the first half of 2027, rather than proactive contraction on the demand side.
Whether this explanation is "credible" will be discussed later. But what the market was trading on November 3 and 4 was not this explanation at all. What the market was trading was "I can't wait until the day the explanation is verified."
When the STAR 50 is near a 52-week low, and when optical module leaders have seen year-to-date gains measured in multiples, any ambiguous headline is enough to trigger a resonance of profit-taking and stop-loss orders. The candlestick chart prices the speed of marginal change, not the position of the absolute level.
This is the first mismatch: announcements and research reports say "existing demand is still very large," while the candlestick chart says "the slope of the incremental narrative may have changed." The two are not talking about the same thing.
To judge whether "delivery pace" is a fig leaf or the truth, one cannot listen to qualitative statements; one must look at three sets of hard data that can be cross-verified.
The first set: the total amount of capital expenditure.
The reason Microsoft's 5 billion downward revision was amplified is that it was pulled out of the combined total of the four major North American cloud providers. Put back into the aggregate: Amazon maintains about 220 billion, Google maintains 195 billion to 205 billion, Meta narrows its guidance to 135 billion to 145 billion, plus Microsoft's 170 billion, for a full-year total of about 730 billion—only 0.3% lower than the 732.5 billion after the second-quarter report.
Q3 single-quarter was 208.7 billion, up 84.2% year-on-year and 21.9% quarter-on-quarter. More importantly, all four major providers clearly guided that capital expenditure will continue to increase significantly in 2027.
The domestic dimension also shows no contraction signal: Rhodium Group estimates China's AI infrastructure capital expenditure in 2026 at about 932 billion yuan, breaking through 1.2 trillion yuan in 2027, with ByteDance being the largest source of incremental growth.
The total data does not support the judgment of "reversal of demand trend." A 0.3% downward revision of the full-year guidance cannot support the conclusion that "AI capital expenditure has peaked."
The second set: orders on hand and order visibility.
This is a "harder" signal than capital expenditure guidance. Capital expenditure guidance can be fine-tuned, but orders already signed into contracts and locked to specific years will not disappear because of one guidance.
Zhongji Innolight's main customer orders have covered through 2027, with some key customers giving demand guidance for 2028; Eoptolink clearly stated that it "has seen clear order guidance for 2027," with 1.6T optical modules entering a phase of continuous volume ramp-up.
As of the end of the third quarter, Cambricon's inventory was 11.665 billion yuan, up 41.43% quarter-on-quarter, with prepayments of 3.044 billion yuan, totaling nearly 14.7 billion yuan tied up in the supply chain. If a chip design company did not have a sufficiently strong judgment on downstream demand, it would not turn nearly 15 billion yuan of cash into inventory and prepayments.
Zhongji Innolight's inventory was 23.878 billion yuan, up 88.3% year-on-year, with prepayments up 65.3% quarter-on-quarter; the company's explanation on the conference call was "stockpiling materials for subsequent orders."
Order visibility extends to 2027 or even 2028, while the candlestick chart is trading the marginal sentiment of Q4 2026. This is the second mismatch: announcements price the locked contract volume over a two-to-three-year dimension, while the candlestick chart prices the speed of capital crowding clearing in the next quarter.
The third set: gross margin.
If "demand shrinkage" were true, the most honest indicator would be price. When demand contracts, suppliers' first reaction is to cut prices to grab orders, and gross margins would collapse before revenue.
But the data points in the opposite direction. Zhongji Innolight's Q3 single-quarter gross margin was 46.6%, up 3.8 percentage points year-on-year and still rising quarter-on-quarter, driven by a higher share of high-end products and rising silicon photonics penetration.
Cambricon's Q3 single-quarter consolidated gross margin was 58.69%, up 2.59 percentage points quarter-on-quarter, rising rather than falling against the backdrop of price increases in memory and upstream raw materials.
ChangXin Technology expects its Q4 gross margin to remain stable in investor communications, based on the continuation of tight DRAM supply and support for revenue growth from orders on hand and locked demand.
A more micro-level price signal comes from the computing power leasing side: Xingyun Technology disclosed computing power and storage orders of about 20.641 billion yuan, and V customers and VB customers have completed a second upward adjustment of contract amounts, citing "recognition of the company's delivery capabilities."
Customers proactively raising prices and the logic of "demand shrinkage" are not in the same universe.
The three sets of data point in the same direction: orders and prices on the demand side have not collapsed; physical bottlenecks on the supply side—GPU delivery, HBM capacity, data center power, etc.—have caused a periodic misalignment in the speed of converting capital expenditure into revenue.
Microsoft's statement about "third-party capacity delivery delays" can be cross-verified under this framework; it is not an isolated case.

The ROI Crack and Idle GPUs
What really deserves to be unpacked is: since orders and gross margins are both fine, why does the market still choose to vote with its feet?
Because the market is pricing something longer-term and harder to falsify than "delivery pace": the return on capital expenditure.
In 2026, the ratio of the four cloud providers' capital expenditure to direct AI revenue is as high as 4.3:1; even using total cloud revenue as the denominator, the capital expenditure/revenue ratio is around 1.7:1, and revenue clearly does not cover investment.
This is not a one-quarter problem; it is a structural gap. The five major cloud providers' capital expenditure in 2026 is expected to consume 90% of operating cash flow, and by 2027 this proportion may rise to 104%.
In other words, AI infrastructure is sliding toward the critical point of "investing with cash flow or even external financing" from "investing with profits."
At the same time, the reality of computing power utilization is not flattering. VentureBeat Intelligence's consecutive surveys in Q3 2026 show that 79% of enterprise respondents said their GPU computing power is completely idle at least half the time.
The claim that the average GPU utilization rate of major Silicon Valley companies is in the 10% to 30% range is widely circulated in the industry; Meta even officially advanced a "sell computing power" plan in July 2026 to rent out idle GPUs during training gaps for monetization.
If computing power were truly extremely scarce, why would there be large-scale idleness and external leasing?
This is the shorts' real ammunition: "delivery pace" explains why revenue recognition was slower this quarter, but it cannot explain "if all the delayed capacity eventually arrives, can demand fully utilize every card."
Microsoft's postponement of capacity to the first half of 2027 is a "supply bottleneck" in the eyes of bulls, and in the eyes of bears it "gives the demand side an extra time window to examine ROI." The same thing, two readings, both with a factual basis.
Comparing AI to the 2000 internet bubble is the laziest narrative trope of the past year. But lazy analogies often obscure key differences.
The main capital expenditure subjects of the 2000 bubble were a group of startups with short histories, no stable profits, and complete reliance on external financing to survive.
In 1999, there were 289 internet-related IPOs in the US stock market; these companies had an average listing cycle of only 30 months, and once the financing window closed, their funding chains snapped instantly.
Today's AI infrastructure money mainly comes from giants with mature profitable core businesses and abundant operating cash flow, such as Microsoft, Google, Amazon, Meta, Alibaba, and Tencent.
Their capital expenditure does not need to rely on "telling stories" to raise financing; when short-term returns fall short of expectations, they have buffer space to adjust pace rather than being forced into sudden death.
But differences do not mean safety. The fatal wound of the 2000 bubble was not that capital expenditure was too large, but that demand was severely overestimated, creating excess invalid capacity.
Today's AI computing power does not have absolute overcapacity of "built but nobody uses it," but it does have a structural mismatch of "built faster than commercial monetization speed." The capital expenditure/revenue ratio of 4.3:1 is the quantitative expression of this mismatch.
Giants will not die because of a one-quarter mismatch, but stock prices will. Industrial resilience and stock price resilience have never been the same thing.

Candlestick Chart and Announcements: Which to Believe?
To be precise, neither the candlestick chart nor the announcements are "lying"; they are simply voting for different things.
The candlestick chart is voting for the clearing of crowding. When a sector's chips are highly concentrated, floating profits are thick enough, and valuations are anchored to "long-term perfect execution," any slight disturbance will trigger self-reinforcing selling.
In the November 3 decline, the biggest losers were precisely the optical modules and computing power chips with the largest year-to-date gains and the most crowded trading, not the targets with the worst fundamentals. This is a capital structure problem, not a demand judgment problem.
Announcements and orders are voting for the certainty of locked contracts. Management buybacks, order coverage through 2027, and gross margins rising rather than falling in a price-increasing environment—the information content of these signals lies in the fact that they are commitments with costs.
Buybacks require cash, stockpiling ties up capital, and price increases require customer signatures.
Saying "optimistic about the long term" costs nothing, but turning 11.6 billion into inventory and tying up 23.8 billion in stockpiling has a cost.
For investors, then, the real question isn't "Do I trust the candlestick chart or the announcements?" It's whether your holding period aligns with the time horizon of whichever signal you're following.
If your decision cycle runs in weeks or months, the crowding unwind and sentiment inertia priced into the candlestick chart won't reverse just because of a research report. Trading against the chart demands exceptionally strong position management and a high tolerance for time.
If your decision cycle spans years, then order visibility, gross margin trends, and total capital expenditure are the variables that matter more. Short-term candlestick noise should be filtered out—but only on the premise that you have a clear read on the widening ROI gap.
The most dangerous position is the middle ground: using long-term announcements to talk yourself into enduring short-term candlestick pain, without leaving yourself enough room to survive the swings in between.

This round of correction in the AI computing power chain is most likely not a dot-com-style bust. After all, demand is real, orders are locked in, and supply bottlenecks are physical.
But it's equally not a "back up the truck and buy the dip" opportunity to be snapped up blindly. The capex-to-revenue ratio gap is widening, GPU utilization data is undercutting the narrative, and the tech giants' free cash flow buffers are thinning.
"Delivery pace adjustment"—those three words are a comfort in the mouths of bulls and a sedative in the mouths of bears.
The truth probably lies somewhere in between: the pace is indeed adjusting, and that adjustment is precisely the necessary path for the industry to move from "piling on computing power at all costs" to "questioning the return on every yuan of capex."
This process won't kill AI, but it will kill a group of people who entered at the wrong valuation levels with the wrong holding periods.
-
![]()
Keboda, the Single-Item Champion in Vehicle Lighting Control, Sees Lighting Control Revenue Drop by 479 Million Yuan in Q3, Net Profit Down 47.17%; Intelligent Driving Domain Controllers Up 72.29%
-
AI Marketing: The 10 Fastest-Growing and Most Profitable Companies
-
![]()
Chinese Companies Going Global: Don’t Put on a Stern “Strict Father” Face
-
![]()
The Sky Has Fallen on the Wait-and-See Crowd! Blogger Reveals Manufacturers Are Stockpiling and Locking Up Production Capacity—No Hope of Phone Price Drops for the Next Three Years
-
![]()
Tech Stocks Plunge Across the Board, but Industry Giants Say "Don't Panic"
-
![]()
Domestic Android Needs a New Benchmark
-
![]()
Aerospace and Aviation Lead Cities: An Analysis of the Industrial Structure of Beijing, Shanghai, Chengdu, Xi'an and Shenyang
-
![]()
Chinese Large Models Are Going Open Source in Droves: AGI Ideal or Ecosystem Positioning?