BYD Enters the Million-Employee Era: The World's Largest Automaker by Headcount
 10/30 2026
 487
On October 28, Wang Chuanfu announced that BYD's total workforce had reached 1.02 million, including 960,000 in China—100,000 more than the figure in its 2025 annual report.
Starry Sky Jun felt a quiet sense of satisfaction at the thought that another 100,000 young people from small towns had found decent work right on their doorstep.

Starry Sky Jun then looked at the company's cash flow statement, where "cash paid to and on behalf of employees" roughly corresponds to employees' gross pay.
On average, that works out to around 10,000 yuan a month per person; by rough estimate, the median probably sits somewhere between 6,000 and 8,000.
It is worth remembering that over 80% of BYD's employees hold a college diploma or below.
On the one hand, most of BYD's newly opened factories in recent years are located in county towns and townships, where this income is highly competitive locally. Young people from small towns earning 6,000–8,000 yuan at their doorstep have no need to head to Beijing, Shanghai, or Guangzhou to compete with everyone there for 10,000-yuan job opportunities.
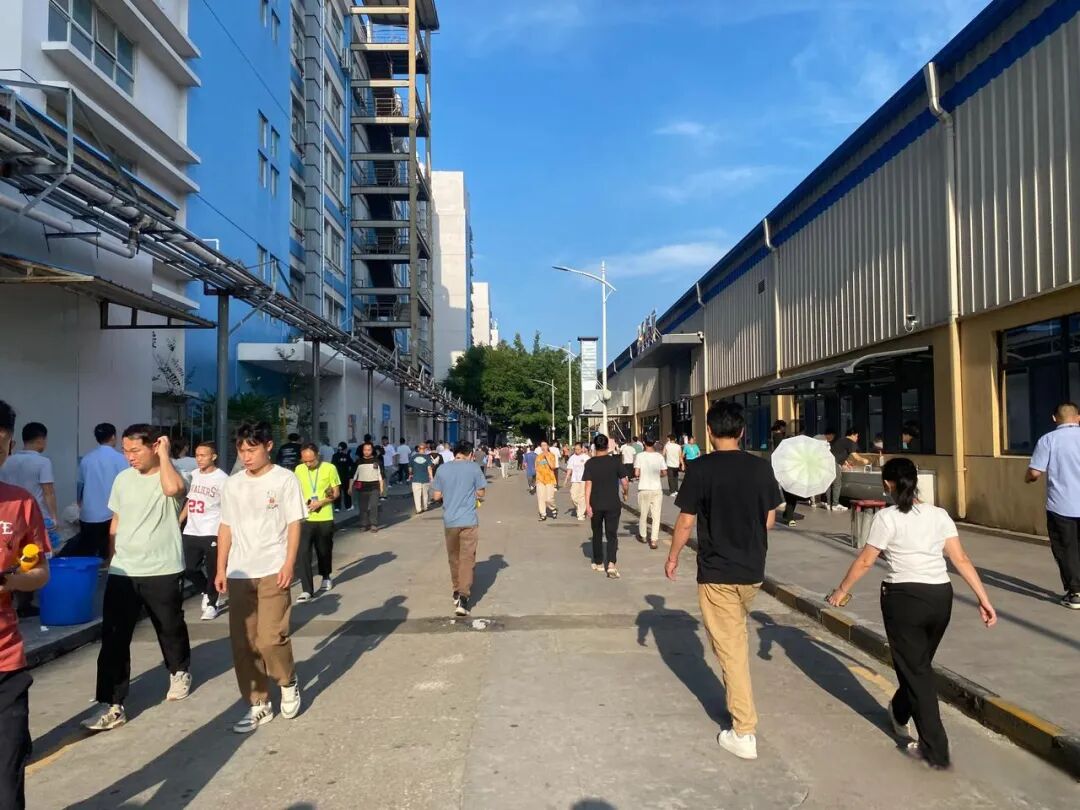
On the other hand, as a poster child for "sweatshop"-style enterprises, overtime is unavoidable—and that 6,000–8,000 yuan does not come easily.
So Starry Sky Jun believes that companies like BYD and CATL should be viewed dialectically.
In the county economy, manufacturing jobs that offer formal labor contracts, the five social insurances and one housing fund, dormitories, and meal subsidies are still scarce goods in their own right.
Compared with scattered local service-sector jobs or unprotected odd jobs, the "formality" of this work constitutes a different kind of hidden income. The continuity of social security, work injury protection, and relatively predictable promotion channels are uncommon in the employment ecosystem of small towns.
It is hard to capture companies like BYD and CATL with the binary labels of "conscientious enterprise" or "sweatshop."
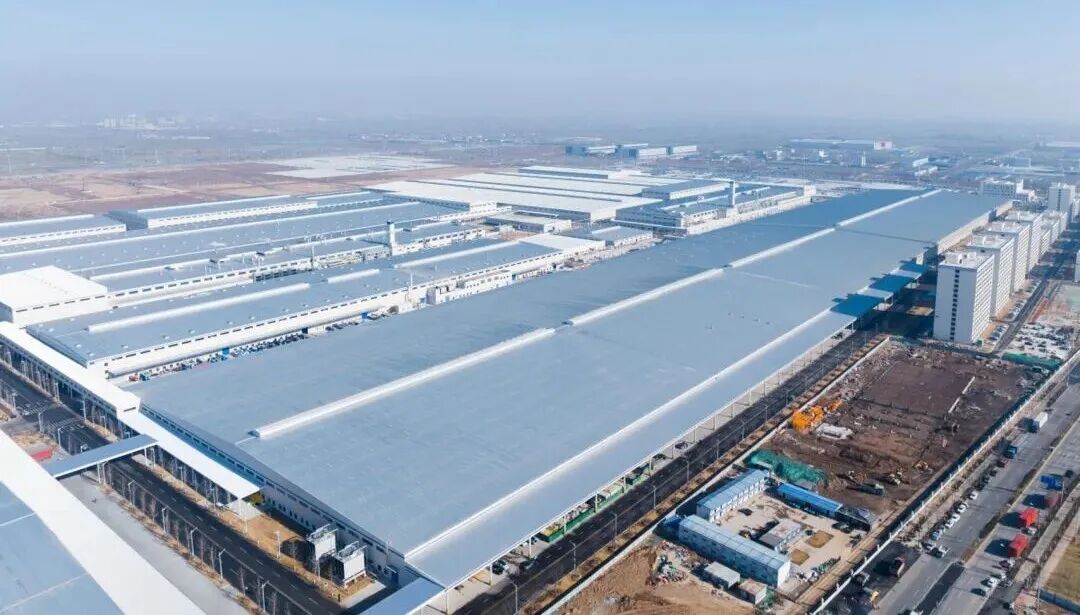
A more honest statement might be this: they provide one of the few large-scale formal employment opportunities in China's county-level society, but how these opportunities are obtained and what they ultimately return depend heavily on the company's profit cycle and on each individual's physical endurance.
On October 29, BYD released its Q3 2026 report.
1. BYD's Q3 Report
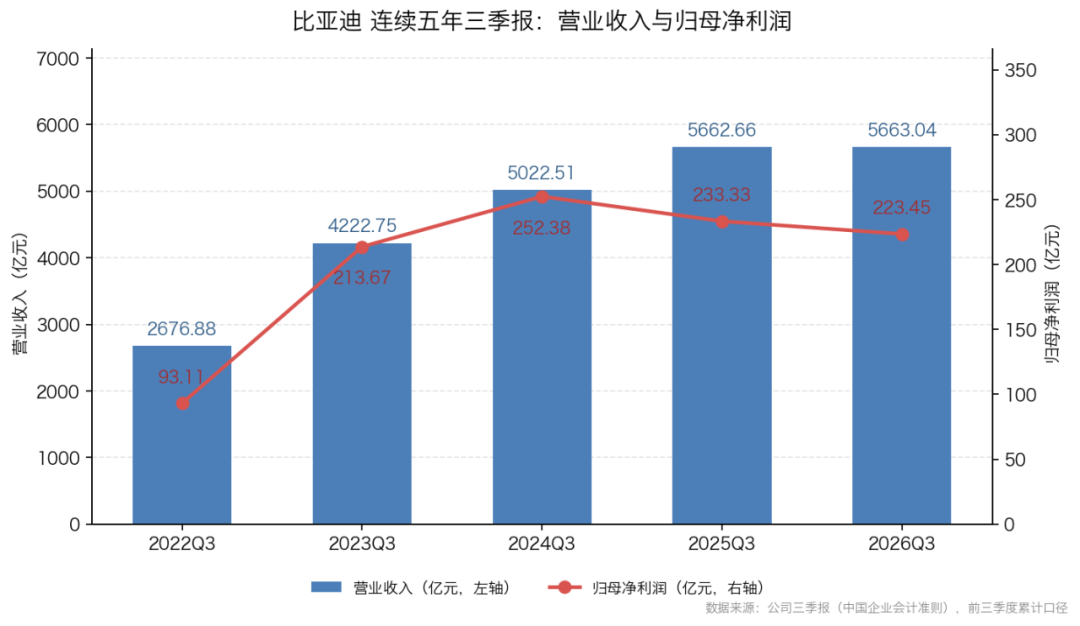
In the first three quarters, BYD's cumulative revenue was 566.304 billion yuan, up only 0.01% year-on-year—essentially flat; net profit attributable to parent was 22.345 billion yuan, down 4.24% year-on-year; net profit attributable to parent excluding non-recurring items was 21.004 billion yuan, up 2.51% year-on-year instead.
Data source: ifind
Flat revenue, a slight decline in attributable net profit, and positive growth in non-recurring net profit together show that the profitability of the core business is recovering.
What is interesting is the quarterly rhythm.
In the first quarter, net profit attributable to parent was only 4.085 billion yuan, halved by 55.38% year-on-year—the deepest pit in this cycle; in the second quarter it jumped to 8.241 billion yuan, up 29.66% year-on-year; in the third quarter it stood at 10.020 billion yuan, up 28.08% year-on-year. Connected across the three quarters, it traces a steep V-shaped curve.
The single-quarter net margin also climbed all the way from 2.72% in the first quarter to 4.52% in the third quarter. With the same batch of factories and the same set of production lines, the net margin differed by nearly two percentage points across the three quarters.
There are three main reasons: first, the recovery in revenue scale diluted fixed costs; second, the share of high-gross-margin overseas business rose; third, domestic competition intensity eased periodically from the second quarter onward.
2. Focus on Financial Expenses
The most easily overlooked—and also most important—figure in the Q3 report is financial expenses: 7.368 billion yuan in the first three quarters, compared with -2.936 billion yuan in the same period last year. One in, one out—a difference of more than 10 billion yuan.
This is not an operating problem but a reversal in the direction of exchange rates. In the same period last year, the RMB/USD trend brought BYD large exchange gains, so financial expenses were negative; this year the fluctuation reversed, and exchange losses were recorded directly in financial expenses.
For an automaker with overseas sales accounting for 40%, the exchange rate exposure in the settlement process every year runs into the tens of billions. Profit figures swinging sharply with the direction of exchange rates are simply the fate of globalized automakers.
A rough estimate shows that the swing in this single item alone swallowed nearly 50% of the year-on-year performance of net profit attributable to parent in the first three quarters. Calculated the other way, if the exchange rate environment had moved in the same direction as last year, attributable net profit in the first three quarters would most likely have grown.
The same story played out with investment income. In the first three quarters, investment income was only 247 million yuan, compared with 2.040 billion yuan in the same period last year—a contraction of 87.88%, mainly from losses on disposal and derecognition of financial assets. Gains from changes in fair value were 1.078 billion yuan, up 93.52% year-on-year, offsetting only a small part of it.
Only by stripping away this layer of disturbance can one see the true temperature of the core business. Net profit excluding non-recurring items in the first three quarters was 21.004 billion yuan, up 2.51% year-on-year—a cleaner measure; in the third quarter alone, non-recurring net profit was 8.630 billion yuan, up 25.25% year-on-year, proving that the profit acceleration did not rely on government subsidies to keep up appearances. Government subsidies included in profit or loss in the third quarter were 825 million yuan, less than 10% of net profit attributable to parent.
3. Gross Margin
After more than two years of price war, BYD's average selling price per vehicle has been declining all the way—an industry consensus. But the Q3 report presents a counterintuitive combination: average price declining, yet gross margin recovering.
In the first three quarters, BYD's operating cost was 461.429 billion yuan, 3.6 billion yuan lower than 465.054 billion yuan in the same period last year, while revenue was basically flat, and gross margin reached 18.52%. Operating cost fell instead of rising.
The reasons are the decline in the price center of upstream raw materials such as lithium carbonate, the continued increase in the self-manufacturing ratio of vertical integration, and the expansion of the sales share of high-gross-margin overseas models.
In the same period, R&D expenses were 36.277 billion yuan, down about 17% from 43.748 billion yuan in the same period last year. The contraction in R&D directly released profit space on the statements. This is a fact—and also the most controversial part of this Q3 report.
One view holds that platformization has entered the harvest period and the marginal output of R&D is declining; another holds that trading R&D for profit is consuming the future for the present.
Cumulative R&D investment has exceeded 280 billion yuan, and the foundation is still there, but the slowdown in the current period's pace is an unavoidable observation point.
For reference, in the same period, the absolute amount of R&D investment by Tesla and Toyota was still rising, and among Chinese automakers, the R&D intensity of NIO and XPeng also remained high. BYD's balance-sheet contraction stands out as distinctive.
Whether gross margin can continue to hold firm in the fourth quarter depends on whether the domestic price war intensifies again and whether the overseas delivery ramp-up proceeds smoothly.

4. Cash Flow Statement
The highest-quality improvement in the Q3 report occurred in the cash flow statement. In the first three quarters, net cash flow from operating activities was 54.470 billion yuan, up 33.36% year-on-year, significantly higher than the 22.345 billion yuan net profit attributable to parent. The cash content of profit is ample.
There are two sources of improvement. First, cash paid for goods purchased and services received fell from 439.108 billion yuan in the same period last year to 409.709 billion yuan, indicating a slower payment pace on the procurement side; second, tax refunds received increased from 13.358 billion yuan to 19.992 billion yuan. Export tax rebates responded directly to the volume increase in overseas sales.
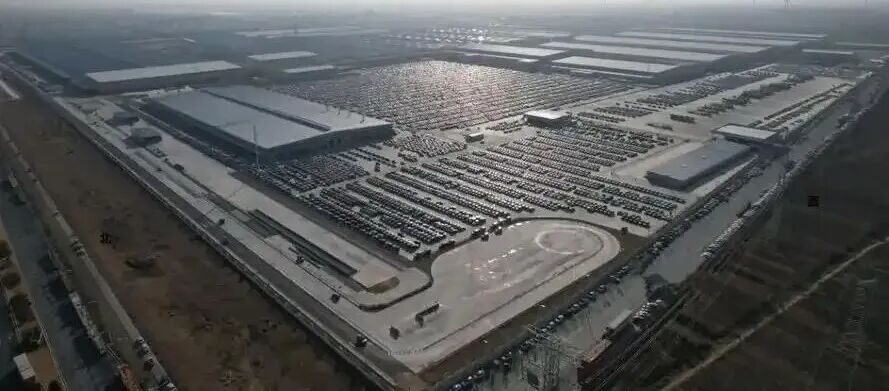
On the investment side, cash paid for the purchase and construction of fixed assets, intangible assets, and other long-term assets was 87.379 billion yuan, 27.5 billion yuan less than 114.933 billion yuan in the same period last year; net cash outflow from investing activities was 68.857 billion yuan, sharply narrowed from 127.571 billion yuan in the same period last year. The peak of domestic capacity construction has passed, and capital expenditure has naturally fallen back.
On the financing side, net cash inflow from financing was 101.663 billion yuan in the same period last year, but became a net outflow of 23.082 billion yuan this year. Last year there was a large inflow from an H-share placement; this year there was no comparable action, and instead debt repayment increased. Short-term borrowings fell from 38.485 billion yuan at the beginning of the year to 18.670 billion yuan, a decrease of 51.49%; meanwhile, bonds payable increased to 14.994 billion yuan, up 200%. Short-term debt was replaced by long-term debt, and the structure is improving.
Subtracting the 87.379 billion yuan paid for the purchase and construction of long-term assets from the 54.470 billion yuan in operating cash flow, free cash flow is roughly -32.9 billion yuan—still negative.
The acceleration in cash generation is real, but completely escaping the black hole of capital expenditure still takes time. From another perspective, the free cash flow gap in the same period last year was about 55.2 billion yuan, and this year it narrowed by 40%. At this rate of convergence, turning free cash flow positive by mid-next year is a milestone worth expecting—and once it turns positive, dividend capacity and buyback space will both open up at the same time.
5. Balance Sheet and Overseas Expansion
In the balance sheet, traces of overseas business expansion are everywhere, and three sets of figures best illustrate the issue.
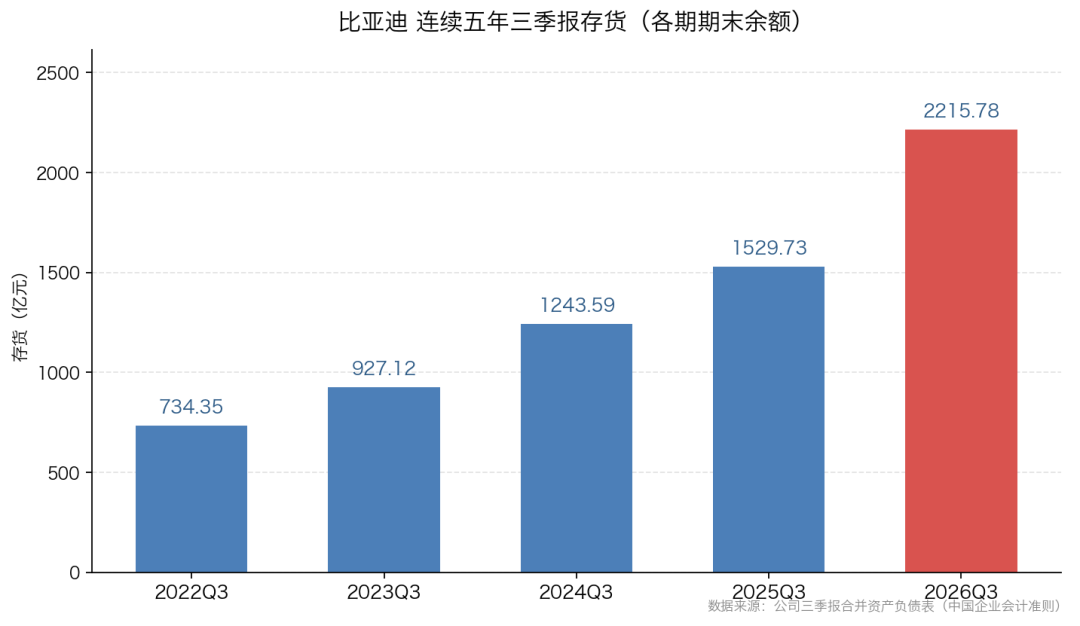
The first group is inventory. At the end of the third quarter, inventory was 221.578 billion yuan, up 60.08% from the beginning of the year. The company attributed this to growth in the overseas automotive business and increased stockpiling. With ro-ro ships going to sea one after another, port yards, goods vehicles in transit, and inventories at overseas knockdown assembly plants are all accumulated in this account. The other side of doubled inventory growth is impairment risk, but fortunately the provision pace in the first three quarters was stable.
Data source: ifind
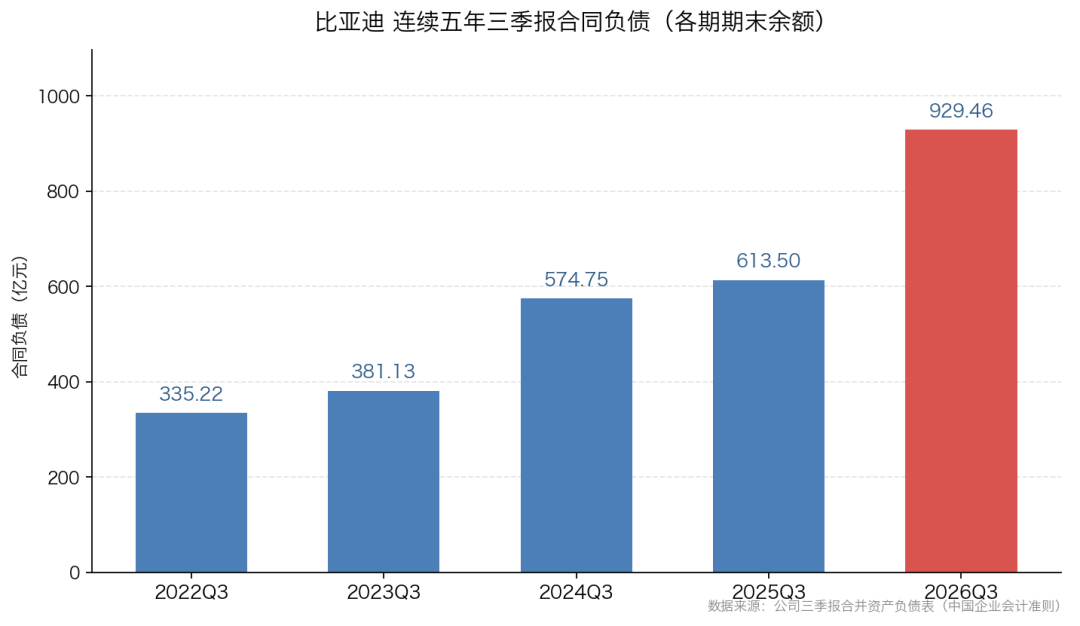
The second group is contract liabilities. At the end of the third quarter, they were 92.946 billion yuan, up 80.58% from the beginning of the year. Contract liabilities are the order pool for which money has been received but revenue has not yet been recognized. This pool expanding by 80% means overseas dealers are highly motivated to make payments and lock in orders, already forming a revenue reservoir for the next one to two quarters.
Data source: ifind
The third group is supply chain settlement. Notes payable were 78.863 billion yuan, surging 251.07% from the beginning of the year; accounts payable were 172.705 billion yuan, somewhat lower than 186.742 billion yuan at the beginning of the year.
Between one rise and one fall, BYD converted more cash payments to suppliers into settlement by notes, and the working capital freed up was precisely an important source of the improvement in operating cash flow.
This approach is a common capital maneuvering method in manufacturing. The more skillfully it is used, the stronger the bargaining power in the industrial chain—but a longer note chain also means risk accumulating in the chain. History has demonstrated the cost of this chain breaking across multiple industries.
At the same time, total assets were 948.941 billion yuan, just one step away from the trillion-yuan scale; the asset-liability ratio was 70.62%, basically flat with 70.75% at the beginning of the year.
-END-
Disclaimer: This article is an analytical study based on the public company attributes of listed companies and the information publicly disclosed by listed companies in accordance with their legal obligations (including but not limited to temporary announcements, periodic reports, and official interactive platforms) as the core basis; Poetry and Starry Sky strives to make the content and views contained in the article fair, but does not guarantee their accuracy, completeness, timeliness, etc.; the information or opinions expressed in this article do not constitute any investment advice, and Poetry and Starry Sky does not assume any responsibility for any actions taken due to the use of this article.
Copyright statement: The content of this article is original by Poetry and Starry Sky and may not be reproduced without authorization.
-
![]()
When Every Company Dons the AI "Hat"
-
![]()
Toy Giant ZURU Moves China HQ to Shenzhen's China Resources Tower with 30,000 sqm Lease
-
![]()
SDD Spec-Driven Development Tutorial — The More Features You Add, the More AI Starts "Making Things Up"
-
![]()
Xpeng MONA's Three Models Overlap in Price Range of 119,800 to 176,800 Yuan, Beginning to Compete with Themselves
-
![]()
Avatr Cancels Launch Event: Carmakers Spend 8.12 Million Yuan on a Grand Show, Yet 87% of New Cars Peak in Their First Month
-
![]()
XPeng Robotaxi Cleared for Full-Area Demonstration Operations in Guangzhou — the Real Test Has Only Just Begun
-
![]()
BYD Enters the Million-Employee Era: The World's Largest Automaker by Headcount
-
![]()
Tesla's Q3 Earnings: Profits Halved, Yet the Stock Rose—Here's Why