In the Era of Stock Competition, Why Quality Competition Must Look at Both "How Well It's Built" and "How Long It Lasts"
 11/02 2026
 379
The Chinese auto market has now entered the stage of stock competition. Complaint data no longer reflects merely isolated problems with a particular model or company, but serves as a concentrated test of product lifecycle quality, service commitments, and intelligentization capabilities. In the first half of 2026, complaints per 10,000 vehicles in operation rose 5.39% year-on-year, quality-related complaints grew significantly, and both service disputes and intelligentization issues are taking new forms. A breakdown of the data reveals that durability quality, supply chain consistency, the gap between advertising and delivery, and OTA experience are becoming new variables shaping owners' experience.
▍Market Background: In the Incremental Era, Look at New Cars; In the Stock Era, Look at Old Cars
Since 2026, owner complaints accepted by Car Quality Network have continued to grow. Looking only at the increase, it is easy to conclude that "quality is declining"; but when the data is broken down, that is not the case. Complaints are rising, and this is also related to the Chinese auto market entering a new stage—where problems appear has changed, what owners care about has changed, and the focus of evaluation should change accordingly.
This year's auto market shows divergence at both ends. At one end is retail contraction: last year's trade-in program brought forward a considerable portion of purchase demand, and this year subsidies have tapered off and the new energy purchase tax has shifted from exemption to halving, leading to a decline in domestic passenger car retail sales, with the traditional "Golden September and Silver October" clearly lacking luster. At the other end is stock expansion: according to Ministry of Public Security statistics, by the end of June 2026 the national vehicle fleet had reached 371 million units, with replacement purchases and additional purchases becoming the mainstream; exports remain high-growth and are expected to reach the ten-million-unit threshold for the full year; new energy vehicles account for more than half of new car sales, and in September even exceeded 60%.
When the main contradiction in the market shifts from "selling them" to "keeping them in use," complaint data becomes one of the best windows for observing user experience—complaints naturally occur "after use." New car sales reflect current heat, while complaint data reflect the overall account of product decisions over the past three to five years.
▍Complaints per 10,000 Vehicles in Operation
Using the formula of complaints ÷ vehicles in operation × 10,000 for complaints per 10,000 vehicles in operation, calculations are based on vehicle fleet data published by the Traffic Management Bureau of the Ministry of Public Security and complaint data received by Car Quality Network:
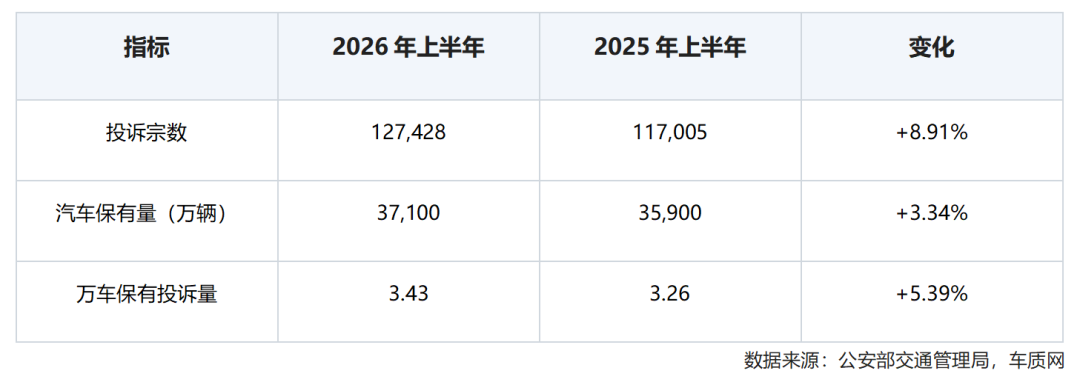
Complaints rose 8.91%, and vehicles in operation rose 3.34%. Offsetting the two, complaints per 10,000 vehicles in operation rose 5.39%. In other words, the increase in complaints this year is about 60% due to a higher probability of complaints per unit of vehicles in operation, and less than 40% due to there being more vehicles. Looking only at this 5.39%, it can be said that the industry as a whole is basically stable. But this 5.39% is the result of four categories of problems offsetting one another.
Complaints are divided into four categories: quality problems point to the product itself, service problems point to channels and processes, other problems are mostly related to recalls and supporting matters, and comprehensive problems are complaints in which two or more categories overlap in the same case.
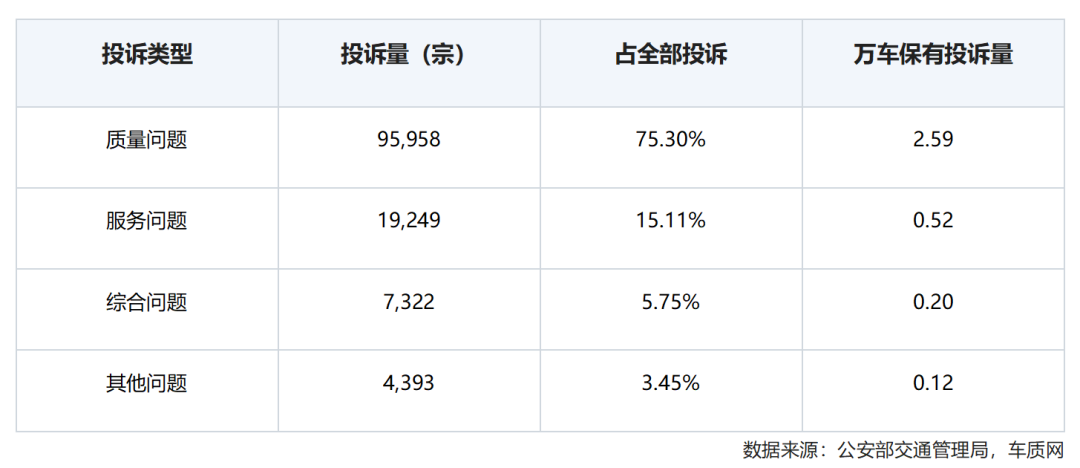
The complaints per 10,000 vehicles in operation for quality problems are five times those for service problems and more than twenty times those for other problems; comprehensive problems are only 0.20, meaning that among 50,000 vehicles, there is only one complaint in half a year of "quality and service problems occurring together." Adding trend data, the directions of the four categories are not consistent.
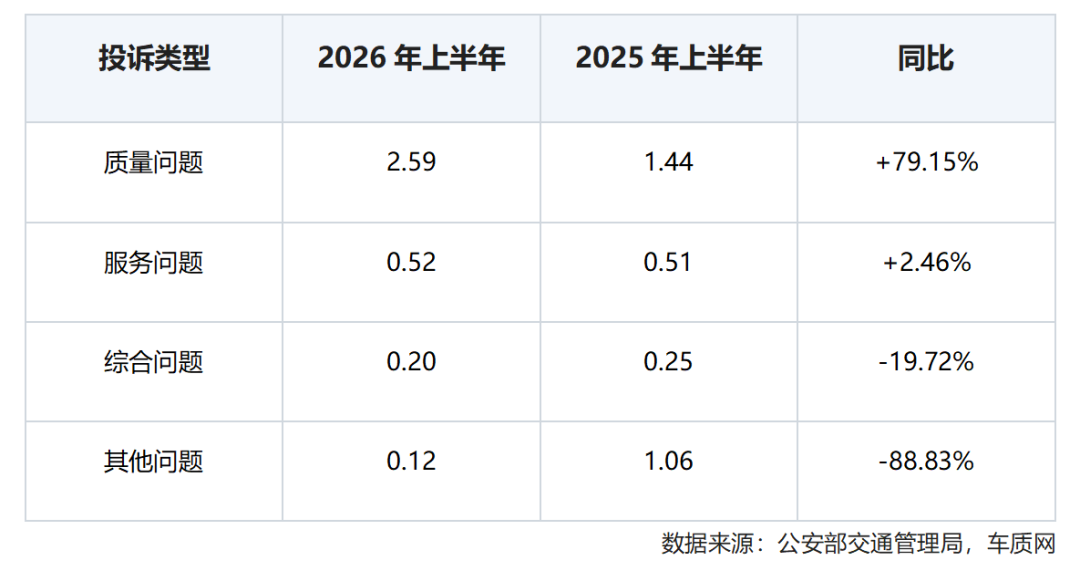
Complaints per 10,000 vehicles in operation for quality problems rose from 1.44 to 2.59, up 79.15%, making it the only one of the four categories to rise rapidly.
Complaints per 10,000 vehicles in operation for service problems rose slightly from 0.51 to 0.52, up 2.46%; during the same period, quality-related complaints rose nearly 80%, while service-related complaints remained flat—maintaining parity against the backdrop of a 3.3% increase in vehicles in operation and a rising average vehicle age shows that the carrying capacity of channels and after-sales systems has not been diluted. But it should not be described as "service is improving": it simply has not declined in sync. In addition, service complaints are more closely related to current sales and delivery pace than to vehicles in operation, and this item needs to be considered. Therefore, the overall 5.39% rise in complaints per 10,000 vehicles in operation is a structural increase.
Look at another dimension. Using the fleet structure as the denominator, new energy vehicles account for 13.2% of the total vehicle population but 32.6% of complaints in the first half of the year, for a relative ratio of 2.5; fuel vehicles account for 86.8% of the fleet and 67.1% of complaints, for a relative ratio of 0.8.
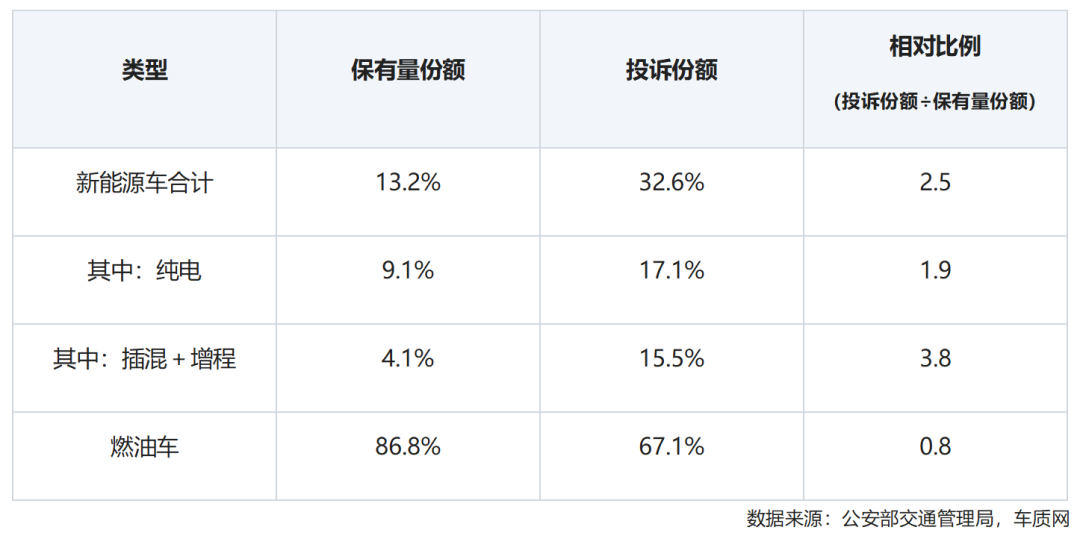
Because new energy vehicles have a lower average vehicle age, a dense concentration of new models, and owners who are more accustomed to actively speaking out, it is impossible to directly determine the complaint difference between new energy vehicles and gasoline vehicles. However, the relative ratio of 3.8 for plug-in hybrids and extended-range vehicles versus only 1.9 for battery electric vehicles shows that the internal gap is more likely to stem from product complexity—two powertrain systems stacked together create a broader failure surface. In addition, the average vehicle age of new energy vehicles is still climbing, durability problems have not yet emerged in concentrated form, and the relative intensity is already higher than that of fuel vehicles; in the next two to three years, complaint pressure may rise in steps.
▍Complaints Are "Getting Older," and the Main Track of Quality Competition Is Shifting Backward
The most notable change in the complaint structure in this period (as of September 2026) is that the center of gravity of complaints has shifted overall: the share of complaints within one year of purchase has dropped significantly, while the shares of complaints for vehicles more than three years old and with more than 60,000 kilometers traveled have both risen; quality problems as a share of all complaints have risen from 40% to more than 70%. This is not random fluctuation, but a structural replacement.
The most typical case is tire cracking. This single problem point increased from more than 1,000 to nearly 30,000 in one year. Along the same direction are typical time-sensitive problems such as body rust, paint blistering and cracking, and air conditioning failures—they do not erupt at delivery, but appear in concentrated form after two or three years of use and tens of thousands of kilometers.
This shows that quality competition cannot look only at "how well it is built" at delivery, but also at "how long it lasts" after use. In the past, the industry concentrated quality resources heavily on line-end qualification rates and early delivery failure rates. That system was effective in the incremental era because most problems would be exposed and quickly absorbed during the warranty period. But as the fleet ages and average vehicle age rises, the indicators that truly determine reputation are shifting backward—durability performance at two years, three years, and five years. This creates a real tension: durability validation takes time, while the current development pace has been compressed to eighteen to twenty-four months, and the industry has not yet found a balance between validation cycles and development speed.
There is also a structural factor that is easily overlooked: a considerable portion of the vehicles now showing concentrated durability problems were produced during the period of the most intense price war in recent years—when whole-vehicle cost-reduction pressure was greatest and material selection and purchased-part price cuts were most intensive, and they are now successively entering the interval where durability problems emerge in concentrated form.
Problems such as tire cracking, which have batch-clustering characteristics, point not to the level of whole-vehicle assembly, but to the supply chain. Assembly quality is actually improving, but consistency fluctuation in a single purchased part is enough to drag down a brand's quality reputation for an entire year. This is precisely the deeper meaning of "anti-involution" governance: payment term commitments and not passing costs on to suppliers appear on the surface to be industrial chain ecosystem issues, but when it comes to quality, preserving reasonable profits and stability in the supply chain means preserving the durability quality of the whole vehicle.
▍Service Disputes Have Shifted from "Money" to "Words"
The total volume of service-side complaints is basically flat, but the internal structure is switching tracks. On one side, deposit disputes and price changes have fallen sharply—the main emotional source of complaints in 2025 was "price cuts right after purchase, model changes right after delivery"; this year the price system has become more stable and the iteration pace has slowed. This is first of all good news: it shows that the industry's efforts to govern price wars and curb disorderly competition are visible in complaint data.
But disputes have not disappeared; they have only changed form. On the other side, "inconsistent with advertising" more than doubled, "failure to deliver on schedule" doubled, and system upgrade problems remained the top service category for consecutive periods. In the past, complaints asked "how is the money calculated," with contract terms to follow and a refund enough to settle the matter; now complaints ask "how were the words phrased"—configuration advertising inconsistent with actual delivery, intelligent driving function descriptions exceeding capability boundaries, and promised delivery cycles repeatedly pushed back. Such disputes have no clear boundary of right and wrong; the resolution action is not difficult, but the loss of trust is great and irreversible.
▍Intelligentization Is Becoming the "New Front Line" of Complaints
Intelligentization was once seen as a bonus item, but has now entered the main battlefield of complaints. It is worth noting that intelligentization complaints do not appear only in the service category. Among quality problem points, infotainment, connectivity, and driver assistance have long formed an independent block—they used to be grouped under the broad category of "body accessories and electrical appliances," but their weight can no longer be summarized as "minor electrical appliance issues."
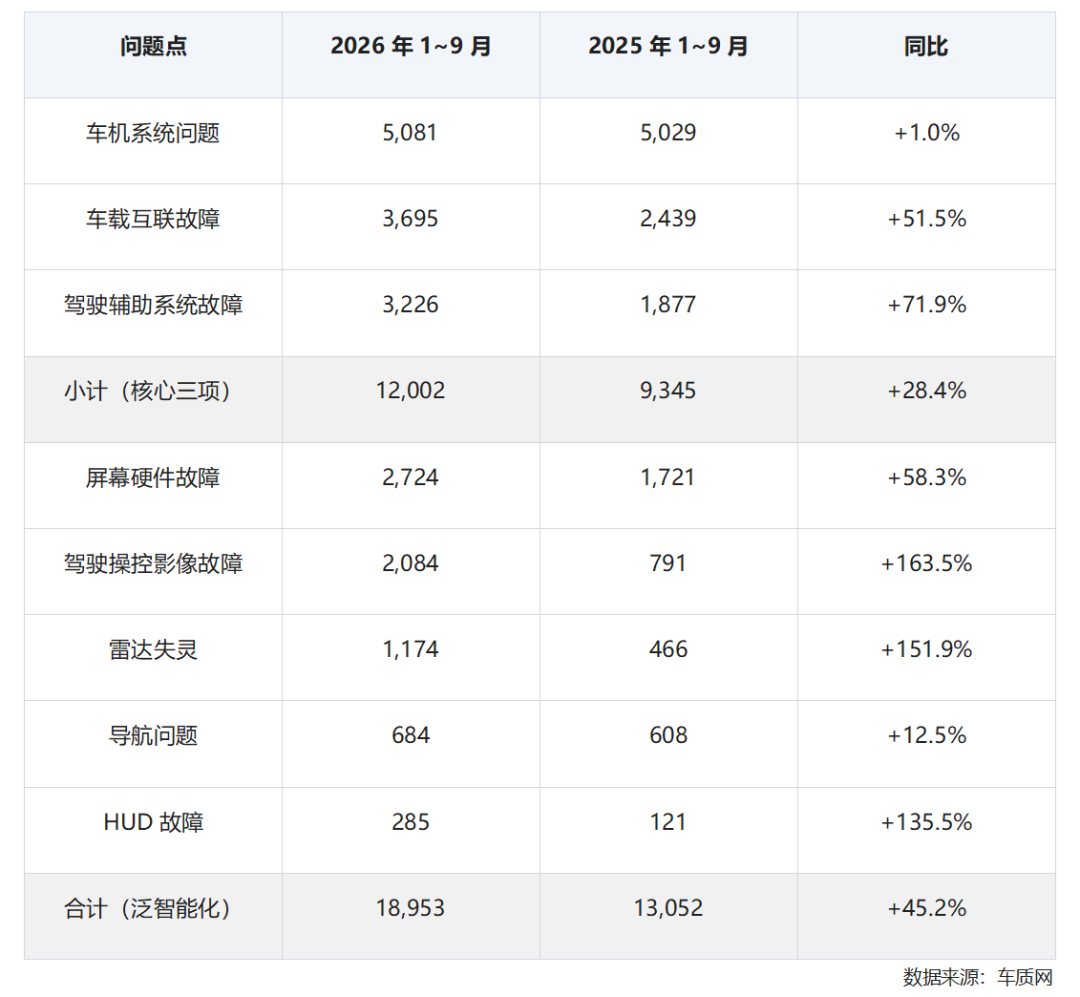
Three characteristics deserve attention. The first is volume: the three core items total 12,000 problem points, accounting for 6.2% of quality-related problem points; including screens, imaging, radar, navigation, and HUD, the total is close to 19,000, or 9.8%, already exceeding long-standing chronic issues such as instrument panel cracking (4,071, 2.1%) and power battery failures (4,698, 2.4%). The second is speed: the three core items rose 28.4%, basically in sync with the overall growth rate of quality excluding tire cracking (26.2%); broad intelligentization rose 45.2%, in sync with the overall quality growth of 45.7%. The third is nature: tire cracking is "it breaks only after long use," while intelligentization problems are "discovered only when used," and the two tracks rose simultaneously in the same year, showing that today's quality pressure comes from two important sources, one in materials and the supply chain, and one in software and electronic and electrical architecture.
Specifically, infotainment system problems represented by lag and crashes were basically flat in complaint volume (5,081 vs. 5,029, up only 1.0%). Against the backdrop of more and more vehicles equipped with large screens, this is a clearly positive signal, showing that manufacturers' improvements to basic system functions have been implemented. At the same time, however, complaints about specific functions such as in-vehicle connectivity failures, driver assistance system failures, imaging, radar, and navigation all increased considerably year-on-year, and manufacturers will need to continue polishing quality across the functions users actually use.
In addition, the service side echoes intelligentization: system upgrade problems remained the top service category, with 8,077 cases, down 5.9% year-on-year; "inconsistent with advertising" reached 6,252 cases, up 147.1%; "failure to deliver on schedule" rose 110.4%. The quality side and the service side are the same thread—the more complex the functions and the more delivery depends on software, the more disputes shift from "whether the thing is broken" to "whether it was clearly stated and whether it can be fulfilled."
Behind this lie three structural contradictions. The first is the "time gap in function delivery": pre-installing hardware, unlocking software features post-payment, and futures-style functions have become common practice—capabilities promised at the point of delivery arriving later than the delivery itself—while contracts and advertising often lack clear provisions on "when they will arrive and to what extent." The second is that OTA has turned one-time delivery into continuous delivery: there is still no unified industry standard for recovery mechanisms after failed upgrades, notification of function changes post-upgrade, and support years for older models, and a single failed upgrade can render a vehicle temporarily unusable. The third is the boundary of advertising: descriptions of intelligent driving capabilities have long outpaced both regulations and real capabilities. The industry has explicitly required that the term "autonomous driving" not be used, yet vague expressions such as "high-level intelligent driving" and "L2+" still leave room for interpretation, and the gap between consumers' imagination of these capabilities and the vehicle's actual boundaries remains the most persistent source of intelligentization complaints.
At the same time, the positive side should also be acknowledged: infotainment system problems were basically flat and system upgrade problems fell year-on-year, indicating that the quality of the infotainment unit itself and OTA services is stabilizing; a number of companies have established processes for gray release, failure rollback, and pre-upgrade notification; after regulators clarified advertising standards, "writing capability boundaries into the manual" is becoming a consensus. Competition in intelligentization has shifted from "how many functions" to "certainty of experience," and the core indicators for the next stage are not the number of functions, but the fulfillment rate of promises and usability after upgrades.
▍Complaint response and handling results
Manufacturer response rates have remained above 96% for two consecutive years, close to full marks, essentially achieving "a response to every case." At the same time, most manufacturers respond within 24 hours, giving owners' claims a stable acceptance channel and quick response. But at the same time, vigilance is needed against "responding for the sake of responding"—treating "received" as case closure and response speed as quality resolution. Response rate should shift from a pursuit target of "the higher the better" to a gatekeeping indicator of "holding the bottom line."
At the same time, the complaint resolution loop is improving. The proportion of owners self-assessing cases as "resolved" rose compared with the same period last year, and more than 80% of resolved cases were handled through free repair or replacement—with costs borne by manufacturers rather than passed on to owners. "Repair what should be repaired, replace what should be replaced" has become the mainstream handling method.
Satisfaction ratings are heavily concentrated at the "average" level, with both extremes very thin, and the indicator has lost its sharpness. The reason may lie in evaluation dimensions being too general—owners can only give a broad score for the "whole process"—and may also be related to manufacturers' problem-solving approach: manufacturers only resolved the problem itself and did not provide emotional value or additional value, so the negative emotions generated by complaints were only "leveled out" rather than "reversed."
From "solving problems" to "rebuilding trust" is a lesson the industry needs to make up next.
-
![]()
AI Cannot Cure the CEO's Serious Illness
-
![]()
In the Era of Stock Competition, Why Quality Competition Must Look at Both "How Well It's Built" and "How Long It Lasts"
-
![]()
Kuaishou: The Perennial Runner-Up — Can Kling AI Become Its Second Growth Curve?
-
![]()
Over 6,000 Yuan Profit per Car—Is Geely's Per-Vehicle Profit Inflated?
-
![]()
Kling 4.0 Hands-On Test: Creating an Exhibition Walkthrough Video with Zero On-Camera Talent — How Far Is AI from Delivering a "One-Stop Finished Video"?
-
![]()
AI Code Refactoring in Practice: Assess First, Then Tackle Technical Debt
-
![]()
Fold 5 Times and It Leaks — ¥8,000 Repair Bill: Who Set Up Apple's Foldable Screen Scam?
-
![]()
Xiaomi Spends 1.7 Billion Yuan to De-CATL-ize: Is Lei Jun Content to Be a "Worker" for the Ning King?