TSMC: The 'Undisputed Leader' of the AI Industry—Who Can Challenge Its Dominance?
 04/17 2026
 466
466
TSMC (Taiwan Semiconductor Manufacturing Company) released its first-quarter 2026 financial report (covering the period ending March 2026) before the U.S. stock market opened on the afternoon of April 16, 2026 (Beijing Time). The key highlights are as follows:
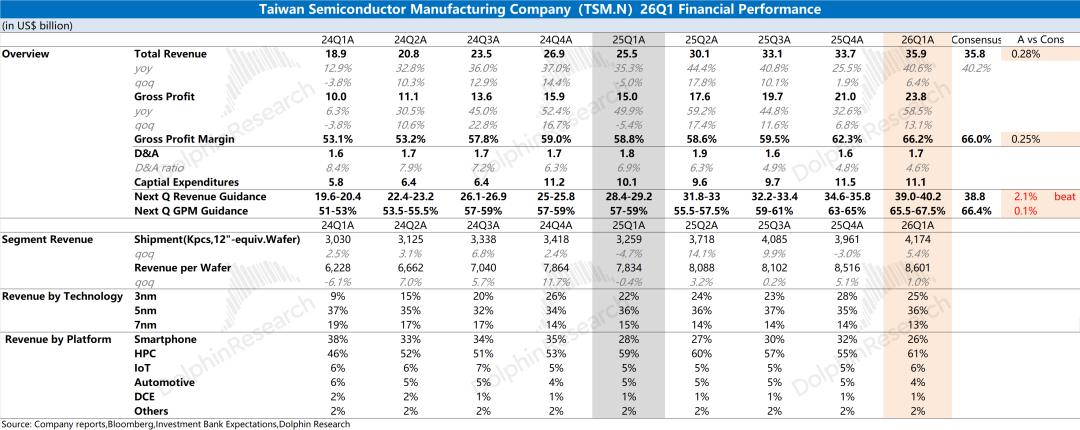
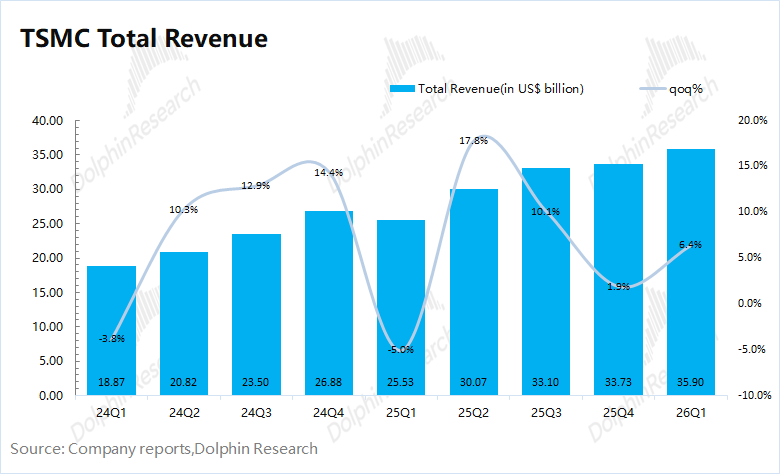
1. Revenue Performance: TSMC reported quarterly revenue of $35.9 billion, marking a 6.4% sequential increase, primarily fueled by surging demand for AI chips. Customers' AI chips have begun transitioning to the cutting-edge 3nm process platform. Despite the impact of the U.S. dollar's appreciation against the New Taiwan dollar (NTD) this quarter, revenue still surpassed the upper limit of the guidance range ($34.6–35.8 billion). In NTD terms, revenue grew by 8.4% sequentially, significantly outperforming the 6% sequential growth forecast.
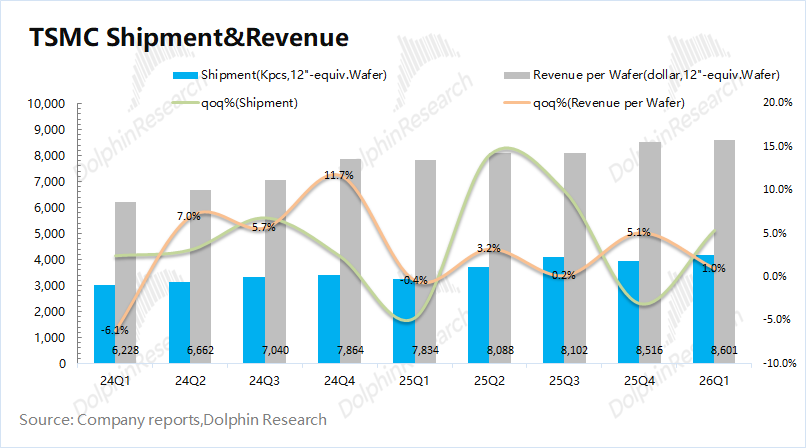
From a volume-price perspective (based on 12-inch wafer equivalents): (1) TSMC shipped 4,174 thousand wafers, up 5.4% sequentially; (2) Revenue per wafer (12-inch equivalent) reached $8,601, a 1% sequential increase.
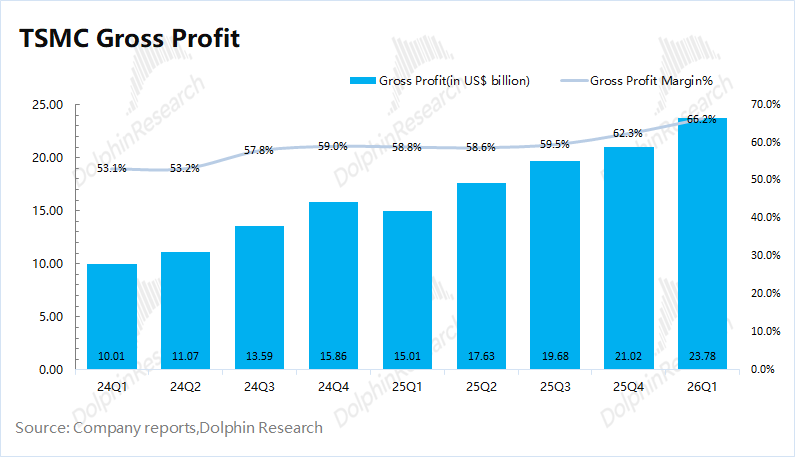
2. Gross Margin: The company achieved a gross margin of 66.2% this quarter, exceeding the guidance range of 63–65%. This improvement was driven by higher average selling prices (ASPs) and lower unit costs, as economies of scale diluted fixed costs per unit.
Buoyed by AI demand, TSMC's gross margin has stabilized above 60%. The company previously raised its long-term gross margin target (over five years) from 53% to 56%.
3. Business Progress by Segment: Process Nodes, Downstream Applications, and Regional Performance
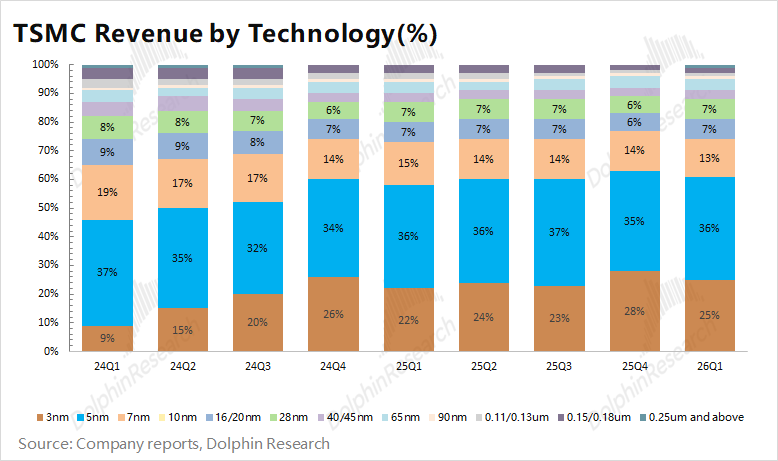
a. Process Node Advancements: TSMC maintained a 74% share of revenue from advanced process nodes (below 7nm) this quarter. Driven by AI demand, its 3nm and 5nm capacities are fully utilized, generating 25% and 36% of revenue, respectively. With 2nm production ramping up, AI chips are expected to transition from 5nm to 3nm, further shifting TSMC's revenue mix toward advanced nodes.
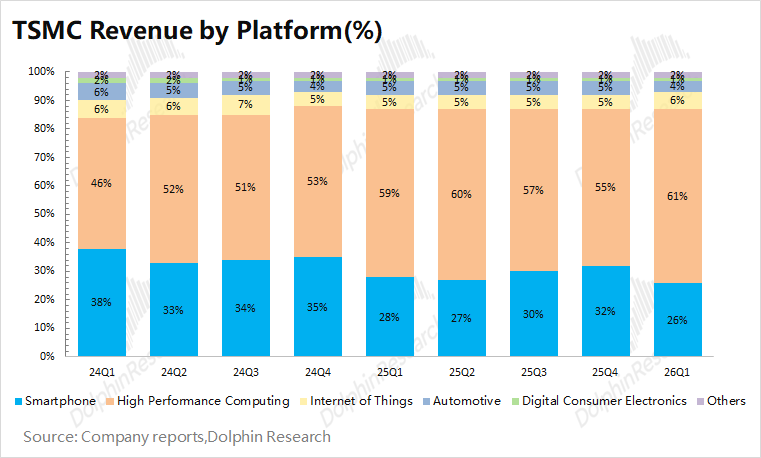
b. Downstream Applications: The sequential revenue increase was primarily driven by AI chip demand, while the smartphone business experienced a seasonal decline. High-performance computing (HPC) remained the largest revenue contributor, reaching $21.9 billion (61% of total revenue), fueled by demand for AI chips from NVIDIA, Broadcom, and others.
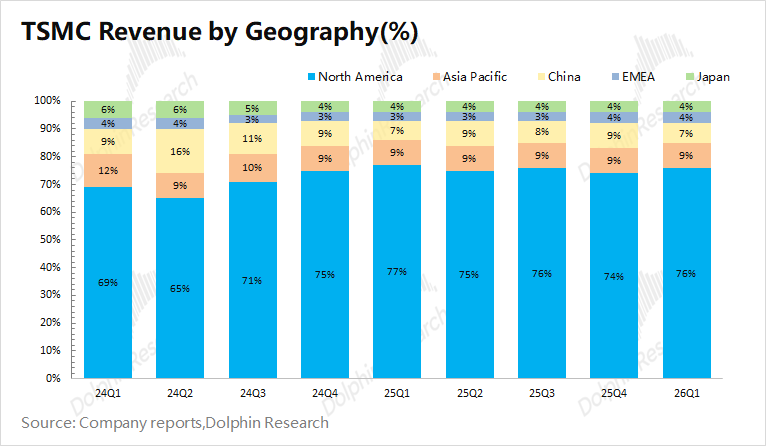
c. Regional Revenue Breakdown: North America remained TSMC's largest revenue source, accounting for 76% of quarterly revenue, with key clients including NVIDIA, Apple, and AMD. Revenue from Mainland China reached approximately $2.5 billion (7% of total), ranking as the company's third-largest market.
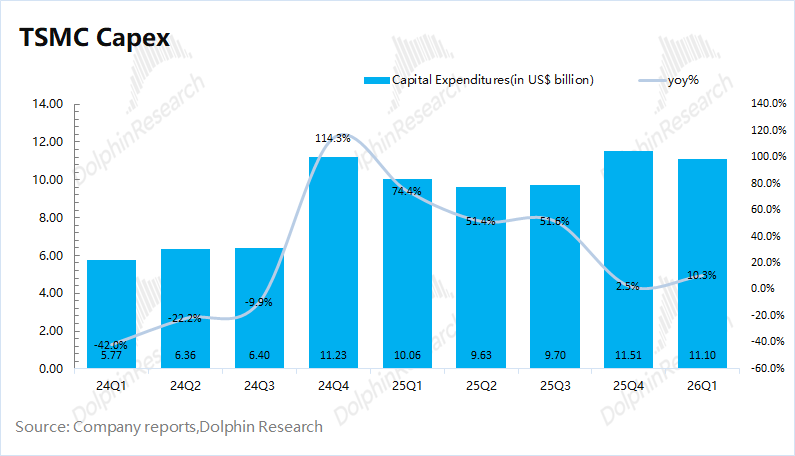
4. Capital Expenditures: TSMC's capital expenditures for the quarter totaled $11.1 billion. With the company raising its full-year 2026 capex guidance to the upper end of the $52–56 billion range, expenditures for the remaining three quarters are expected to reach approximately $44 billion, indicating a concentration of investments in the second half of the year.
5. Business Outlook: TSMC forecasts second-quarter 2026 revenue of $39–40.2 billion (surpassing raised market expectations of $38.8 billion) and a gross margin of 65.5–67.5% (aligning closely with raised expectations of 66–66.5%).
Dolphin Research's Perspective: Full-Year Guidance Raised, Industrial Chain Dominance Intact
TSMC delivered a robust financial performance, with revenue growth largely reflected in monthly operating data. Despite the USD's appreciation against the NTD, reported revenue of $35.9 billion exceeded the upper limit of guidance ($35.8 billion). In NTD terms, sequential revenue growth of 8.4% underscores stronger-than-expected performance.
Key takeaways from this report include gross margin trends, capital expenditures, and future business guidance:
① Gross Margin: TSMC's gross margin reached 66.2% this quarter, meeting raised market expectations (66–66.5%), driven by higher ASPs and lower unit costs (economies of scale). The company raised its next-quarter gross margin guidance to 65.5–67.5%, largely in line with expectations, as AI chips transition to the 3nm platform, positively impacting average product prices and margins.
② Capital Expenditures: With $11.1 billion spent this quarter and full-year capex raised to the upper end of the $52–56 billion range, TSMC's remaining three quarters are expected to see approximately $44 billion in investments, primarily concentrated in the second half of the year (averaging $14.5–15 billion per quarter). This aligns with ASML's guidance of "lower first-half, higher second-half" expenditures.
③ Business Guidance: TSMC raised its 2026 revenue growth target to "over 30%" (up from "around 30%"), demonstrating confidence while meeting mainstream market expectations.
Beyond Financials: Market Focus Areas
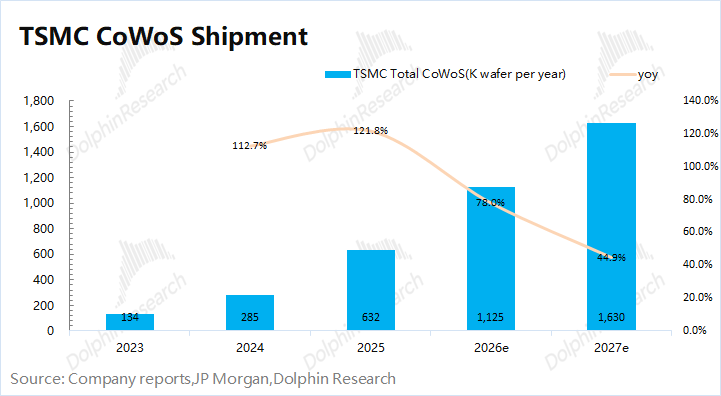
a) CoWoS Capacity: Mainstream AI chips (NVIDIA, AMD, and Google TPUs) rely on TSMC's CoWoS packaging, with over 90% of global CoWoS capacity sourced from TSMC. Capacity allocation directly impacts AI chip shipments, making TSMC a critical bottleneck in the AI supply chain. Industry data suggests TSMC's monthly CoWoS capacity will expand from ~80,000 wafers to ~120,000 wafers by the end of 2026. Dolphin Research estimates CoWoS shipments could exceed 1.1 million wafers in 2026 (up 77% YoY), with NVIDIA and Broadcom as primary customers.
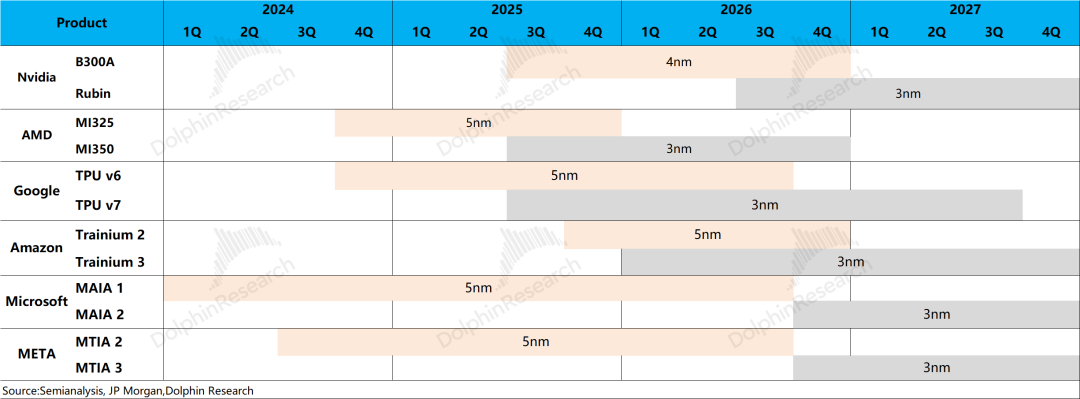
b) 2nm Progress and Process Node Migration: TSMC's 2nm process will enter mass production in 2026, with smartphone chip demand from Apple and Qualcomm migrating to this platform. Meanwhile, AI chips have fully upgraded to 3nm, with products like Rubin, MI350, and Google TPU v7 adopting TSMC's 3nm technology. This shift to advanced nodes will drive up average product prices and capital expenditures.
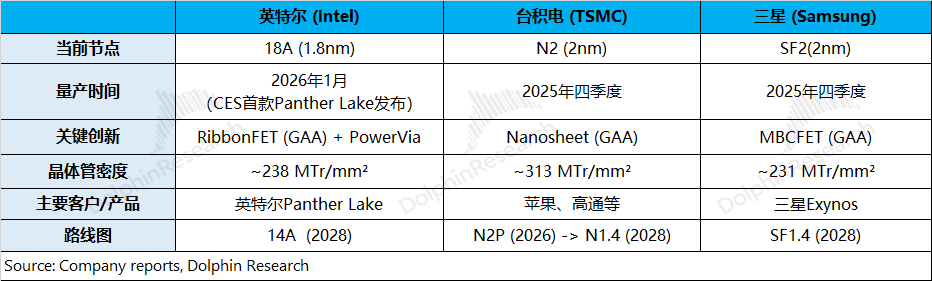
c) Foundry Market Competition: Following TSMC's 2nm mass production, Samsung and Intel will introduce SF2 (2nm) and 18A (1.8nm) nodes, respectively. However, significant gaps remain: (1) Samsung and Intel's latest node transistor densities lag below 250 MTr/mm², trailing TSMC's previous-generation N3P (294 MTr/mm²); (2) Intel and Samsung suffer from lower yields, primarily serving in-house chips, while TSMC caters to a broad external customer base. Given tight AI chip supply, improved yields at Intel and Samsung could secure "overflow orders," especially as TSMC faces capacity constraints. Google and Intel recently expanded cooperation to alleviate bottlenecks.
At TSMC's current market capitalization of $1.9 trillion, its valuation roughly corresponds to a 2026 net profit multiple of ~24x P/E (assuming +38% YoY revenue growth, 64.7% gross margin, and a 16.5% tax rate).
Final Assessment
TSMC delivered a solid, albeit not "explosive," performance. Mainstream institutions had already raised gross margin expectations to ~66%, which the company met. Notably, quarterly guidance exceeded raised market expectations, though the full-year revenue forecast weakened the impact of next quarter's results.
The company's raised 2026 revenue growth target to "over 30%" (from "around 30%") aligns with institutional expectations, reflecting TSMC's consistently cautious guidance style. While TSMC continues to achieve record revenues, its ability to sustain gross margins near 66% underscores its industrial chain dominance. In AI chip manufacturing, TSMC holds a clear advantage with its CoWoS technology, capturing nearly all current demand.
Given supply-side constraints, downstream manufacturers are exploring alternatives, such as Google's increased cooperation with Intel. However, until Intel and Samsung achieve technological and yield breakthroughs, TSMC's CoWoS remains the market's only viable option. Regardless of downstream dynamics, TSMC remains the most stable link in the AI chip supply chain.
Detailed Analysis:
1. Revenue Drivers: Volume and Pricing Growth
TSMC's Q1 2026 revenue of $35.9 billion surpassed guidance ($34.6–35.8 billion), driven by 6.4% sequential growth in AI chip demand and a gradual transition from 5nm to 3nm platforms. The USD's appreciation against the NTD diluted growth, but NTD-denominated revenue grew 8.4% sequentially, indicating stronger performance.
Monthly operating metrics had already signaled this revenue trend. How did pricing and shipments contribute?
Dolphin Research analyzes the key drivers:
1) Volume: TSMC shipped 4,174 thousand wafers in Q1 2026, up 5.4% sequentially. The company raised its 2026 capex target to the upper end of the $52–56 billion range (an annual increase of $13–15 billion), signaling ongoing capacity expansion.
2) Price: Revenue per wafer (12-inch equivalent) reached $8,601 in Q1 2026, up 1% sequentially. With 2nm production ramping up and AI chips transitioning to 3nm, TSMC's product mix will shift further toward advanced nodes, driving up average prices.
2. Gross Profit and Margin: Sustained Improvement, Breaching 66%
TSMC's Q1 2026 gross profit reached $23.8 billion, up 13% sequentially, with a gross margin of 66.2% (up 3.9 percentage points sequentially), meeting raised market expectations (66–66.5%). This was driven by higher ASPs and lower unit costs.
Revenue and gross margin are TSMC's most closely watched metrics. While monthly operating data largely anticipated revenue, gross margin was a focal point. Dolphin Research breaks down the drivers:
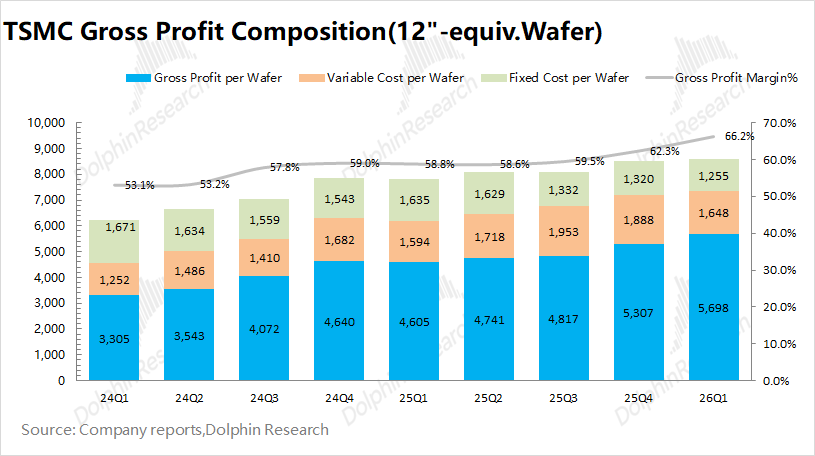
"Gross Profit = Revenue per Wafer – Fixed Costs – Variable Costs"
1) Revenue per Wafer (12-inch equivalent): TSMC's revenue per wafer reached ~$8,601 this quarter, up $85 sequentially. Typically, Q1 sees seasonal declines in average prices due to reduced smartphone chip shipments. However, the AI chip transition to 3nm drove an "anti-seasonal" price increase.
2) Fixed Costs (Depreciation/Amortization): Average fixed costs per wafer fell to ~$1,255 (down $65 sequentially). While NTD-denominated depreciation rose sequentially, USD-denominated costs remained stable due to currency effects. Increased shipments diluted unit fixed costs.
3) Variable Costs: Average variable costs per wafer dropped to ~$1,648 (down $240 sequentially), influenced by seasonal declines in manufacturing expenses.
Based on this breakdown, TSMC's gross profit per wafer reached $5,698 (up $390 sequentially), driven by both higher prices and lower unit costs.
III. Wafer Revenue Mix: AI Chips Drive 3nm Adoption, Smoothing Seasonal Volatility
3.1 Revenue Share by Application
High-performance computing (HPC) remained TSMC's largest revenue segment, accounting for 61% of Q1 2026 revenue. Fueled by AI chips like NVIDIA's GB series, HPC revenue reached ~$21.9 billion (up 18% sequentially), driven by increased shipments of NVIDIA's Blackwell chips and Broadcom's TPUs.
The mobile business saw a seasonal decline, with revenue of $9.33 billion (down 13% sequentially). Combined, mobile and HPC accounted for 87% of revenue, representing TSMC's core downstream markets.
3.2 Revenue Share by Process Node
Revenue from processes below 7nm remained at 74% this quarter, with advanced nodes driving core growth. Specifically, 3nm accounted for 25% of revenue, while 5nm maintained a 36% share.
Typically, TSMC witnesses indicators of a 'seasonal downturn' during the first quarter, mainly attributable to the fact that its most cutting-edge processes (such as the 3nm technology) are predominantly supplied to mobile clients. Following the 'peak Q4 shipment period' for mobile and allied products, there is a notable sequential decline in revenue during Q1.
Presently, the company is transitioning AI chips from the 5nm to the 3nm platform, a move that effectively mitigates the impact of 'seasonal volatility' and paves the way for sequential revenue growth in Q1.
As the company progresses in shifting 3nm mobile chips and other products to the 2nm platform, AI chips (including Rubin, TPU, etc.) will gradually make the transition to the 3nm platform. This strategic shift in the company's process structure towards more advanced nodes is poised to not only elevate the average selling price of its products but also fortify its competitive edge over rivals.
3.3 Wafer Revenue Share (Breakdown by Region)
In terms of revenue distribution across regions, North America continues to be TSMC's primary revenue generator, contributing 76% of the total revenue. This is largely due to the presence of major clients like Apple, NVIDIA, AMD, and Qualcomm in the region, fostering robust commercial relationships between TSMC and the United States.
Beyond North America, the Asia-Pacific region and Mainland China emerge as the other two significant revenue contributors, accounting for 9% and 7% of the revenue this quarter, respectively. Revenue from Mainland China remained steady at around $2.5 billion this quarter, maintaining its position as one of the company's top three revenue streams, albeit with its share in TSMC's total revenue dipping below 10%.
- END -
// Republication Authorization
This article is an original creation by Dolphin Research. Any republication necessitates prior authorization.
// Disclaimer and General Information
This report is intended solely for general reference, catering to users of Dolphin Research and its affiliated entities for general browsing and data consultation. It does not consider the specific investment goals, product preferences, risk tolerance, financial standing, or unique needs of any individual recipient. Investors are advised to consult with independent professional advisors before making investment decisions based on this report. Any individual making investment decisions utilizing or referring to the content or information in this report does so at their own risk. Dolphin Research disclaims any direct or indirect liability or loss that may arise from the utilization of the data contained in this report. The information and data herein are sourced from publicly available materials and are for reference only. Dolphin Research endeavors to ensure, but does not guarantee, the reliability, accuracy, or completeness of the information and data.
The information or opinions presented in this report shall not, under any circumstances, be interpreted or deemed as an offer to sell securities or an invitation to buy or sell securities, nor shall they constitute advice, solicitations, or recommendations regarding securities or related financial instruments. The information, tools, and materials in this report are not intended for distribution to, or use by, any person or entity in any jurisdiction where such distribution, publication, availability, or use would contravene applicable laws or regulations or would subject Dolphin Research and/or its affiliates or subsidiaries to any registration or licensing requirements in such jurisdiction.
This report solely reflects the personal views, insights, and analytical approaches of the relevant contributors and does not represent the stance of Dolphin Research and/or its affiliated institutions.
This report is produced by Dolphin Research, and all copyrights are reserved by Dolphin Research. Without prior written consent from Dolphin Research, no institution or individual may (i) reproduce, copy, duplicate, reprint, forward, or create any form of copies or reproductions in any manner, and/or (ii) directly or indirectly redistribute or transfer them to any unauthorized individuals. Dolphin Research reserves all associated rights.
-
How Meituan is Becoming the 'Interface' for AI Integration into the Physical World
-
![]()
RoboScience Machine Science Makes ICRA Best Paper List for Two Years Running with Its 'Embodied Brain' Innovation
-
![]()
Focusing on UTG Ultra-Thin Flexible Glass! CSG Optical New Material Production Base Establishes in Xianning, Hubei
-
![]()
AI Meets Optics: Tsinghua Smart Vision Secures A+ Round Funding Led by Hillhouse Capital
-
![]()
Why are 3C Brands Flocking to Douyin Mall During 618?
-
![]()
Token Economy Falters as Economic Tokenization Faces Challenges
-
![]()
Lenovo's Monthly Surge of 109%, Foxconn Industrial Internet's Market Cap Surpasses Kweichow Moutai: A Collective Resurgence of the 'IT Old Guard'?
-
![]()
After Zhang Xue's Victory, Where is Motorcycle Intelligence Headed?