Tesla: Over-promising on 'Futuristic' Plans, Delayed Execution - Can the Auto Business Hold the Fort?
 10/22 2026
 349
Tesla (TSLA.O) released its Q3 2026 earnings after the U.S. market closed on the morning of October 22 (Beijing Time). The overall performance was decent, with the following key highlights:
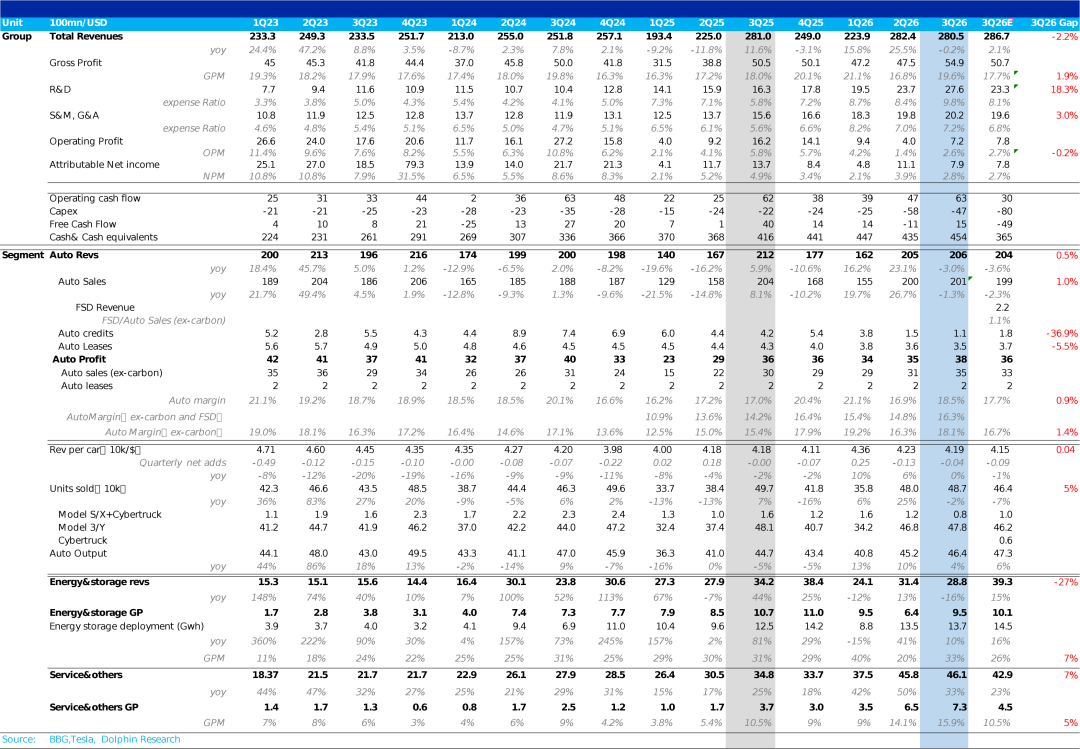
① Total revenue slightly below expectations: Q3 total revenue reached $28.05 billion, down 0.2% YoY and slightly below the expected $28.7 billion. Core vehicle revenue performed well, but energy storage revenue came in at only $2.88 billion, with both deployment volume and unit price below expectations.
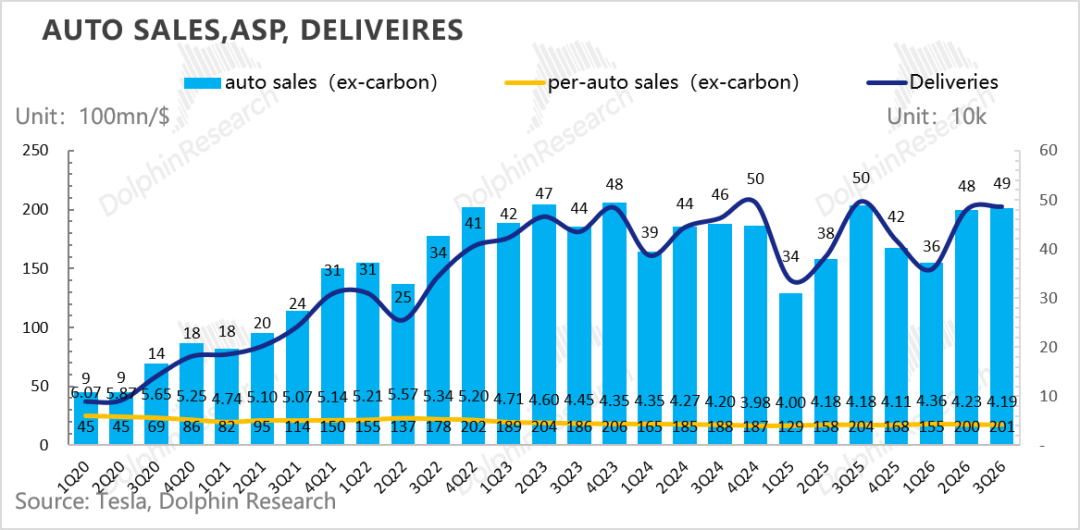
② Vehicle revenue exceeds expectations, with a slight decline in average selling price (ASP): Core vehicle revenue reached $20.1 billion (vs. expected $19.9 billion). ASP Month on month decline (quarter-on-quarter decline) by approximately $370 to $41,300, mainly due to price cuts in China, end-of-quarter promotions, continued interest subsidies, a higher proportion of deliveries in low-priced markets, and a decline in deliveries of high-priced models like the Cybertruck.
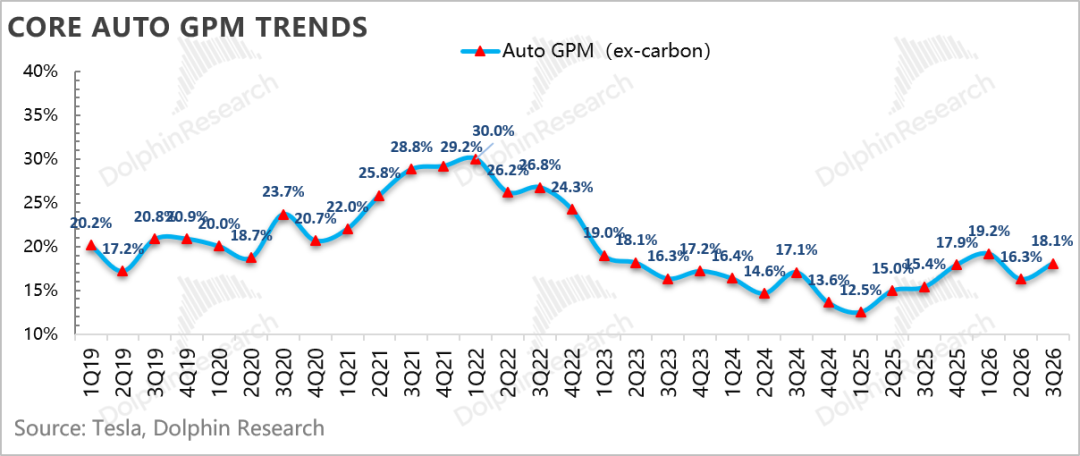
③ Vehicle gross margin improves significantly and exceeds expectations: The true vehicle gross margin (excluding regulatory credits) increased by 1.8 percentage points QoQ to 18.1%, higher than the expected 16.7%.
The key driver was a more significant decline in unit costs compared to selling prices, combined with high-margin FSD revenue contribution as North American FSD penetration rose to over 75%.
④ Heavy AI R&D investment, with downward revision to full-year CapEx guidance: R&D expenses surged to $2.76 billion (+69% YoY), primarily allocated to FSD training, AI chips, and new product lines.
Quarterly CapEx fell to $4.73 billion, driving free cash flow back to positive territory at $1.53 billion. Full-year CapEx guidance was revised downward from 'over $25 billion' to approximately $20 billion.
⑤ Operating profit slightly below expectations: The excess in gross profit was largely offset by AI R&D and SG&A expenses (including CEO performance bonuses), resulting in an operating profit of $720 million, slightly below the expected $750 million.
Dolphin Research's Overall View:
Overall, Tesla's Q3 performance was decent: Revenue slightly missed expectations, while gross margin and cash flow significantly exceeded forecasts. Operating profit was slightly below expectations due to pressure from AI investments.
In the vehicle business, ASP saw a slight QoQ decline, but true vehicle gross margin rose to 18.1%. Dolphin Research believes this improvement primarily came from increased high-margin FSD revenue (North American penetration over 75%, European approval expanded to 9 countries), the fading one-time impact of Model S/X production halt, a higher proportion of low-cost Shanghai-made vehicles, and lower variable costs due to declining lithium prices, offsetting higher memory prices and interest subsidy costs.
Energy storage 'dragged' on revenue: Revenue fell short by about 27%, with both deployment volume and unit price below expectations. The jump in gross margin was mainly due to one-time factors like tariff refunds and reversal of warranty provisions for battery cells.
However, demand remains strong: 2027 Megapack capacity is nearly sold out, with robust data center demand. Management expects ASP and gross margin to continue rising.
But compared to the earnings report itself, the market is more focused on the progress of the AI business, which accounts for the majority of the valuation:
The earnings call provided neutral to weak guidance on AI: FSD subscription and Robotaxi mileage execution data exceeded expectations, but consumer unsupervised FSD was delayed to Q2 2027. Optimus mass production is at least a year away, and the 'dozens of states by year-end' Robotaxi target was not reiterated. Substantial AI monetization is still concentrated post-2027:
① Optimus: Early mass production has begun, but external deliveries won't start until late 2027
Production ramp: Musk clearly 'cooled' expectations. The Fremont line has started 'early production,' with most equipment for 1 million units/year capacity in place. However, the ramp will follow an S-curve, requiring about 10,000 processes to be correct. Hand durability and tactile sensors are still being adjusted. Achieving ~20,000 units/week (~1 million annualized) will take at least another year, around late 2027.
Current production: Not disclosed by the company. According to research, Fremont's weekly output rose from dozens in Q2 to ~500 by mid-September, potentially exceeding 2,000/week by year-end. However, annualized production would still be ~100,000 units, an order of magnitude below design capacity.
AI and deliveries: Management stated that 10,000–20,000 robots need to self-train in the Optimus Academy to form a data flywheel. The AI5 chip is expected to be integrated around April 2027. External deliveries will begin around late 2027, initially focusing on dangerous, repetitive, 24/7 industrial scenarios, with consumer products to follow later.
Thus, external delivery timing aligns with market expectations, but mass production is pushed back to late 2027. Near-term catalysts are limited: No V3 unveiling, only a promise to release a 'non-pre-programmed' demo video within 1–2 months.
② Robotaxi: Cybercab progress better than expected, but expansion targets downplayed
Last quarter, management aimed for unsupervised operations in over a dozen states by year-end, with the market expecting fleet expansion to accelerate by late 2026–early 2027:
Expansion progress: Unsupervised operations now cover Austin, Dallas, Houston, Miami, Orlando, and Tampa (6 cities in Texas and Florida). The Bay Area still requires safety drivers; Phoenix and Las Vegas are in preparation.
Fleet size: Tesla's autonomous vehicle registrations with the Texas DMV rose from ~420 in early September to ~589 by early October, including Cybercab increasing from 45 to 169 units. For comparison, Waymo has ~3,800 vehicles.
Mileage: Unsupervised cumulative mileage surged from ~380,000 miles in Q2 to nearly 2 million miles by quarter-end, a ~5x QoQ increase, with double-digit weekly growth, meeting guidance.
Expansion targets: The 'dozens of states' goal was not reiterated. Plans for 2026 include enabling 24/7 operations and highway access. Management admitted the current bottleneck is still technological, with regulatory transition expected in Q1–Q2 2027.
Cybercab is the quarter's bright spot: Operations in Austin expanded ~10x in about a month, entering Dallas next month and more cities by year-end. The production line's nominal capacity exceeds 125,000 units/year, with actual capacity higher. Current production is demand-driven, constrained by regulation rather than manufacturing. A small number will be delivered to customers by year-end, but the vast majority will be Tesla-owned and operated under a 'Transportation-as-a-Service' model.
Monetization: The cost target of $0.30/mile has not yet been met, but a clear path is visible. Musk expects meaningful financial contribution starting in Q2 2027, with Q3 or Q4 2027 becoming 'a big deal.'
Thus, mileage growth and Cybercab deployment exceeded expectations, but city expansion significantly lagged guidance. Large-scale fleet expansion is more likely to occur in mid-2027, later than market expectations. Financial contributions will only become significant in H2 2027.
③ FSD: Paid subscribers exceed expectations, but unsupervised timeline delayed
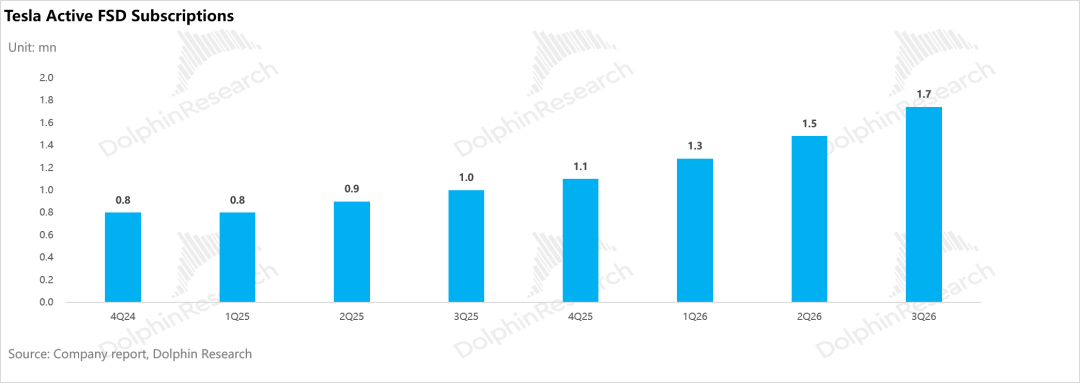
Global paid subscribers surpassed 1.7 million, higher than the expected 1.57 million, with subscription-based accounts reaching 50% for the first time. Over 75% of new North American vehicles signed up for paid subscriptions upon delivery (vs. ~55% in Q2), with each new vehicle including a 1-month free trial.
However, the unsupervised timeline was delayed: Beyond the V15 software rollout, vehicles need to be integrated into Tesla's geofencing and fleet management system. The first batch of customer vehicles is expected to join the Robotaxi fleet around Q2 2027, about two quarters later than the previous 'earliest Q4 2026' estimate. For EU-wide approval, Musk said he 'would be surprised if it took longer than Q1.'
Thus, subscriptions and penetration significantly exceeded expectations, but the core valuation driver—unsupervised FSD—was delayed by two quarters, with no specific date given for V15.
Finally, on CapEx: The 2026 CapEx guidance was revised downward from over $25 billion to ~$20 billion, combined with a borrowing capacity of up to $30 billion (no withdrawals planned for the year), significantly easing short-term funding pressure. However, management explicitly stated that CapEx will rise significantly in 2027 and reach tens of billions in 2028, allocated to Robotaxi fleets, Optimus, computing power, and wafer fabs. AI investments are not shrinking but merely delayed.
Thus, the free cash flow turnaround was more driven by delayed CapEx and working capital changes, with sustainability questionable. Existing business profits alone cannot support multi-billion-dollar investments, so the AI business must achieve self-sufficiency as soon as possible.
In terms of stock price, Tesla shares fell to ~$310 after the Q2 report but recovered to ~$386 driven by Cybercab operations, rapid growth in unsupervised mileage, Optimus production expectations, and better-than-expected deliveries, already pricing in a significant portion of AI progress.
However, during this earnings call, key valuation drivers were pushed back: Unsupervised FSD delayed to Q2 2027, Optimus mass production at least a year away, and Robotaxi financial contributions not until H2 2027. Near-term events like the Optimus video, 24/7 operations, and Cybercab city expansions will mostly validate existing roadmaps, unlikely to provide strong catalysts.
Overall, Dolphin Research maintains a cautious stance. Earnings and cash flow provide fundamental support for the stock price, but the valuation is almost entirely based on AI fulfillment post-2027. Delays leave little room for upside breakthroughs in the short term, likely leading to consolidation.
Below is a detailed analysis of the earnings report:
1. Tesla: Gross Margin Finally Recovers from Trough
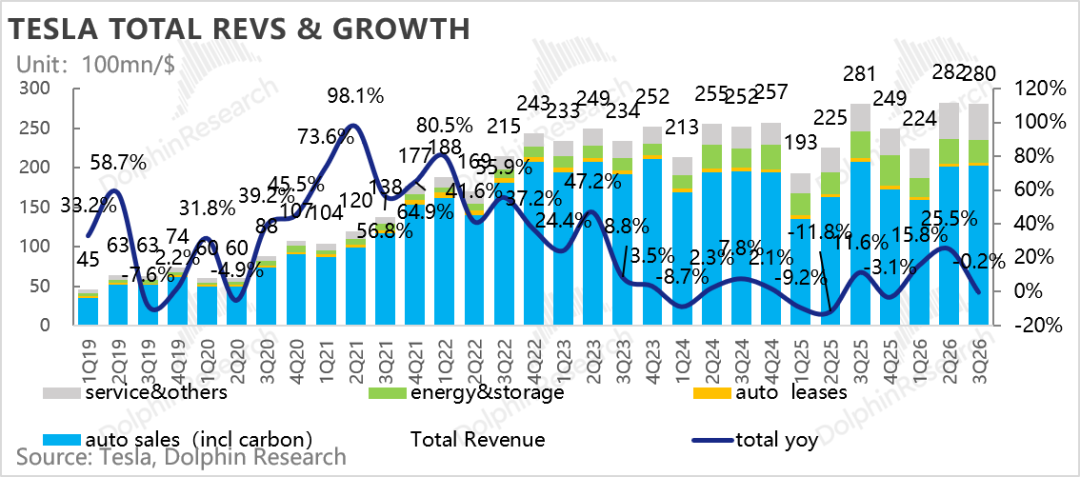
Q3 total revenue reached $28.05 billion, down 0.2% YoY and slightly below the expected $28.7 billion, primarily dragged down by energy storage. Core vehicle revenue slightly exceeded expectations.
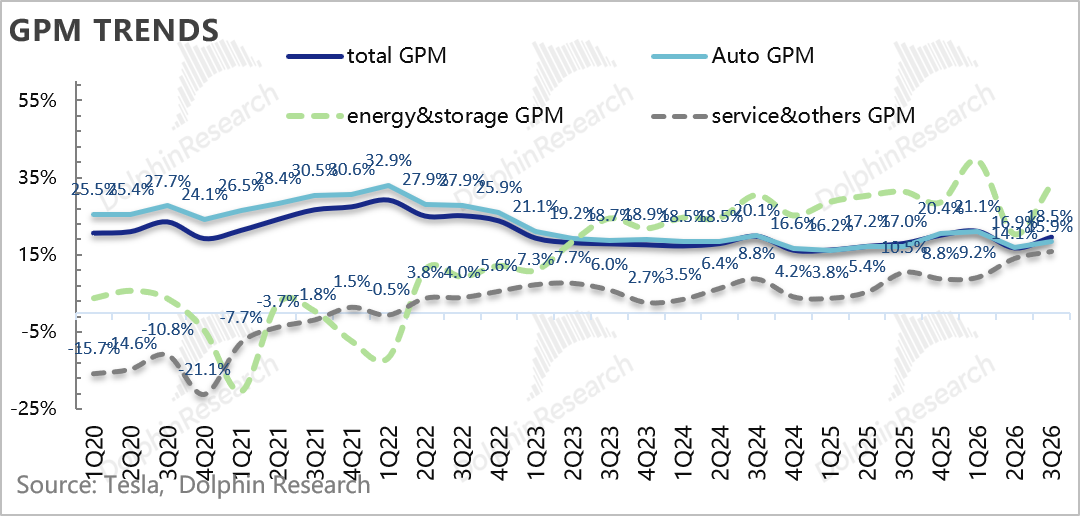
Overall gross margin was 19.6%, up 2.8 percentage points QoQ and higher than the expected 17.7%, with both vehicle and energy storage gross margins recovering. By segment:
① Automotive: Revenue exceeds expectations, with significant margin recovery
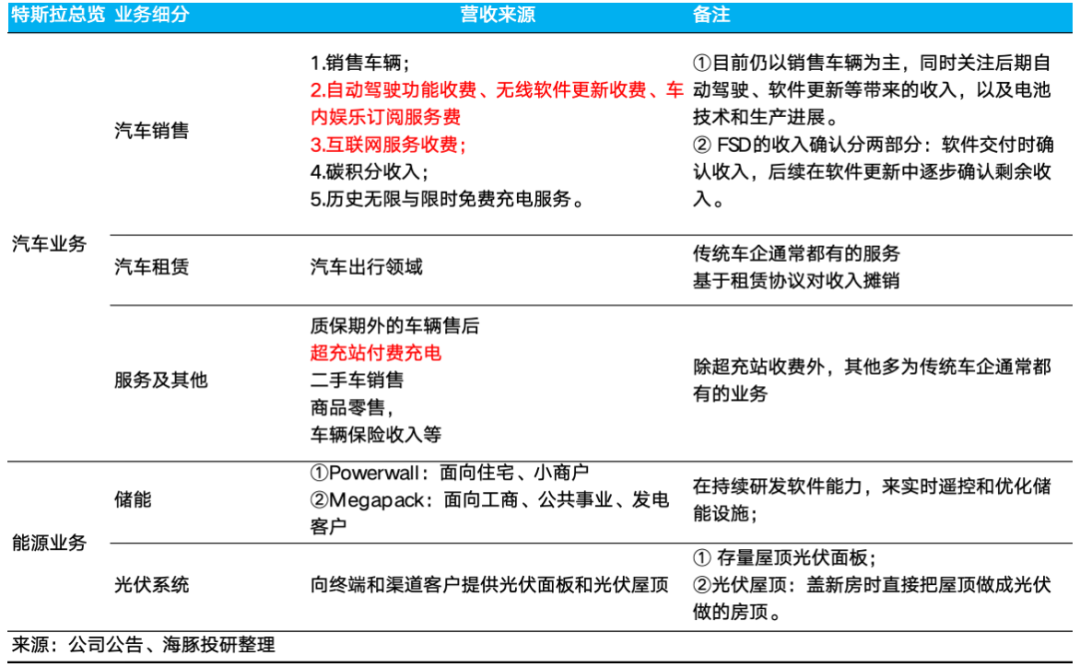
Total automotive revenue was $20.56 billion, down 3.0% YoY and higher than the expected $20.4 billion, including:
Regulatory credit revenue of $110 million, down another $40 million QoQ, continuing the decline after regulatory adjustments (elimination of fines).
Core automotive sales revenue (excluding regulatory credits and leasing) was $20.1 billion, higher than the expected $19.9 billion, mainly due to higher-than-expected vehicle ASP, which still declined QoQ by ~$370 to $41,300.
True vehicle gross margin (excluding regulatory credits) was 18.1%, up 1.8 percentage points QoQ and higher than the expected 16.7%.
Dolphin Research attributes this to increased high-margin FSD revenue, fading impact from Model S/X production halt, and lower variable costs due to declining lithium prices, offsetting higher memory prices and interest subsidy costs.
② Energy: Revenue significantly below expectations, with margin jump driven by one-time factors
Energy revenue was $2.88 billion, down 15.6% YoY and significantly below the expected $3.93 billion, mainly due to lower-than-expected deployment volume and a QoQ decline in unit price.
Deployment volume was 13.7 GWh, below the expected 14.5 GWh. Unit price declined ~10% QoQ to $0.21/Wh.
Gross margin jumped from 20.4% to 33.1%, far higher than the expected 25.7%, mainly due to one-time factors like tariff refunds and reversal of warranty provisions for battery cells.
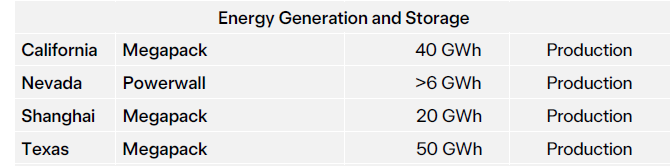
However, demand remains strong: 2027 Megapack capacity is nearly sold out, with management expecting ASP and gross margin to continue rising. Megafactory Texas (planned 50 GWh) has started production, with the first batch of Megapacks using in-house LFP cells beginning deliveries.
③ Services: Revenue and gross margin both exceed expectations
Service and other revenue was $4.61 billion, up 32.5% YoY and higher than the expected $4.29 billion. Gross margin improved from 14.1% to 15.9%, higher than the expected 10.5%, mainly driven by charging, insurance, and parts.
2. Vehicle Gross Margin Significantly Exceeds Expectations
Vehicle gross margin is the most critical metric each quarter, especially amid aging models and intensifying competition. Dolphin Research breaks down the true vehicle gross margin (excluding regulatory credits), leasing gross margin, and overall automotive gross margin.
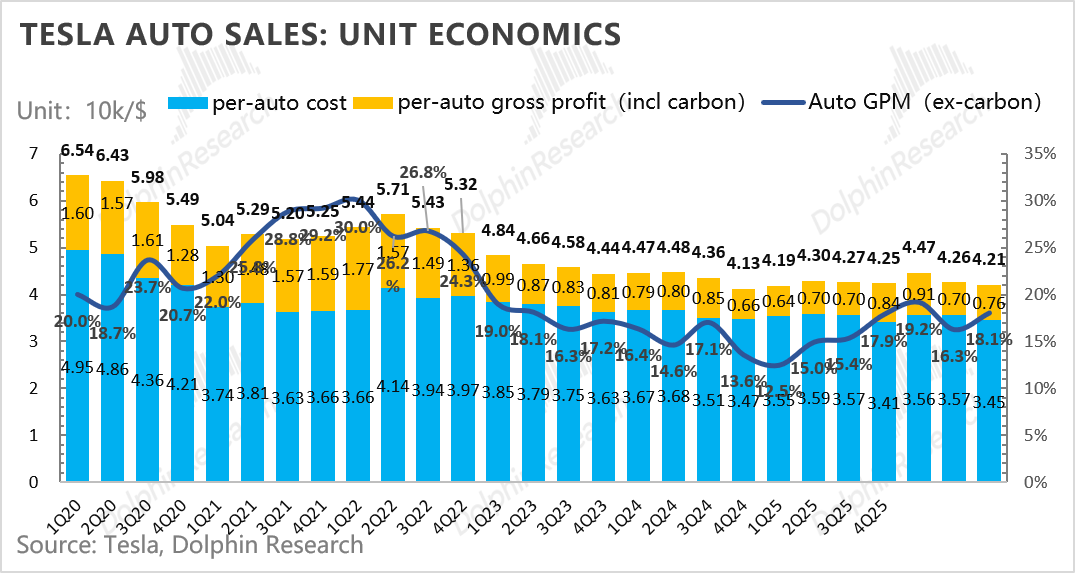
Q3 true vehicle gross margin was 18.1%, up 1.8 percentage points QoQ and higher than the expected 16.7%, driven by increased high-margin FSD revenue and significant cost reductions, despite a slight decline in ASP:
2.1 Vehicle ASP Sees Slight QoQ Decline
Q3 vehicle revenue per unit (excluding regulatory credits and leasing) was $41,300, down ~$370 QoQ and slightly below the expected $41,500.
① Q3 Pricing: Price cuts in China, higher interest subsidy costs in the U.S. due to rising rates
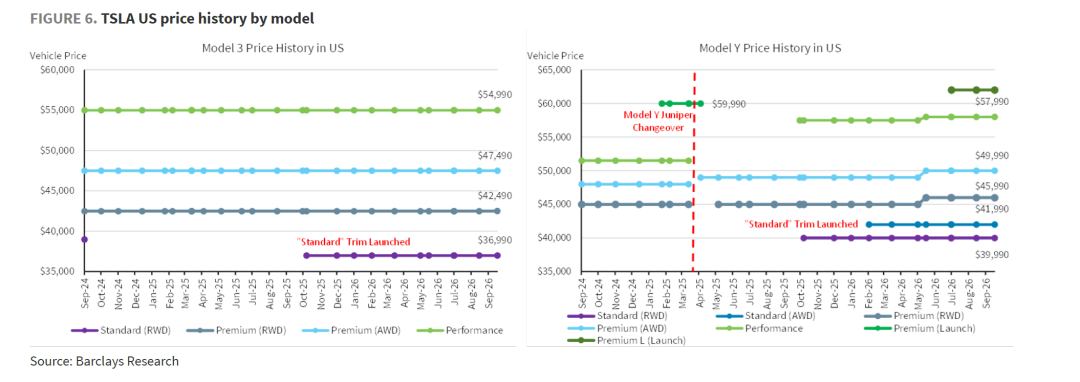
a. U.S.: Pricing stable, but interest subsidies continue
Overall pricing remained stable, but financial incentives persisted: In August, the 72-month loan rate for certain Model Y versions was raised from 0% to 1.49% (3.99% for Performance), while FSD 30-day trials and Model 3 leasing at $419/month remained available. Rising rates increased interest subsidy costs.
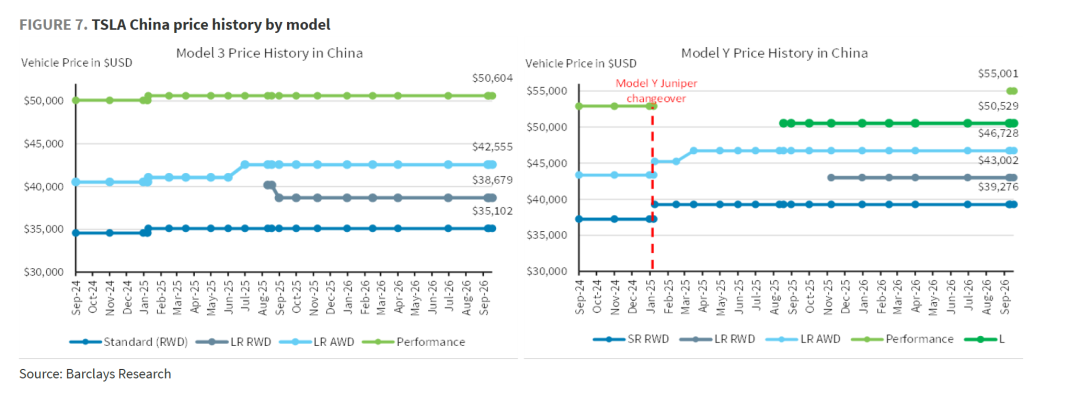
b. China: First price reduction after maintaining prices for 19 months
On September 10, prices for Model 3/Y were reduced by 2–4% (approximately RMB 5,000–10,000), marking the first price reduction in 19 months; additional discounts were offered for end-of-quarter inventory vehicles (RMB 10,000 for Model Y, RMB 5,000 for Model 3).
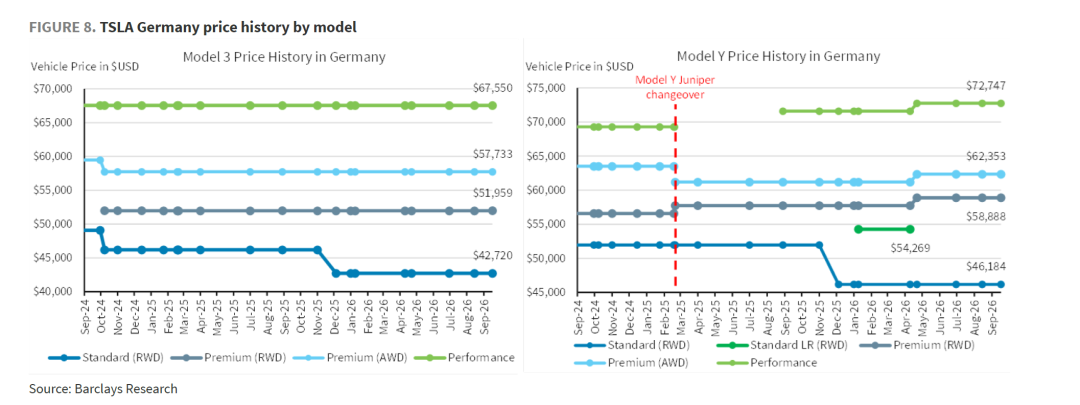
c. Europe: Prices remain generally stable, with FSD driving demand
Prices remain stable overall, with promotions primarily centered around low-interest loans; FSD approvals in more countries have become a significant driver of sales.
② Vehicle Model Mix: Proportion of high-priced models continues to decline
Deliveries of models other than Model 3/Y (Cybertruck, Cybercab, etc.) totaled only 8,295 units, a 33% MoM decrease, with their share dropping from 2.6% to 1.7%, further lowering the ASP.
③ FSD Business: Subscription numbers significantly exceed expectations
Global FSD paid subscribers reached 1.74 million, a net increase of 260,000 MoM and a 67% YoY increase, substantially higher than the expected 1.57 million. Drivers include:
a. Penetration of new vehicles in North America rose from approximately 55% to over 75%, with free trials included as standard equipment in new vehicles driving conversions;
b. New approvals in Europe (Croatia, Slovenia, Czech Republic, Slovakia), bringing the total to 9 approved countries; significant sales increases in markets such as South Korea and Australia following FSD launches;
c. Starting in February in North America, only subscriptions (USD 99/month) are sold, while other regions stopped outright purchases before August, lowering the barrier to entry, though short-term recognized revenue is lower than outright purchases.
New FSD users this quarter accounted for approximately 53% of new vehicle sales, with paid subscribers representing about 17% of the total fleet (10.2 million cumulative deliveries).
2.2 Significant MoM decline in cost per vehicle
Dolphin Research breaks down the cost per vehicle into depreciation and variable costs:
1) Depreciation effect per vehicle: Total depreciation rises, with a slight increase in depreciation per vehicle
Total depreciation and amortization reached USD 1.85 billion, a 14% MoM increase, with depreciation per vehicle at approximately USD 3,800, up about USD 430 MoM. Depreciation growth outpaced the dilution effect from increased production.
2) Variable cost per vehicle: Significant decline
Variable costs per vehicle were approximately USD 30,000, a MoM decrease of about USD 1,500: Structural cost reductions from a higher proportion of low-cost Shanghai-produced vehicles, fewer high-priced models, and declining lithium prices outweighed the impact of rising commodity prices for memory and steel, aluminum, copper, and silver.
3) Gross margin on vehicle sales exceeds expectations
Ultimately, the decline in cost per vehicle significantly outpaced the decline in average selling price, with the true gross margin on vehicle sales rising 1.8 percentage points MoM to 18.1%.
III. Q3 deliveries slightly exceed expectations, with YoY sales rebounds in China and the U.S.
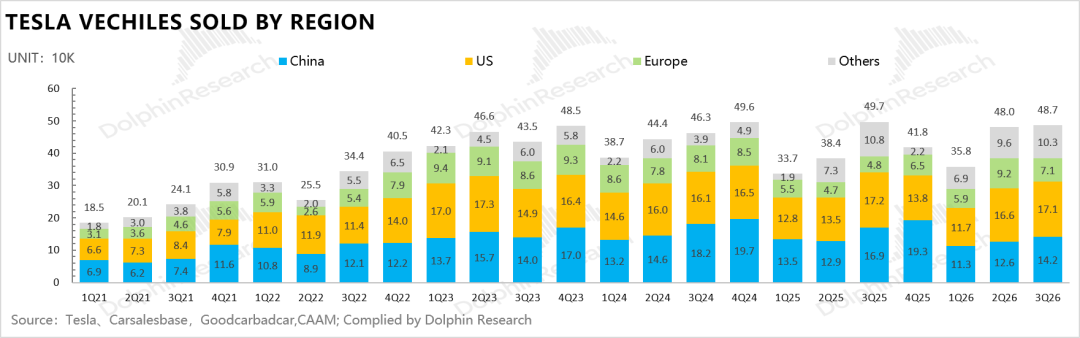
487,000 vehicles were delivered in Q3, a 1.3% MoM increase, exceeding expectations of 464,000 units. By region:
① U.S.: Approximately 171,000 deliveries, a 12% YoY decrease (high base from pre-Q3 2025 tax credit expiration rush), but a 3% MoM increase. The core driver remains FSD, with more consumers purchasing vehicles for FSD.
② China: 142,000 deliveries, a 9% MoM increase, primarily supported by new inventory vehicle discounts in September and existing finance and insurance subsidies.
③ Europe: 71,000 deliveries, a 23% MoM decrease, mainly due to Q3 being a low sales season, compounded by increased competition from Chinese brands such as BYD and Leapmotor entering Europe.
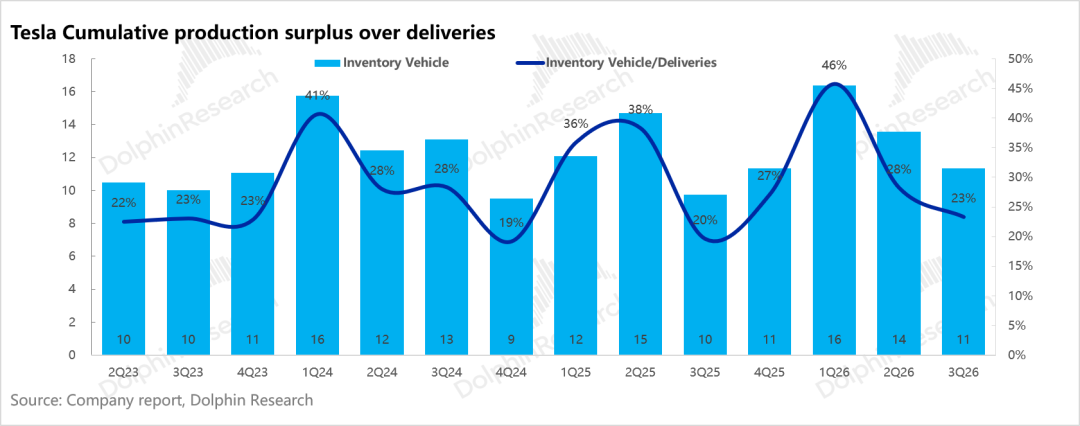
Production was 464,000 units, about 22,000 fewer than deliveries, marking the second consecutive quarter of inventory reduction, with inventory turnover days decreasing from 15 to 11. The company stated that backlog orders at quarter-end were at a four-year high, with battery supply remaining the primary constraint on production.
IV. Expenses: Continued heavy investment in AI business
R&D expenses were USD 2.76 billion, a USD 390 million MoM increase, significantly higher than the expected approximately USD 2.3 billion, primarily allocated to AI development (additional computing power depreciation, chip R&D) and trial production ramp-up for new products such as Optimus, Megapack 3, and Semi; the company indicated that expenses will continue to rise before new product commercialization.
SG&A expenses were USD 2.02 billion, slightly higher than the expected USD 1.96 billion, mainly due to sustained high SBC expenses (USD 1.17 billion, expected USD 1.05 billion) such as CEO performance awards.
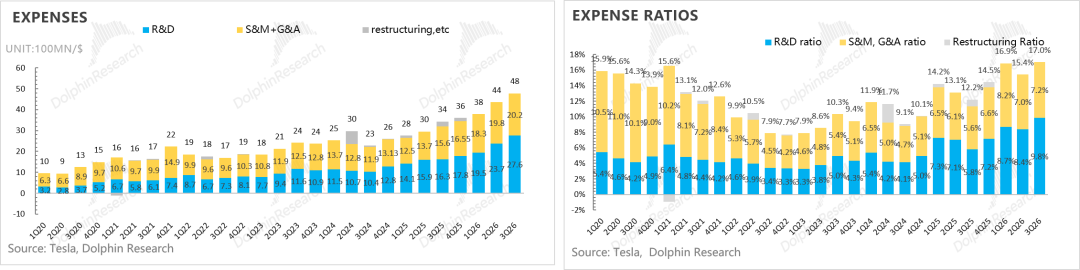
Ultimately, operating profit was USD 720 million, slightly below the expected USD 750 million, but the operating margin improved 1.2 percentage points MoM to 2.6%.
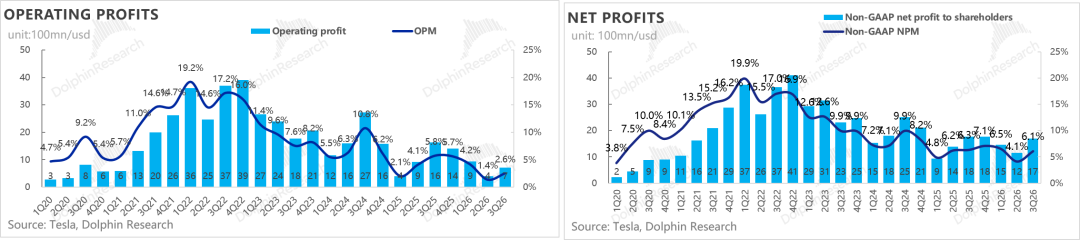
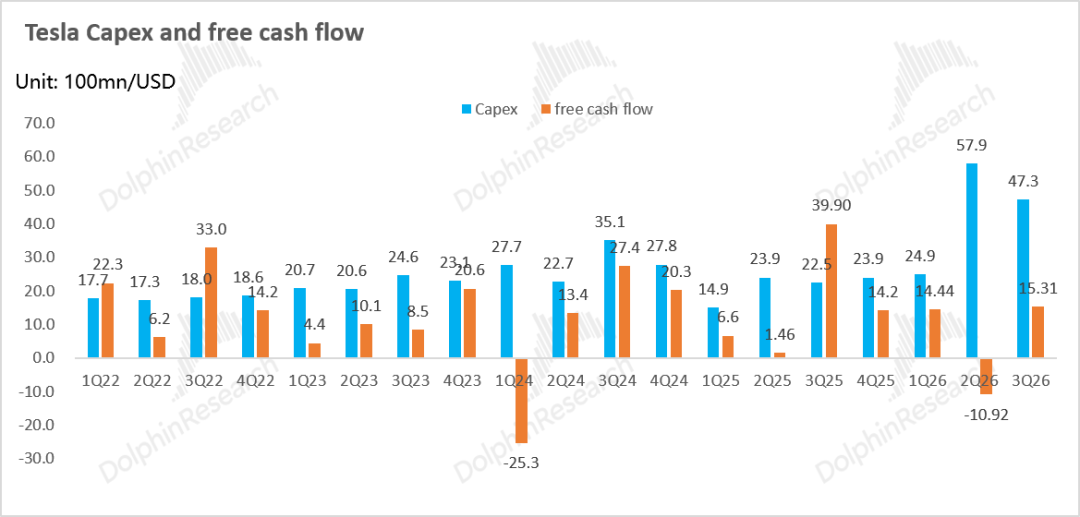
Free cash flow turns positive again: Operating cash flow increased by USD 1.57 billion MoM to USD 6.26 billion, primarily from working capital (approximately USD 4 billion increase in payables and accrued liabilities, approximately USD 1.26 billion increase in deferred revenue); capital expenditures decreased to USD 4.73 billion, with free cash flow at USD 1.53 billion, turning positive from Q2's USD -1.09 billion.
Capital expenditures were primarily allocated to AI computing power, Cybercab and Semi production lines, Optimus production lines, lithium refining and cathode materials, and Terafab; Cortex 1 and 2 training computing power exceeded 105MW and 120MW, respectively, with a year-end target of 400MW.
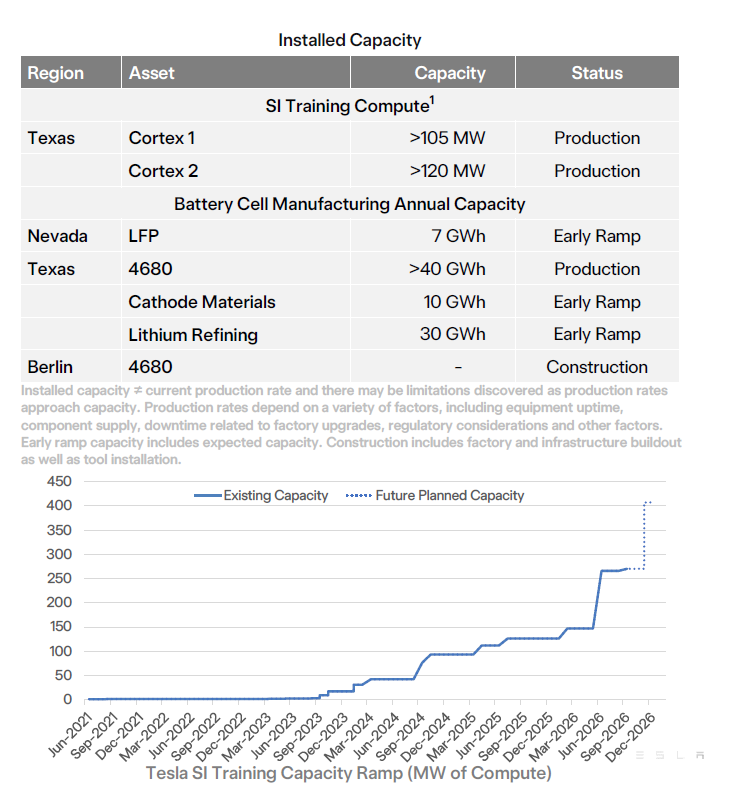
The full-year Capex guidance was lowered from "over USD 25 billion" to approximately USD 20 billion, implying about USD 7 billion in Q4; however, Musk stated that it will rise significantly next year and reach the tens of billions of dollars by 2028.
Regarding Terafab, the research fab will begin equipment commissioning in the first half of 2027, with mass production around the end of 2028; equipment investment will reach tens of billions of dollars by early 2028 and may exceed USD 100 billion long-term, with how it will be shared with SpaceX yet to be determined.
Cash on hand and investments totaled USD 45.4 billion, with an additional borrowing capacity of up to USD 30 billion, comfortably covering this year's Capex; however, investments will significantly increase in 2027–28, and the AI blueprint still needs to be quickly translated into revenue and cash flow.
- END -
// Reprint Authorization
This article is an original work by Dolphin Research. Reproduction requires authorization.
// Disclaimer and General Disclosure
This report is for general comprehensive data purposes only, intended for general reading and data reference by users of Dolphin Research and its affiliated institutions. It does not consider the specific investment objectives, investment product preferences, risk tolerance, financial status, or special needs of any person receiving this report. Investors must consult with independent professional advisors before making investment decisions based on this report. Any person making investment decisions using or referring to the content or information in this report assumes all risks. Dolphin Research shall not be liable for any direct or indirect responsibilities or losses that may arise from the use of the data in this report. The information and data in this report are based on publicly available materials and are for reference purposes only. Dolphin Research strives to ensure but does not guarantee the reliability, accuracy, and completeness of the information and data.
The information or views mentioned in this report shall not, under any jurisdiction, be regarded or construed as an offer to sell securities or an invitation to buy or sell securities, nor shall they constitute recommendations, inquiries, or endorsements of relevant securities or related financial instruments. The information, tools, and materials in this report are not intended for or intended to be distributed to jurisdictions where the distribution, publication, provision, or use of such information, tools, and materials conflicts with applicable laws or regulations or results in Dolphin Research and/or its subsidiaries or affiliated companies being subject to registration or licensing requirements in those jurisdictions, nor to citizens or residents of such jurisdictions.
This report reflects only the personal views, insights, and analytical methods of the relevant creators and does not represent the stance of Dolphin Research and/or its affiliated institutions.
This report is produced by Dolphin Research, with copyright solely owned by Dolphin Research. No institution or individual may, without the prior written consent of Dolphin Research, (i) make, copy, reproduce, duplicate, forward, or create any form of copies or replicas in any manner, and/or (ii) directly or indirectly redistribute or transfer to other unauthorized persons. Dolphin Research reserves all related rights.
-
![]()
In the Lead-up to an IPO, What Has XREAL Been Up To These Past Six Months?
-
Xiaomi and VIVO Witness Decline in Overseas Sales Share, OPPO Sees Notable Rise
-
![]()
The Moat of Palantir Lies in Two Decades of Architectural Evolution
-
![]()
Tesla: Over-promising on 'Futuristic' Plans, Delayed Execution - Can the Auto Business Hold the Fort?
-
![]()
Has the Overall Landscape of Battery Swapping Evolved? NIO Took Eight Years to 'Flourish', While CATL Achieved 'Success' in Just Two
-
![]()
From Technical Chery to AI Chery, Yaoguang 2035 Provides the Answer
-
The Year 2026 Taken Over by AI: More Tools, More Confusion
-
![]()
From 'Africa's Top Player' to Just Another Contender in Africa