China Auto Q3 Export Tracker: Exports Up 72%, Racing Ahead of Tax Rebate Cuts and Hybrid Quotas
 11/10 2026
 516
Recently, Bernstein's Asia automotive team, led by Eunice Lee, published a 27-page report titled "China Auto Export Tracker: Q3 2026."
The report shared data on China's auto exports in Q3, covering overall overseas shipments, powertrain mix, destination markets, and the overseas performance of five domestic automakers.
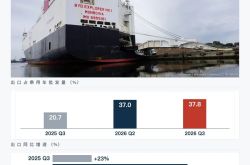
Let's start with the headline number: In Q3, China's passenger vehicle exports reached 2.73 million units, up 72% year-on-year.
Exports already account for 37.8% of wholesale volume. A year ago, that figure was 20.7%.
Another key data point: hybrids.
Plug-in hybrid exports rose 172% year-on-year, battery electric vehicles rose 135%, while internal combustion engine vehicles grew only 19%.
Behind these export numbers are two changes shaping China's auto exports: the export tax rebate cut and the EU hybrid quota confirmed just last month.
Automakers are rushing to ship cars abroad before these two changes take effect.
Four key takeaways from this report:
1 Export momentum will continue until April 2027, when the rebate cut takes effect; after the rush, there is inventory risk.
2 From Q2 2027, export growth will slow, with smaller automakers hit harder.
3 Automakers remain confident because exports are more profitable than domestic sales, and localized factory construction can sustain expansion.
4 Rising trade barriers will accelerate industry consolidation, squeezing out smaller players.
The first page of the report also provides full-year 2026 industry forecasts, which I've put into a table for year-end comparison:
Indicator 2026 Forecast YoY Passenger vehicle wholesale ~29 million units 2% to 4% Domestic retail ~19 million units ~-20% Exports 9.5-10 million units +50% to +60% NEV exports — +90% to +100% Domestic NEV sales penetration ~60% 3% to 5%
Domestic retail drops 20%, exports rise 50-60%. With this table, it's immediately clear how much of this year's volume exports are carrying.
01 Nearly 4 out of every 10 cars sold go overseas; exports as share of wholesale nearly doubled in a year
The first section of the report looks at total volume. Q3 exports were 2.73 million units, up 72% year-on-year.
The growth rate was slightly lower than Q2's +79%, but last year's Q3 was only +23%—this is a 70% increase on an already high base.
More noteworthy is the share. Exports as a proportion of wholesale rose from 20.7% in Q3 last year to 37% in Q2 this year, and then to 37.8% in Q3.
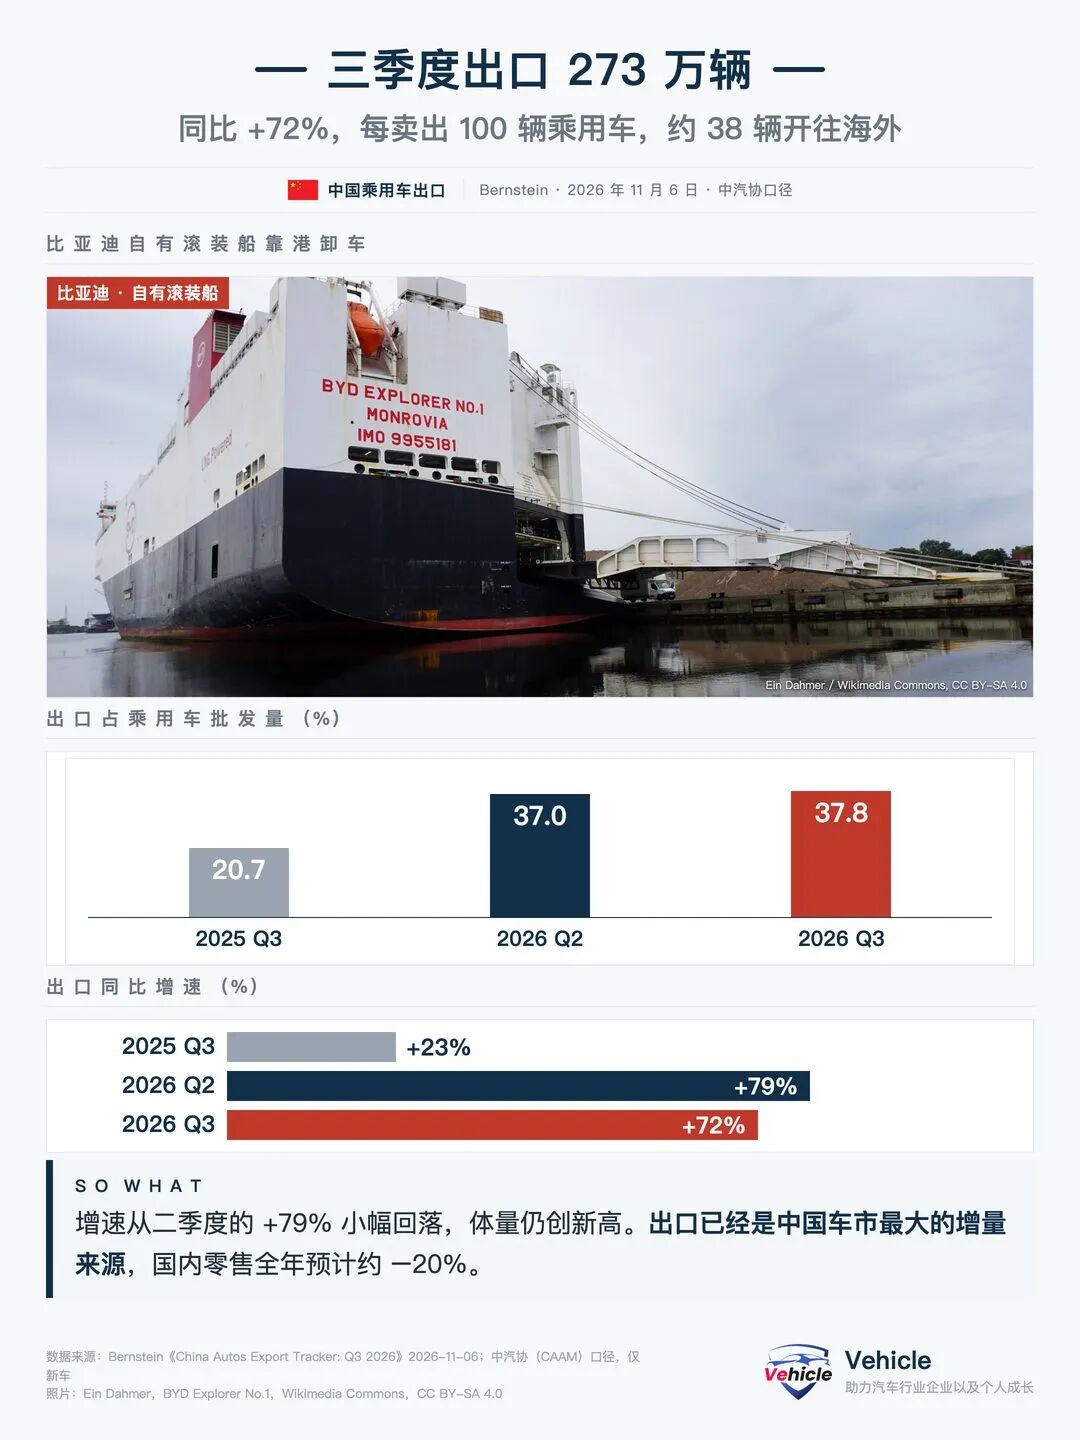
Figure 1 | Q3 exports up 72% YoY, exports as share of wholesale rising to 37.8%
Putting this trend line together with the full-year forecast above makes the picture clear.
Domestic retail is expected to drop 20% for the year, and factory output needs overseas markets to absorb it. Exports now account for nearly 40% of the entire industry.
Exports have become one of the main businesses of Chinese automakers.
02 Of the 1.14 million new units, over 80% are NEVs; plug-in hybrids growing fastest, ICE vehicles already declining sequentially
The report then breaks down the powertrain mix. In Q3 exports, ICE vehicles accounted for 41%, battery electric 37%, and plug-in hybrids 23%.
ICE vehicles remain the largest segment, but their growth was only +19%, and they declined 3% sequentially.
Battery electric rose 135% year-on-year and 22% sequentially. Plug-in hybrids rose 172% year-on-year and 14% sequentially.
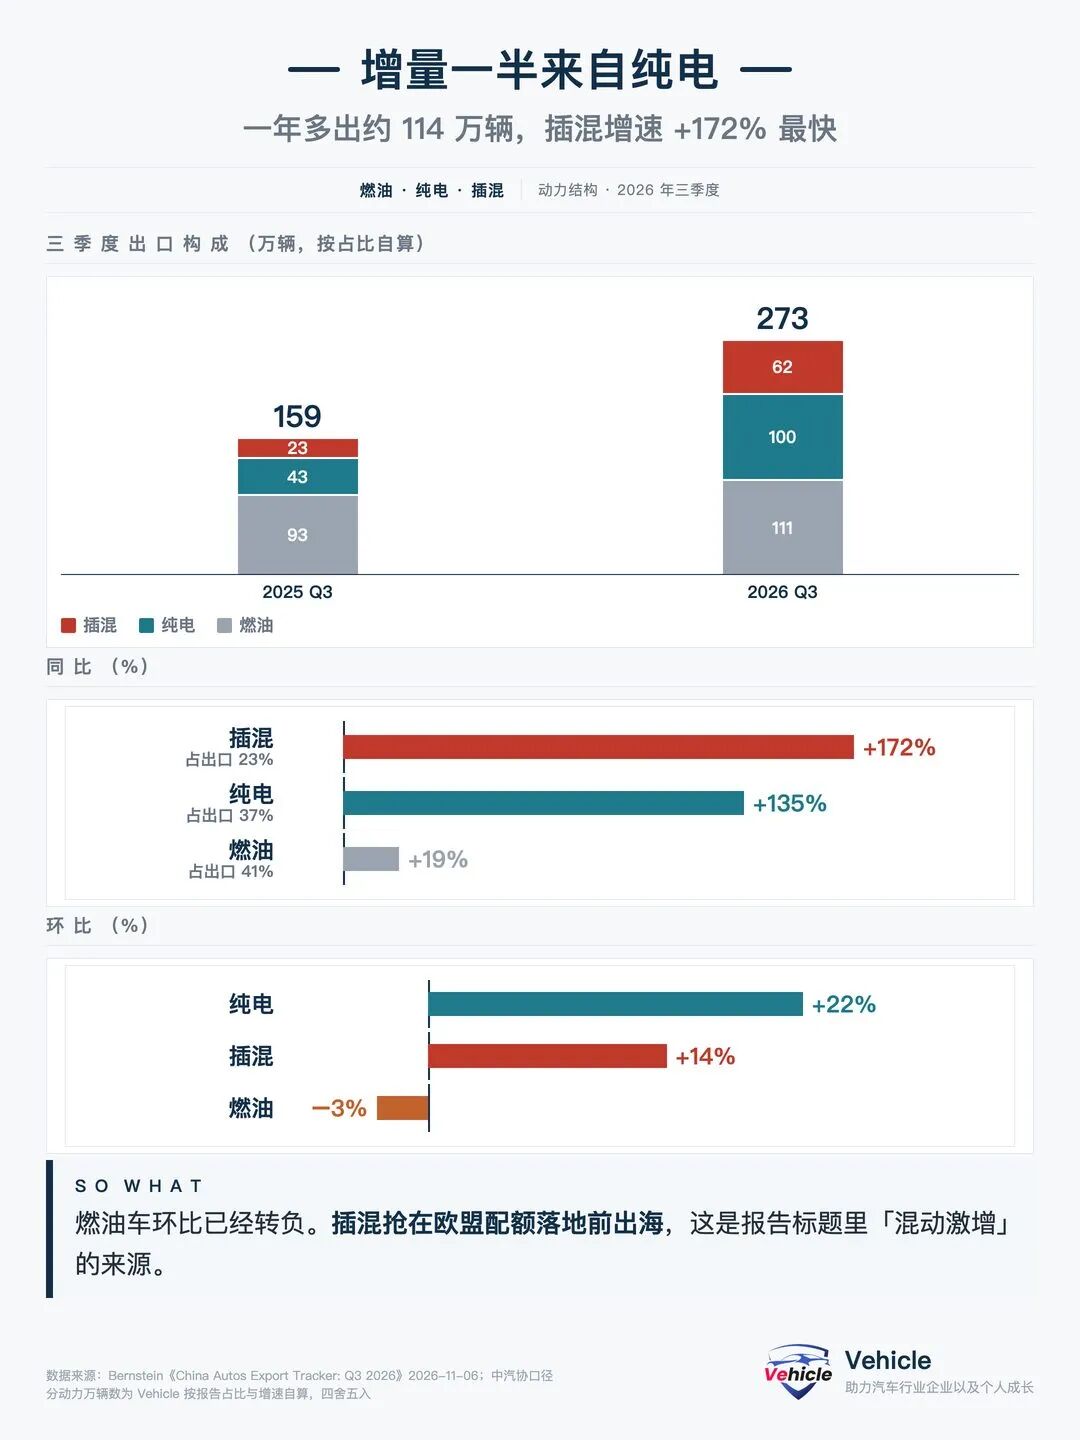
Figure 2 | Q3 export powertrain mix and growth rates
The report only provided shares and growth rates, so I back-calculated absolute volumes from these two sets of numbers, rounded to the nearest ten thousand:
Powertrain Type Q3 2025 Q3 2026 Change ICE ~930K ~1.11M ~+180K Battery Electric ~430K ~1.00M ~+570K Plug-in Hybrid ~230K ~620K ~+390K Total ~1.59M 2.73M ~+1.14M
Of the approximately 1.14 million new units added in a year, battery electric and plug-in hybrid combined account for about 960K, over 80%.
Plug-in hybrids have the smallest base but are growing the fastest.
Our previous article "EU Regulates Chinese Hybrid Vehicle Exports: Who Suffers Most?" also shared that the EU has confirmed quota arrangements for Chinese hybrid vehicles.
Another Bernstein report from October 12, as publicly cited, mentions the quota is approximately 400,000 units per year, while China's hybrid exports to Europe are expected to be around 800,000 units in 2026.
The closer the quota gets, the more urgently plug-in hybrids are being shipped out.
03 Western Europe growing fastest, Middle East & Africa declining; export destinations: all regions rising except one
The third section looks at where the cars are going. This part uses customs data, including used car exports, which runs about 10% higher than CAAM figures.
Q3 year-on-year: Western Europe +95% fastest, Oceania +82%, Latin America +66%, Central & Eastern Europe +54%, ASEAN +45%.
The only declining region is Middle East & Africa, down 14% year-on-year.
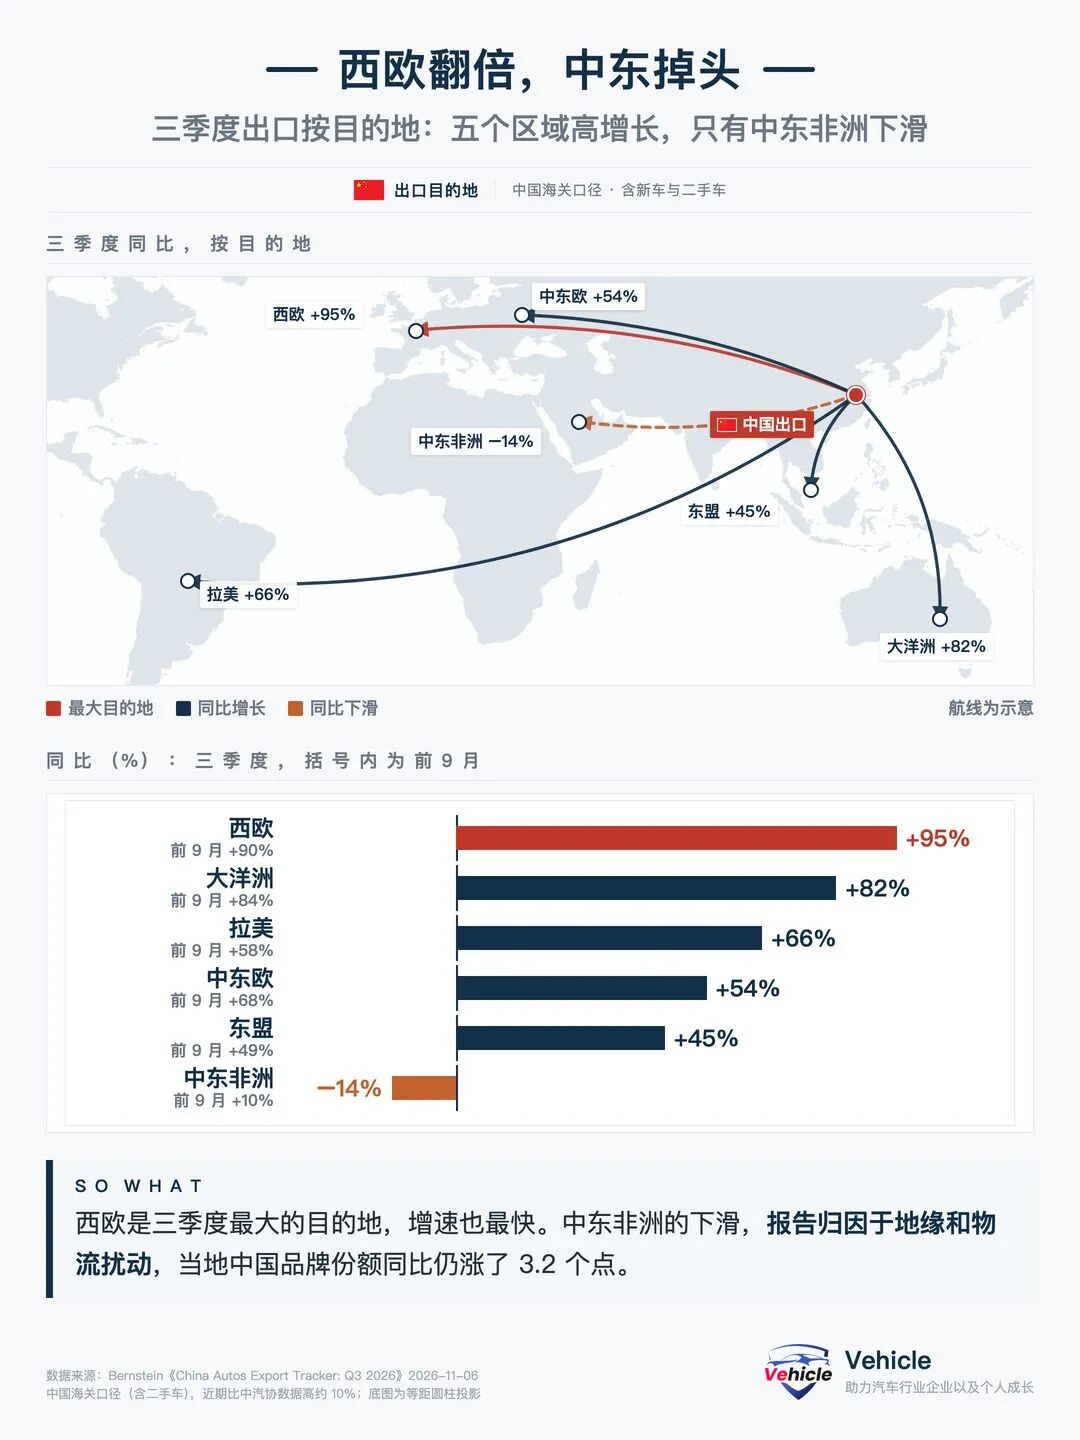
Figure 3 | Q3 export growth by region (customs data, including used cars)
The report attributes the Middle East & Africa decline to geopolitical and logistics disruptions; Chinese brands' market share in the region still rose 3.2 percentage points year-on-year.
Looking at the first three quarters combined, the ranking is similar: Western Europe +90%, Oceania +84%, Central & Eastern Europe +68%, Latin America +58%, ASEAN +49%, Middle East & Africa +10%, South Asia +7%.
Western Europe grew fastest and is exactly where the hybrid quota is being implemented. These two things together paint a picture of racing ahead.
04 Chery largest by volume, BYD and Geely growing fastest; automaker exports: Geely +187% YoY
The second section of the report breaks down by automaker. Q3 export volumes: Chery 598K units (+56%) ranked first, BYD 534K units (+135%) second.
Geely 321K units, up 187% year-on-year, the fastest-growing among the top five. SAIC 214K units, Great Wall 160K units.
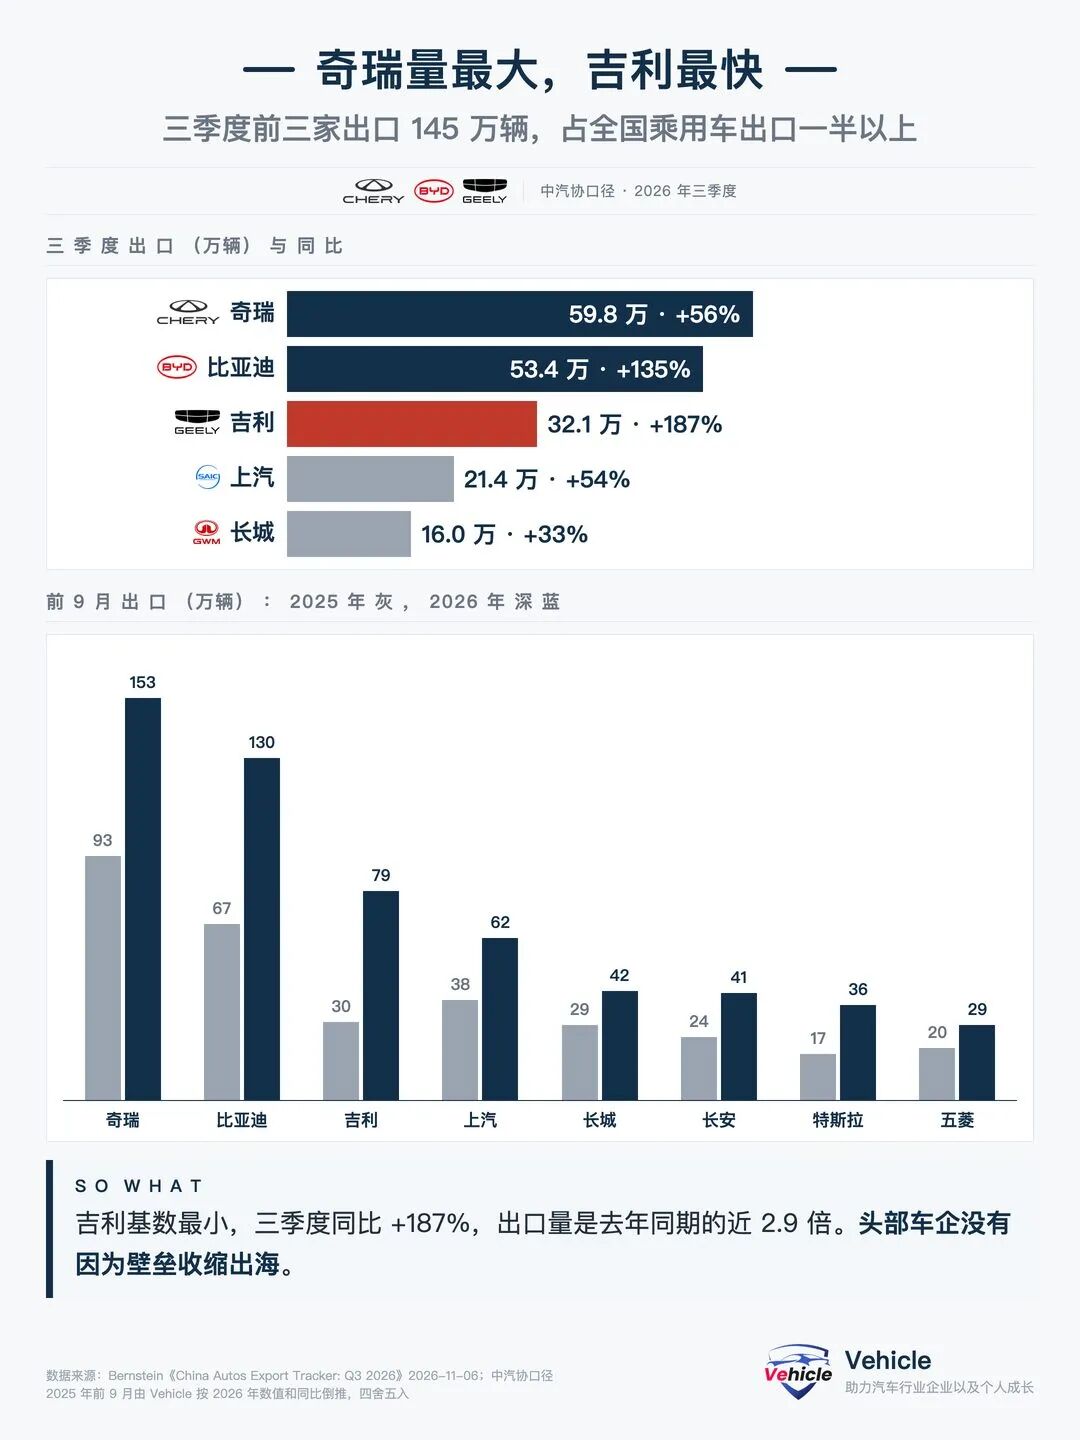
Figure 4 | Q3 and first three quarters export volumes of major automakers
First three quarters cumulative: Chery 1.531 million units, BYD 1.304 million units, Geely 794K units, SAIC 615K units.
Following are Great Wall 416K units, Changan 407K units, Tesla 362K units, SAIC-GM-Wuling 287K units.
Volume alone isn't enough. Another metric is more telling: exports as a share of each automaker's own sales.
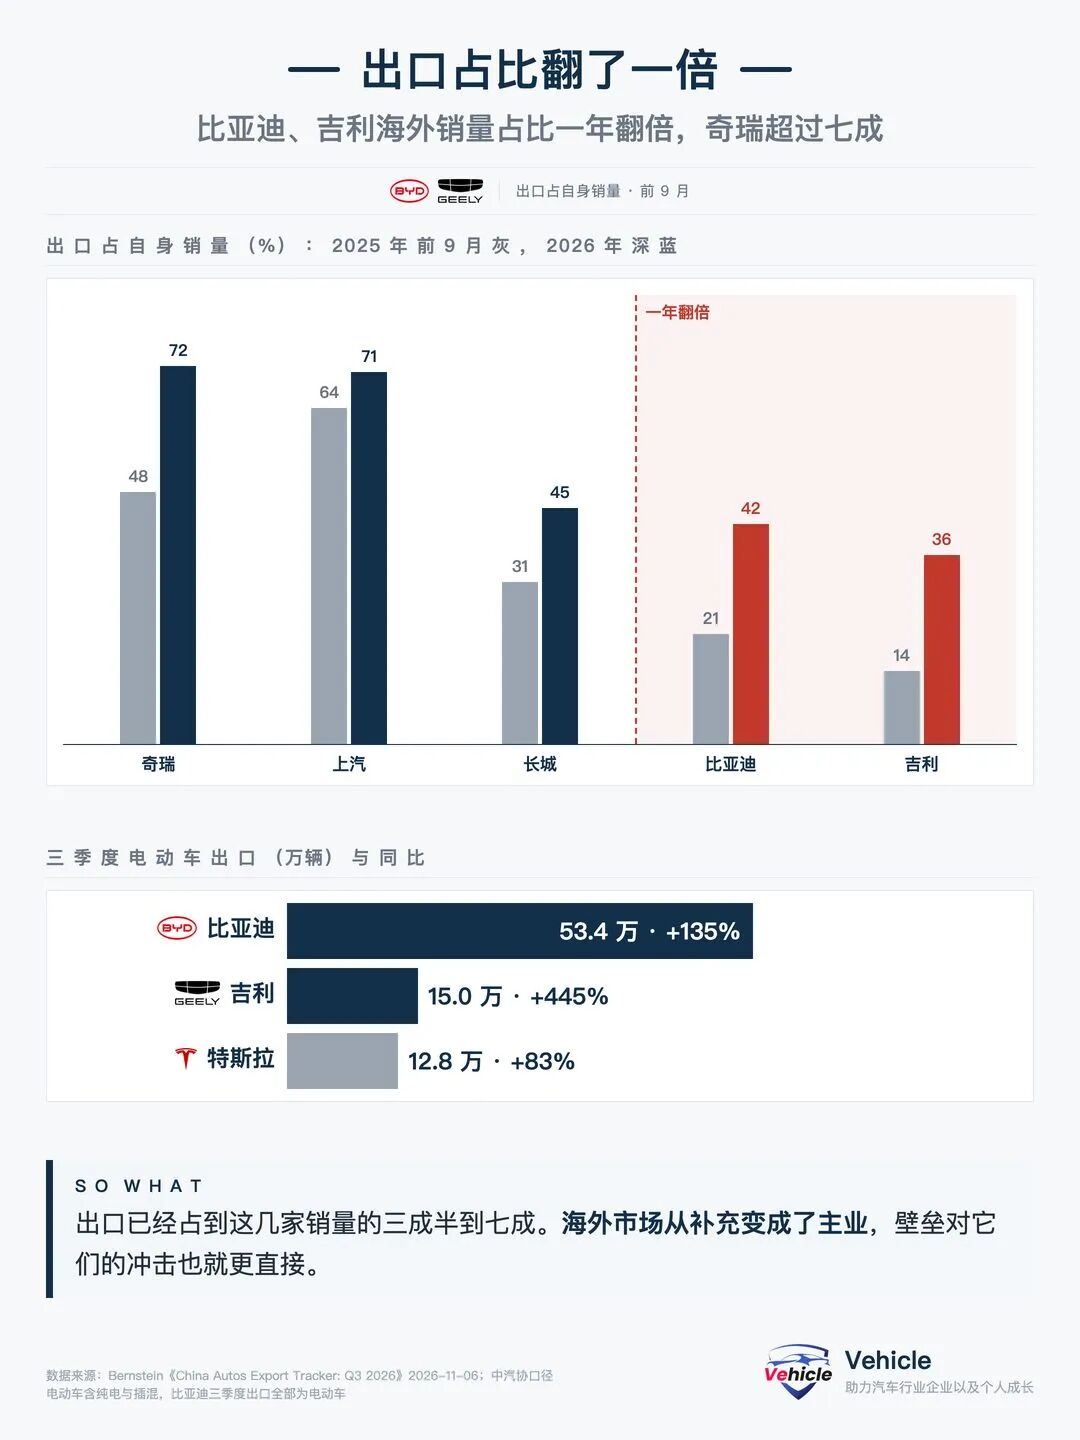
Figure 5 | First three quarters exports as share of own sales, and NEV export volumes
In the first three quarters, Chery's export share rose from 48% to 72%, SAIC from 64% to 71%, Great Wall from 31% to 45%.
The biggest changes were at two companies: BYD from 21% to 42%, Geely from 14% to 36%—both more than doubled in a year.
Looking at NEV exports separately: BYD 534K units in Q3, Geely 150K units (+445%), Tesla China 128K units (+83%).
BYD and Geely transformed themselves into export-oriented automakers within a year.
05 In Oceania, 3 out of every 10 cars sold are Chinese brands; Chinese brand share by region
The third section looks at market share, using IHS data. In Q3, the highest Chinese brand share was in Oceania at 29%, up 12.3 percentage points year-on-year.
Western Europe was lowest at only 10%, but still up 4.4 points year-on-year.
Region Chinese Brand Share YoY QoQ Oceania 29% +12.3 pts +0.4 pts Middle East & Africa 22% +3.2 pts +0.6 pts Latin America 20% +7.2 pts +1.7 pts Central & Eastern Europe 20% -1.2 pts +1.2 pts ASEAN 17% +5.9 pts +1.5 pts Western Europe 10% +4.4 pts +1.2 pts 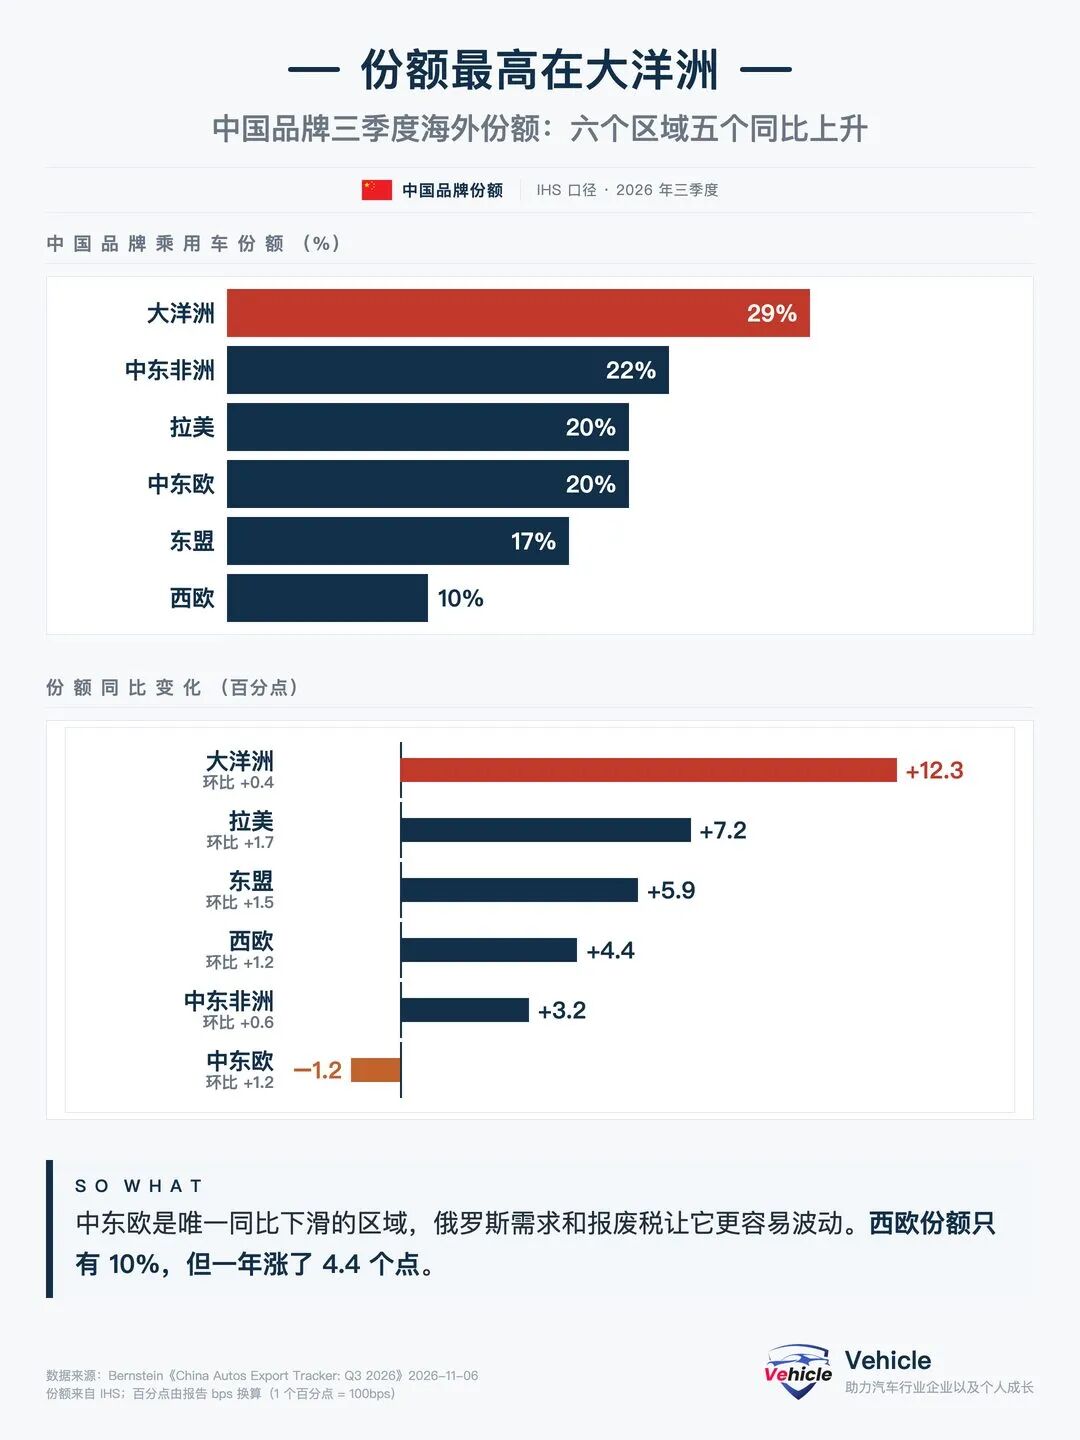
Figure 6 | Q3 Chinese brand share by region and YoY changes
Of the six regions, only Central & Eastern Europe declined year-on-year, down 1.2 points, though it has rebounded sequentially.
Breaking down further by brand, BYD's share in NEVs is most striking: Latin America 46%, Oceania 23%, ASEAN 17%, Western Europe 8%.
The second-ranked Chinese brand is far behind. In Latin America it's Geely at 13%, Oceania Geely at 11%, ASEAN Jetour at 9%, Western Europe MG at 3%.
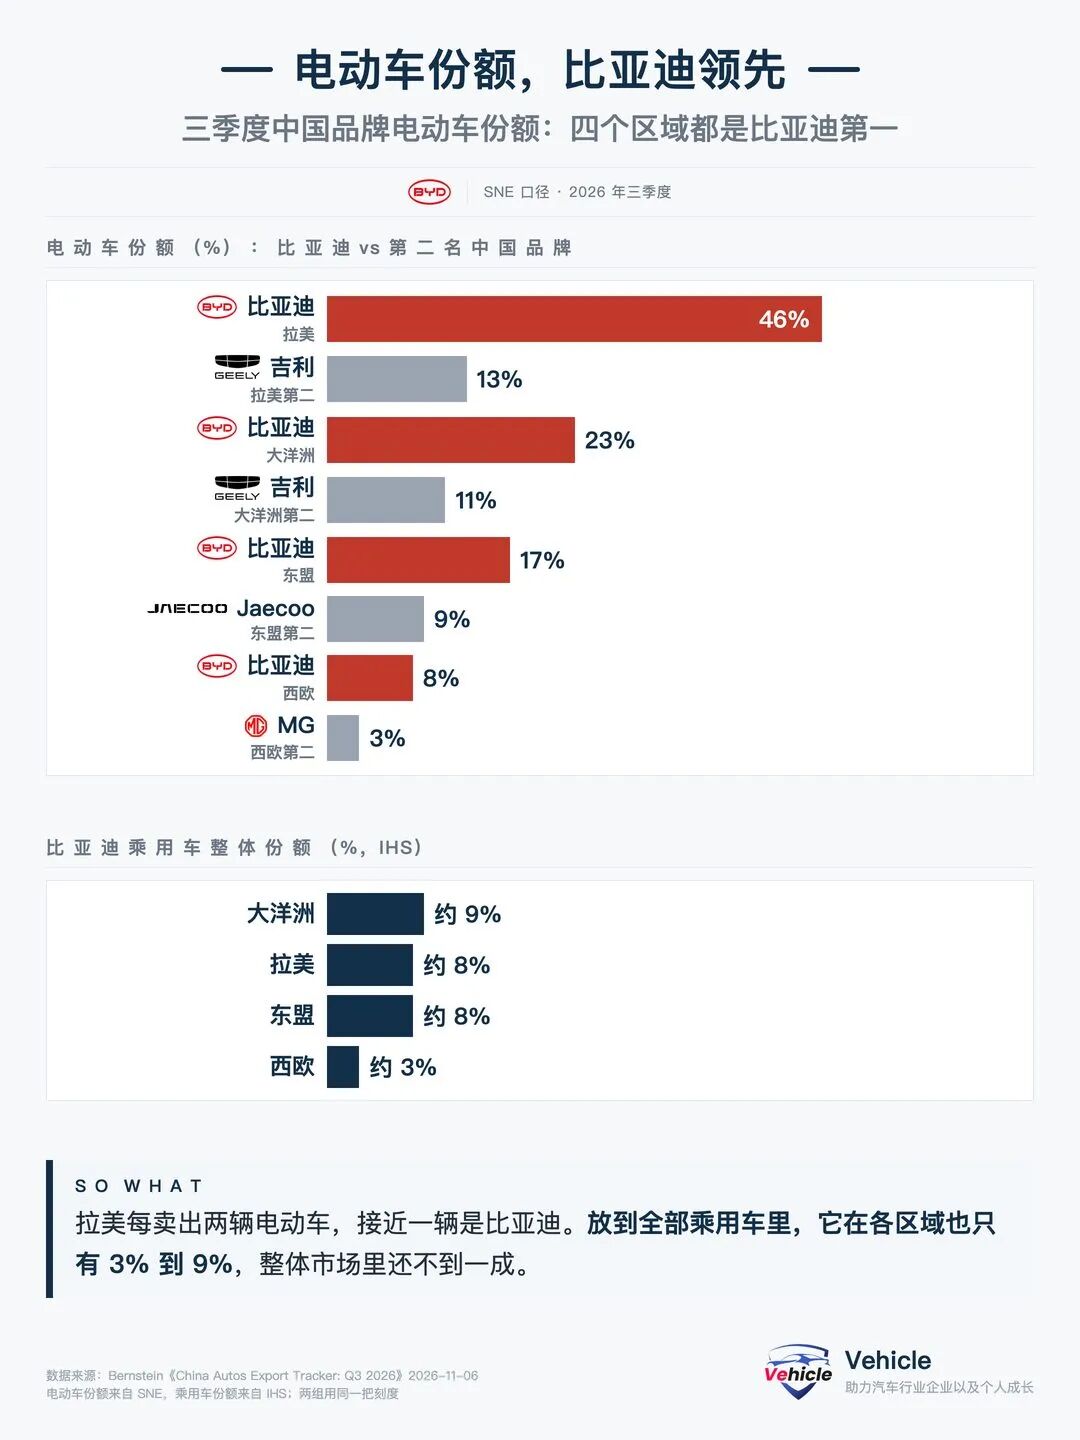
Figure 7 | BYD's NEV share by region vs. second-ranked Chinese brand
Switching to the all-passenger-vehicle metric, BYD's share is Oceania 9%, Latin America 8%, ASEAN 8%, Western Europe 3%. It's the leader in NEVs, but in the overall market there's still significant room to grow.
06 Five automakers, five different paths: destinations and powertrain mixes are completely different
The fourth section of the report examines each automaker. I've put the five automakers' destinations and powertrain structures into one table—the differences are bigger than expected.
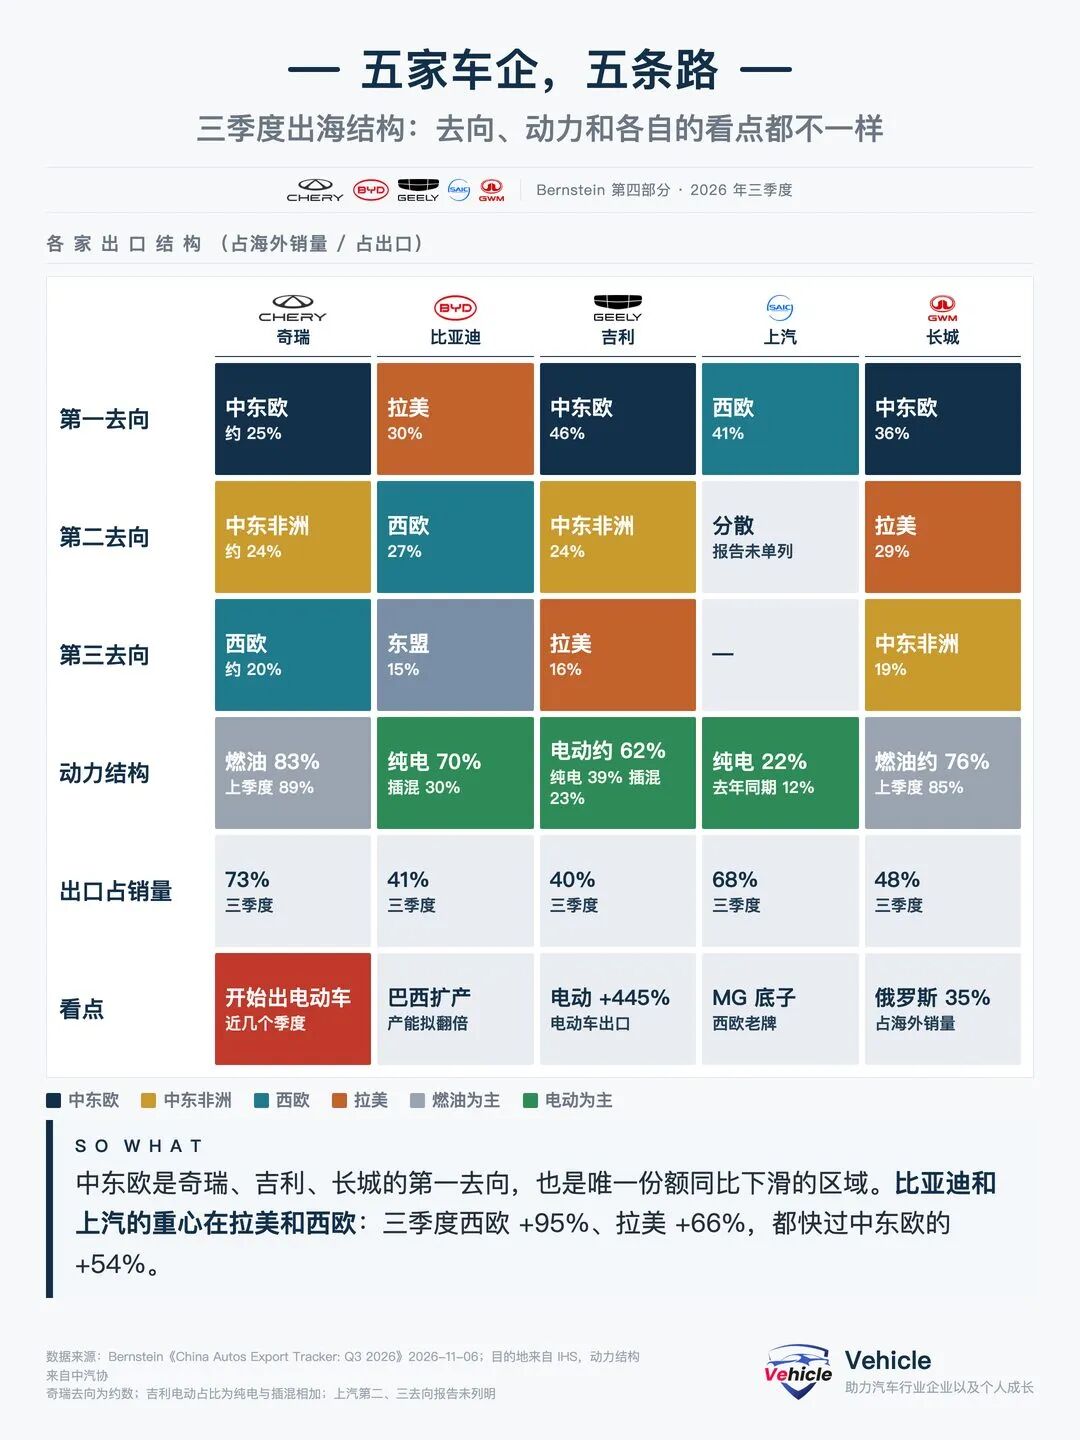
Figure 8 | Q3 export destinations and powertrain mix of five automakers
Chery remains ICE-dominated at 83%, down somewhat from 89% last quarter. Destinations are relatively diversified: Central & Eastern Europe ~25%, Middle East & Africa 24%, Western Europe 20%.
BYD is all NEV: 70% battery electric, 30% plug-in hybrid. Latin America 30%, Western Europe 27%, ASEAN 15%.
Geely has nearly half in Central & Eastern Europe at 46%, followed by Middle East & Africa 24%, Latin America 16%. Battery electric 39%, plug-in hybrid 23%.
SAIC is most dependent on Western Europe at 41%. Battery electric share rose from 12% a year ago to 22%.
Great Wall: Central & Eastern Europe 36%, Latin America 29%, Middle East & Africa 19%; Russia alone accounts for 35% of overseas sales. ICE vehicles ~76%, down from 85% last quarter.
Put together, Chery and Great Wall are still relying on ICE vehicles for volume, but ICE shares are declining.
BYD and SAIC are betting on Western Europe and NEVs, running directly into EU barriers.
Geely's portfolio is most concentrated in Central & Eastern Europe, while Great Wall is highly dependent on Russia—single-market risk is greater.
07 Final thoughts: The window has less than half a year left
Reading to the end, I think the most important thing to remember from this report is a date: April 2027.
Bernstein's judgment is that the export tax rebate cut takes effect then, and automakers will rush to export before that.
Cars rushed out will become inventory at overseas dealers. From Q2 2027, growth will slow, with smaller automakers hit harder.
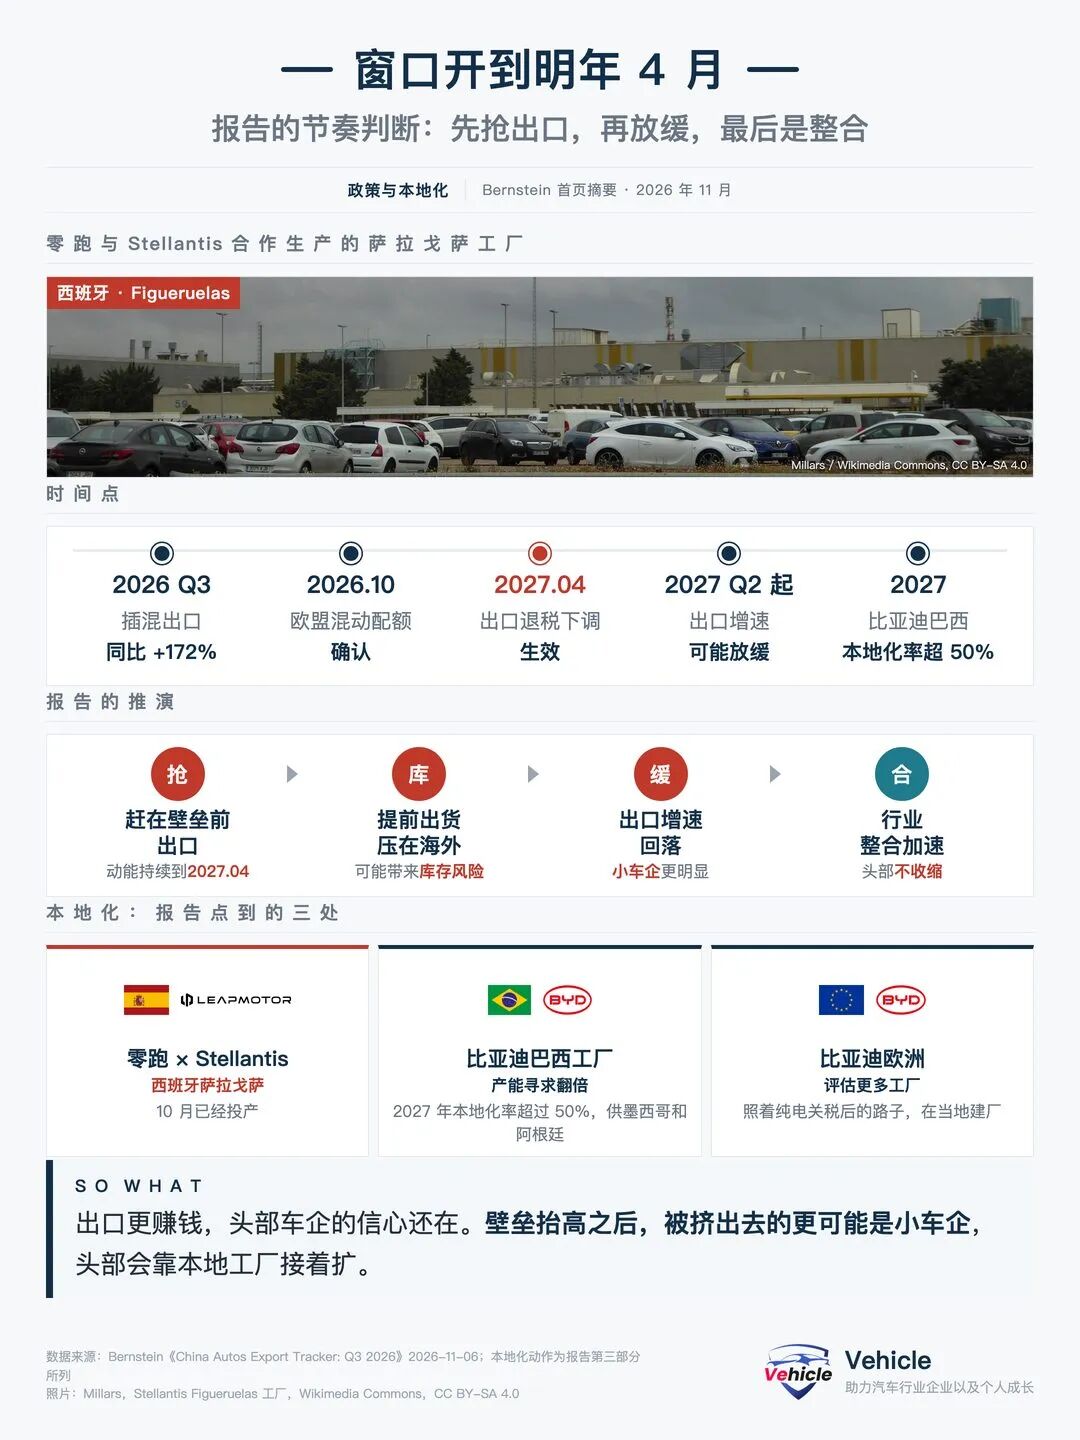
Figure 9 | The window before the rebate cut, and automakers' localization plans
The big automakers' response is to build cars locally.
In October, Leapmotor and Stellantis began production at their Zaragoza plant in Spain. BYD is evaluating more European factories.
BYD's Brazil plant plans to double capacity, with localization rate exceeding 50% by 2027, and will also supply Mexico and Argentina.
The report's conclusion is direct: the higher the barriers, the faster the consolidation, and small automakers without the money to build overseas factories will be squeezed out.
2.73 million units, +72%—these numbers look great.
But what this report wants to remind us is that some of these good-looking numbers are borrowing from next year's threshold in advance.
In the second half of going global, the competition is about who can build cars inside the wall.
This article is based on a Bernstein research report. Forecasts and ratings are the original report's views, including forward-looking judgments, for learning reference only.
That's today's Share. If you find it useful, please like, share, and click "watching," and feel free to share your thoughts in the comments.
References and images: China Auto Going Global Q3 Tracker
- Eunice Lee *Unauthorized reproduction and excerpting strictly prohibited.
-
![]()
October New Energy Sales Review: Exports Nearly 1.5 Times Higher in a Single Month, But Plug-in Hybrids Are Losing Steam
-
![]()
China Auto Q3 Export Tracker: Exports Up 72%, Racing Ahead of Tax Rebate Cuts and Hybrid Quotas
-
![]()
Porsche in China: An Outsider in a Marginal Market?
-
![]()
The Four Major EV-Exclusive "Black Technologies" That Gas Cars Can Only Dream Of
-
![]()
Why Can't Autonomous Driving Get Around Traditional Automakers? Insights from the Waymo-Toyota Collaboration
-
![]()
BMW's Profits Are Heading Toward Zero in Fiscal Year 2026
-
![]()
SAIC Invests RMB 300 Million in New Intelligent Driving Joint Venture as Core Executive Yang Xiaodong Announces Resignation, Drawing Market Attention
-
![]()
Xeon Fusion's 8 Billion Yuan IPO Bid Set for This Week's Regulatory Review in ChiNext Sprint