Dell: Can This Established Player Make a Comeback Amidst the AI Surge?
 07/10 2025
 526
526
As consumers, Dell products, particularly laptops, are a common sight. Beyond personal computers, Dell's servers also form a cornerstone of its offerings. With the burgeoning demand for AI, AI servers and AI PCs have heightened market expectations for Dell.
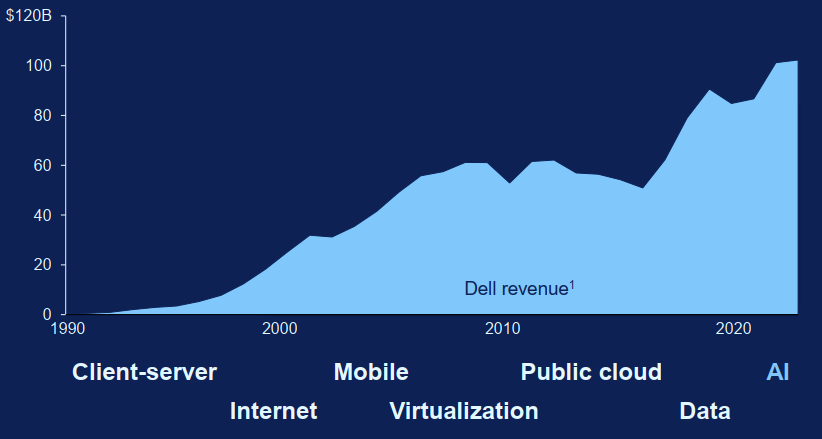
Historically, many brands in the PC market have gradually faded away, whereas Dell's revenue has consistently trended upwards over the past three decades. This is primarily attributed to Dell's adeptness at capitalizing on various technological waves, encompassing PCs, servers, and network equipment. Currently, Dell's annual revenue stands at nearly $100 billion.
Building upon its extensive experience in PCs and servers, Dell has once again ventured into the AI arena. With increasing investments in AI cloud and the potential of AI PCs, the market anticipates Dell to reach new heights. In this neutral discussion, Dolphin will explore the potential opportunities and risks associated with this wave for Dell, a seasoned player in the PC industry.
This article delves into the following questions:
1) After intense competition in the PC market, why has Dell continued to grow?
2) Is Dell competitive in the server market?
3) What is the potential for Dell to transition from PCs to AI PCs?
4) With the support of AI servers and AI PCs, how much investment value does Dell possess?
Below are the details:
I. What Kind of Company is Dell?
Just like its renowned computers, Dell indeed began as a computer company. After the chaotic brand wars of the 1980s, the PC market landscape crystallized in the 1990s, with the top 9 vendors accounting for over half of the market share. At that time, Compaq led the pack, while Dell was still a contender. However, the two companies subsequently embarked on vastly different developmental paths.
Post-2000, Dell expanded beyond PCs into markets such as servers and storage devices, gradually transforming from a sole PC vendor to a full-stack IT service provider. In contrast, Compaq, which adhered to the PC market, eventually exited and was acquired by HP.
Dell's development trajectory has primarily encompassed four pivotal stages: Direct Sales Model -> Internet Empowerment -> Crisis Period -> Reinvention as a Full-Stack IT Service Provider.
a) Startup Phase (1984-1990): Direct Sales Model, Reducing Operating Costs
Dell initially adopted a "direct sales model," bypassing intermediaries and manufacturing computers tailored to customer requirements for direct shipment. This model directly challenged the traditional "manufacturer-distributor-retailer" model represented by Compaq and IBM at the time. Additionally, against the backdrop of the industry's common practice of high inventory distribution, Dell pioneered "Build-to-Order" (BTO), conferring a significant supply chain advantage and securing a place in the PC market.
① Cost Advantage: Eliminating distribution links saved 15%-20% in channel costs, resulting in 20% lower prices for computers of the same configuration.
② Response Speed: Production and delivery were completed within 72 hours after customer orders, as opposed to the traditional model's 2-3 weeks.
b) Expansion Phase (1991-2004): Internet Empowerment and Efficiency Leap
In the 1990s, although Dell ranked among the top five in the PC market, it was still a contender. However, the company seized the opportunity presented by the internet's development. In 1996, Dell combined its direct sales model with the internet, launching an e-commerce platform, achieving a significant leap: the company's daily online sales surged from $1 million to $50 million by 2000.
Leveraging its global production base, Dell further shortened its response time. In 2001, Dell became the global leader for the first time, surpassing Compaq.
During this period, Dell capitalized on its efficiency advantage of a four-day inventory cycle (compared to Compaq's 60 days and HP's 45 days), forcing Compaq into a desperate situation of "losing money if prices are lowered, losing market share if they are not" in price wars.
c) Crisis Phase (2005-2013): Multiple Crises, Market Share Loss
This was a tumultuous period for the company, with product issues and the collective resignation of senior executives directly eroding market trust. During this time, Dell's PC market share plummeted from first to third, and profits significantly declined, ultimately leading the company to choose privatization in 2013.
d) Renewal Phase (2013-Present): Full-Stack Service Provider and New AI Battlefield
After the return of company founder Michael Dell, radical changes were enacted, firmly pushing for a comprehensive transformation towards enterprise information services. In 2016, Dell acquired EMC, a data storage leader, for $67 billion, forming a closed loop of IT services from terminals to data centers.
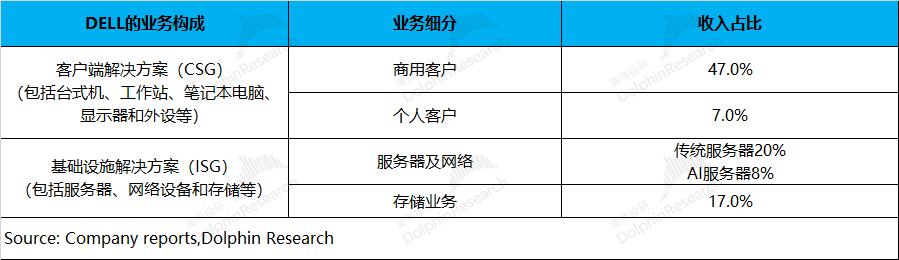
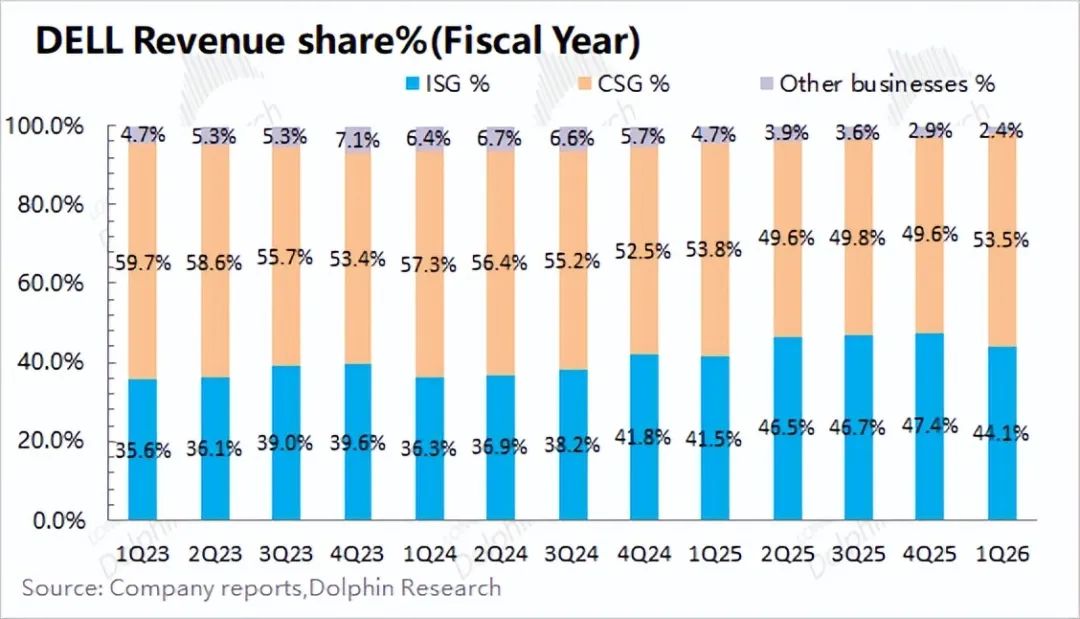
Post-acquisition, Dell transformed from a declining PC supplier to the world's largest company encompassing data storage, servers, and clients. As evident from the company's current financial reports, Dell's core business is primarily divided into two parts: Client Solutions Group (CSG) and Infrastructure Solutions Group (ISG):
① Client Solutions Group (CSG): Dell's original business, accounting for 53%. This business primarily focuses on selling hardware products and related services to businesses and consumers, including desktops, workstations, laptops, monitors, and peripherals.
② Infrastructure Solutions Group (ISG): The key business post-acquisition and integration, accounting for 44%. This segment primarily provides full-stack IT service solutions, encompassing servers, network equipment, and storage.
Previously, the CSG accounted for approximately 60% of the company's business, but with the growing demand for AI servers and related products, the ISG business share has trended upwards, and the current proportion of the two core businesses is nearly 1:1.
Considering the company's overall developmental trajectory, Dell has been able to sustain growth without succumbing to market exit, unlike companies like Compaq, primarily due to the efficiency gains stemming from its "direct sales and supply chain innovation + direct sales online expansion" strategy and the clear strategic positioning of its founder. After transforming Dell into a full-stack IT service provider, the current wave of AI empowerment is poised to usher in a new chapter of growth for the company's server and PC businesses.
II. Main Focus: How Competitive is Dell's Server Business?
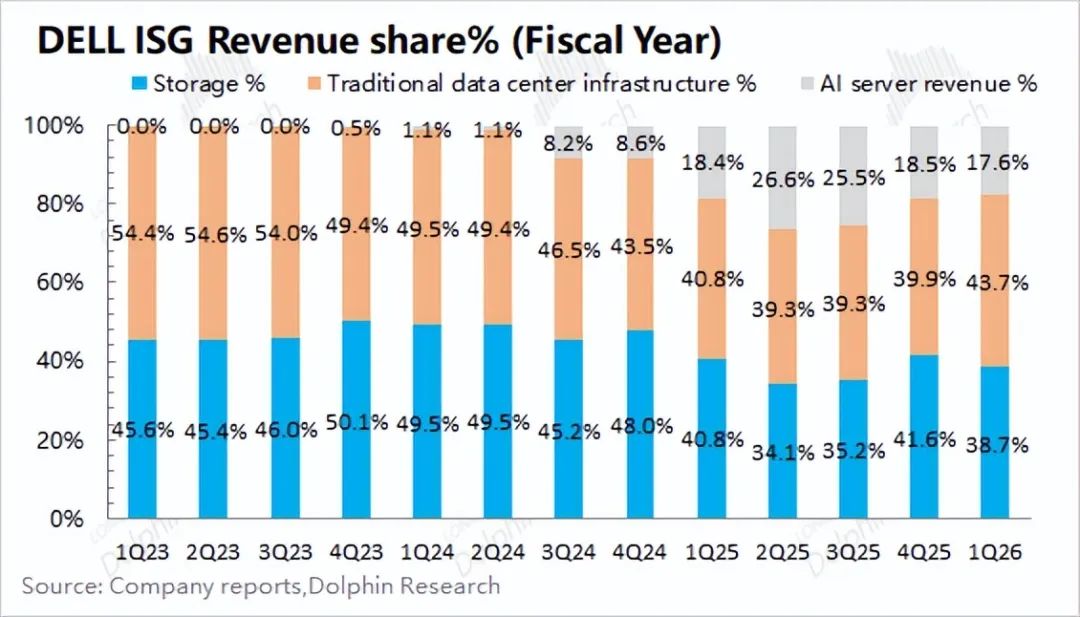
While laptops and other products remain Dell's core business, the company's server business is currently under the market's closest scrutiny. Dell typically divides its ISG business into server networks and storage, and with the proliferation of AI servers, Dolphin estimates that Dell's AI servers account for about 20% of its ISG business.
How is Dell's server business faring? Dolphin analyzes this from three perspectives: the industry chain, market conditions, and competitive landscape.
2.1 Server Industry Chain
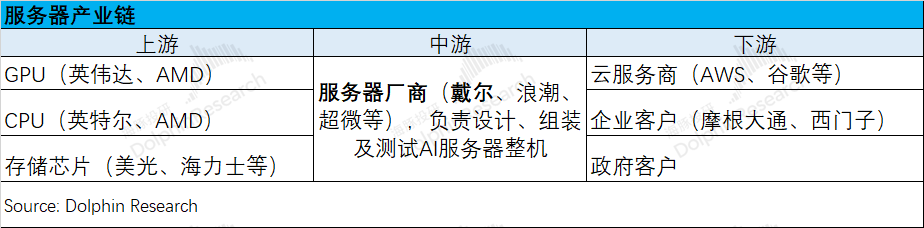
The AI server industry chain spans upstream (core components such as GPUs, CPUs, and storage chips) -> midstream (AI server vendors) -> downstream (cloud service providers, enterprise customers, government customers, etc.).
Dell's server business is primarily situated in the midstream of the industry chain, responsible for designing, assembling, and testing complete server systems. In other words, the company integrates various components such as NVIDIA and AMD GPUs and CPUs into servers and then ships them to downstream cloud service providers like AWS and Google.
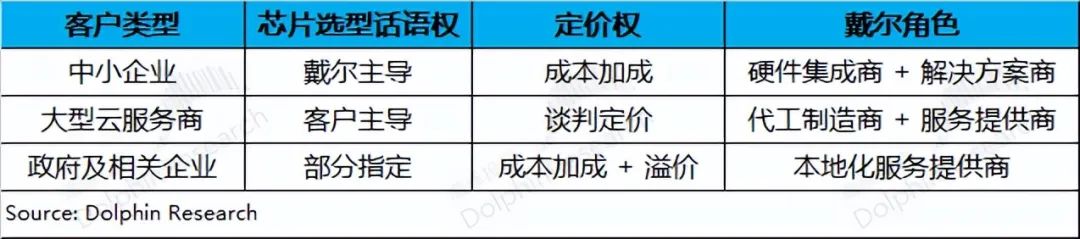
Due to the diverse customer segments it serves, Dell plays two distinct roles: "contract manufacturer" and "hardware integrator":
1) For small and medium-sized enterprise customers: Dell acts as a "hardware integrator + solution provider," primarily offering standardized server products. Dell has complete autonomy in selecting core components like NVIDIA or AMD, and customers can only choose from the models provided by Dell.
2) For large cloud service providers: The company more frequently acts as a "contract manufacturer + service provider." Due to the strong bargaining power of large customers and their relatively clear customization needs, Dell focuses solely on hardware integration and manufacturing. Additionally, due to larger procurement volumes, large customers wield greater bargaining power, leading to thinner profit margins for the company's hardware.
3) For government and related customers: Falling between small and medium-sized enterprises and large cloud service providers, these customers have partially specified needs, and the company primarily provides localized services with moderately profitable margins.
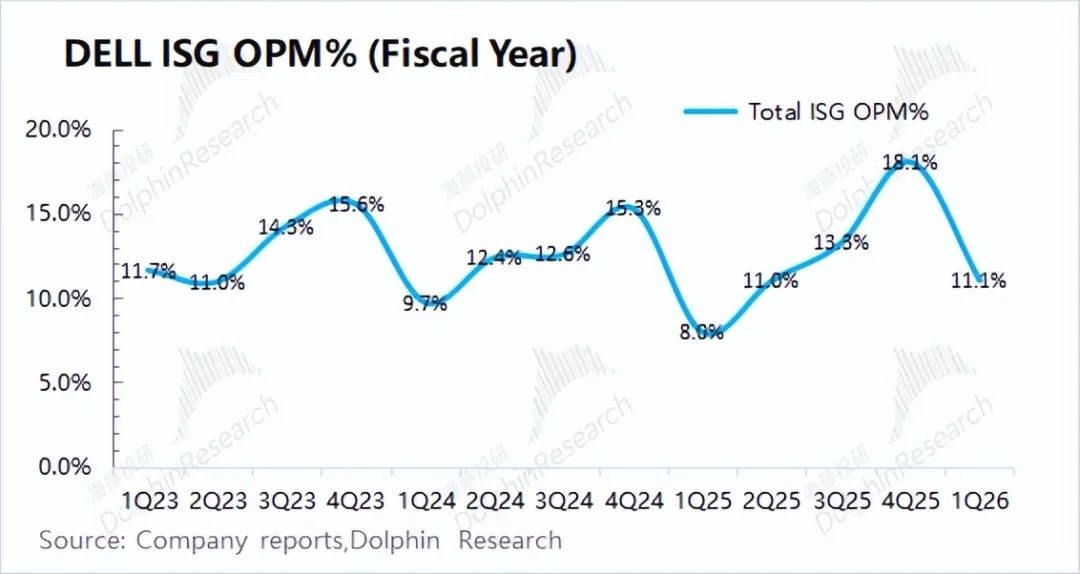
From the perspective of the server industry chain, Dell faces core suppliers upstream such as NVIDIA and AMD, and large cloud service providers like Amazon downstream. The company's bargaining power in the midstream is relatively limited. Compared to NVIDIA's operating profit margin of up to 60%, Dell's profitability is significantly weaker, with the overall operating profit margin of its Infrastructure Solutions Group (ISG) business, including servers, maintained within the 10-20% range.
2.2 Dell's Market Position
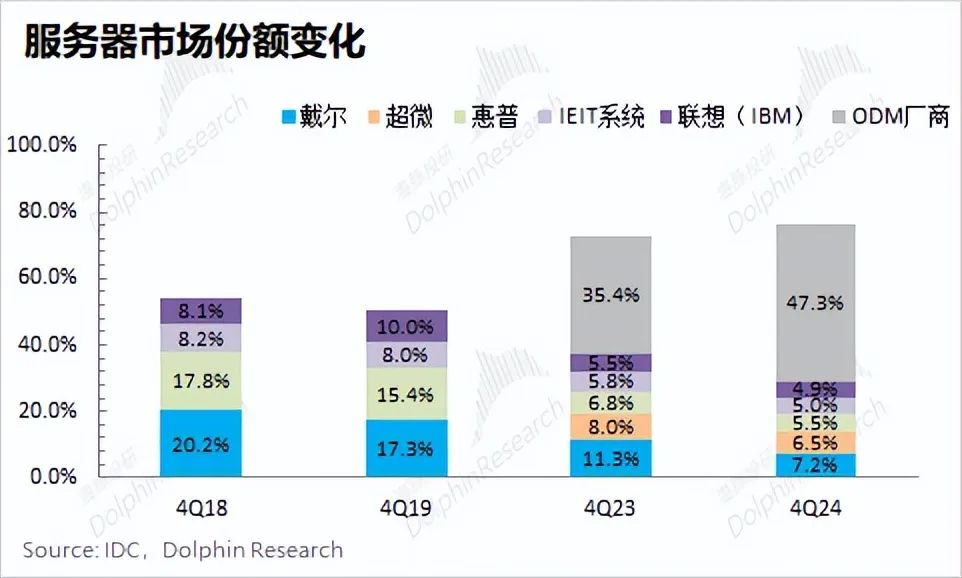
Where does Dell stand in the server market? From the current server market share, it is primarily divided into ODM vendors and branded vendors, accounting for 47.3% and 29% of the market share, respectively. Although Dell ranks first among branded vendors, it only holds a 7.2% market share, with ODM vendors still being the most preferred by downstream customers.
What do ODM vendors primarily do, and why have they become the most popular choice in the market? Here, we can first understand the specific delivery levels of servers, which can be primarily divided into 12 major levels.
Specifically: L1-L10 primarily focus on the manufacturing of complete server systems, which can be directly delivered at this stage; while L11-L12 include cables, racks, and subsequent operation and maintenance.
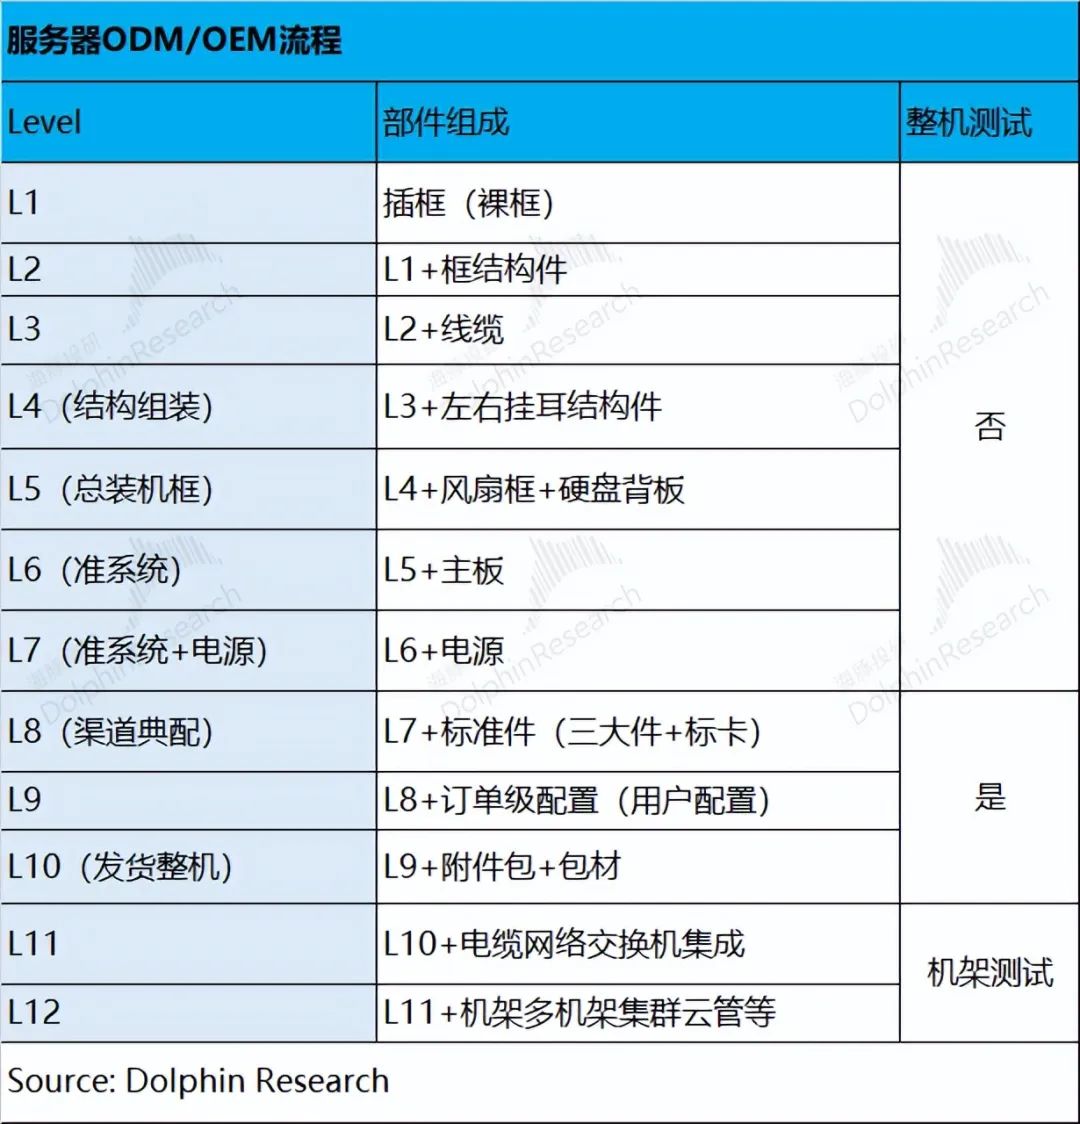
Comparing ODM vendors and branded vendors in server manufacturing and delivery, we can see that:
a) ODM vendors (such as Foxconn, Quanta, etc.): Primarily act as contract manufacturers, focusing on hardware manufacturing (covering L1-L10). After completing L10, they ship complete systems.
b) Branded vendors (such as Dell, HP, etc.): As brand owners, they provide full-stack solutions (covering the entire L1-L12). On top of ODM hardware manufacturing, they also add cable network switches, multi-rack clusters, and provide subsequent operation and maintenance services.
Combining (a+b), it becomes evident that branded vendors like Dell undertake more tasks than ODM vendors, resulting in significantly higher gross margins for branded vendors. Currently, Dell and HP's server gross margins are 20-30%, while ODM vendors like Foxconn have gross margins of only around 6%. Therefore, Dell sometimes outsources part of its orders, allowing it to earn the difference in gross margins.
In this scenario, large cloud service providers may reason, "We have staff for operation and maintenance, existing contract manufacturers, and large demand volumes. Why pay more to intermediaries like Dell?" Consequently, large cloud service providers have opted to eliminate the "middleman" and directly place orders with ODM vendors. Since large cloud service providers are the primary buyers in the server market, this has led to ODM vendors accounting for approximately half of the market share.
Furthermore, as companies like Google and Amazon increase their investments in custom ASICs, they will increasingly rely on ODM vendors. While ODM vendors provide hardware integration and manufacturing capabilities (L1-L10), Broadcom and Marvell will complement network and high-speed interconnect capabilities (L11+), steering large cloud service providers further towards the ODM Direct model.
Although branded vendors like Dell and HP have notable advantages in technology, operation and maintenance, and response, the price advantage of ODM vendors directly influences the decision-making of large cloud service providers.
Therefore, Dell currently holds a relatively small share among top cloud service providers, with its core customers primarily being second-tier cloud service providers, including Tesla, Oracle, CoreWeave, Lambda Labs, etc.
With the substantial increase in capital expenditures by top cloud service providers in the current cycle, Dell's benefit is not as pronounced as that of ODM vendors. For Dell, the primary driver of server business growth stems from second-tier and emerging cloud service providers, as well as other government and enterprise customers.
2.3 Dell Server Product Performance and Target Customers
Due to the customized needs and relatively complete teams of large cloud service providers, coupled with substantial capital expenditures, ODM manufacturers have a more pronounced price advantage. Dell, leveraging its in-depth cooperation with NVIDIA and comprehensive operation and maintenance system, is primarily favored by customers in the enterprise and government sectors. So, how competitive are Dell's server products in the market?
We will compare the core performance of server products from various companies:
a) GPU Density: Dell > Supermicro > ODM Manufacturers, HP HPE (8 GPUs/node, requiring multi-node stacking);
b) Network: Dell and Supermicro both support 400G InfiniBand, with ODM manufacturers specializing in customized high-speed interconnect solutions.
c) Liquid Cooling Maturity: Dell and Supermicro lead the way in liquid cooling technology, followed by HP, with ODM manufacturers trailing behind.
d) Operation and Maintenance, and Response: Dell and HP excel in operation, maintenance, and response, followed by Supermicro, with ODM manufacturers ranking last.
e) Price for the Same Configuration: Dell and HP offer higher prices for the same configuration compared to Supermicro and ODM manufacturers.
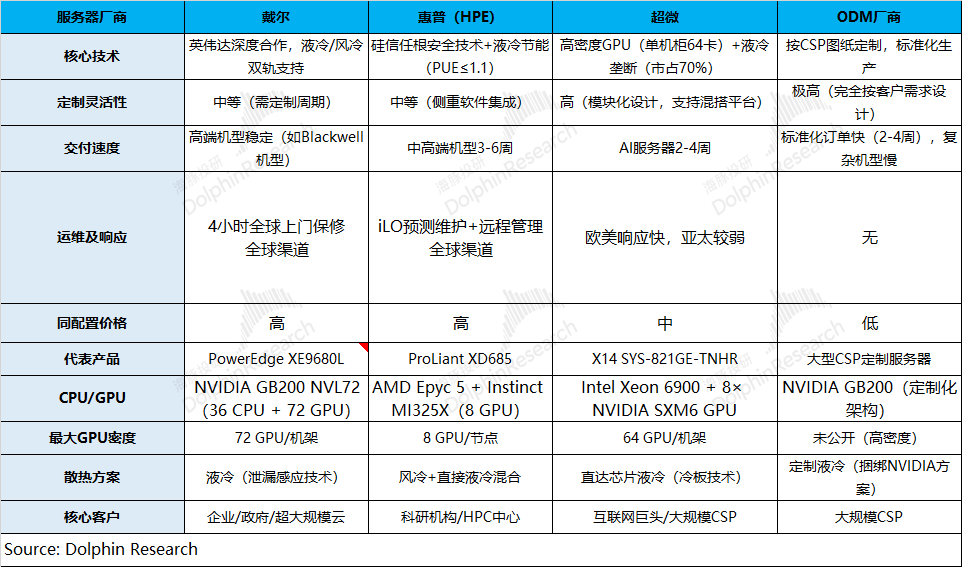
From the comparison, Dell stands out with superior performance, configuration, operation, and maintenance, which justifies its higher pricing compared to competitors with similar configurations. Regarding gross profit margins, Dell and HP maintain margins of around 20-30%, while Supermicro's margin is around 10%, and ODM manufacturers typically have margins of 5-6%.
Based on this analysis, Dolphin Insights has developed a decision tree flowchart for server demand (below):
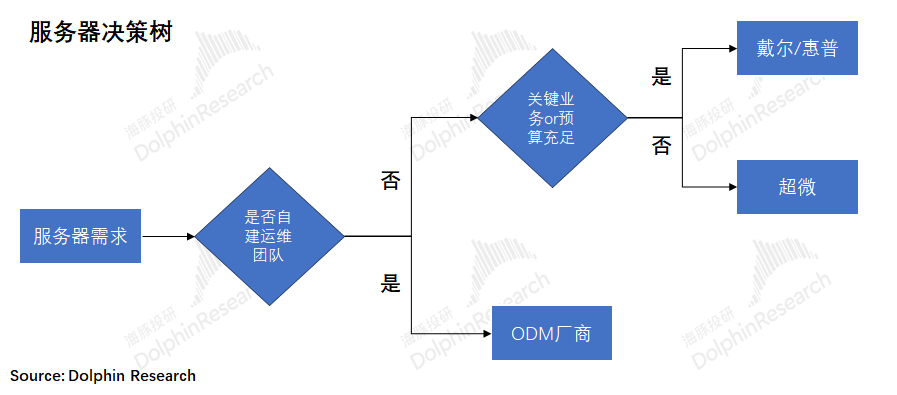
Each company's server products are specifically tailored to different customer segments:
① Dell Servers: Ideal for mission-critical industries such as finance, healthcare, and government, where reliability is paramount.
② HP Servers: Suitable for educational and government applications, offering cost savings on electricity bills due to their liquid cooling energy-saving design.
③ Supermicro Servers: Preferred for AI training clusters that prioritize configuration and cost-effectiveness, accepting less robust operation and maintenance services.
④ ODM Servers: Targeted at large cloud service providers like Google and Amazon, which require cost reduction and possess self-research and self-construction capabilities.
2.4 Server Market Space
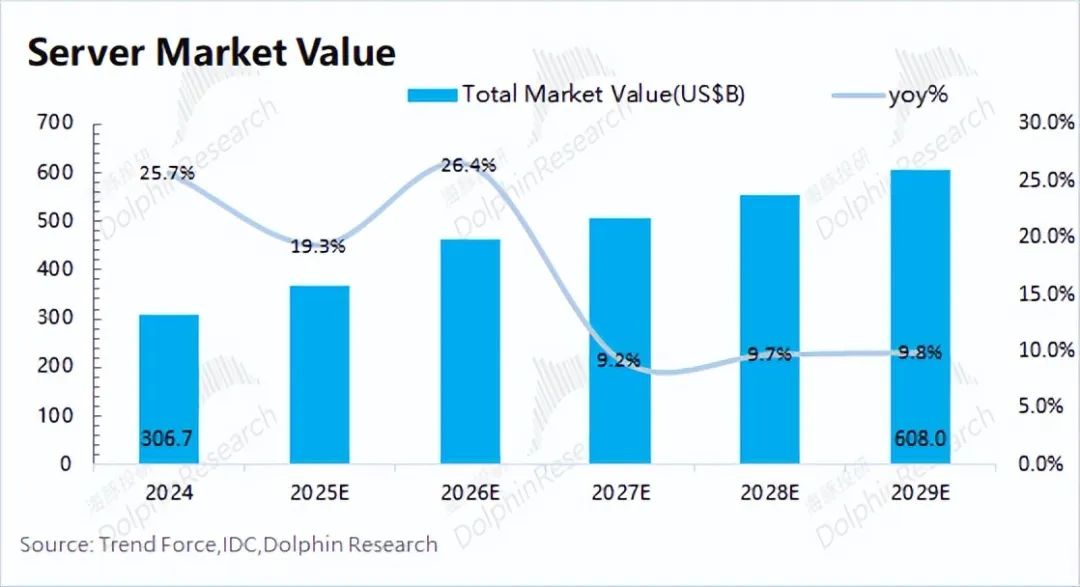
Combining market forecasts from IDC and TrendForce, the total server market size is projected to grow from $306.7 billion in 2024 to $608 billion in 2029, at a compound annual growth rate of 13.5%, primarily fueled by the AI server market.
Breaking down the specific volume and price dynamics of the server market:
a) Traditional Servers: With overall server shipments remaining stable at around 13-14 million units annually, traditional servers account for roughly 11-13 million units. Assuming an average price of $0.5 million per traditional server, the market for traditional servers corresponds to a space of approximately $55-60 billion, with limited growth potential.
b) AI Servers:
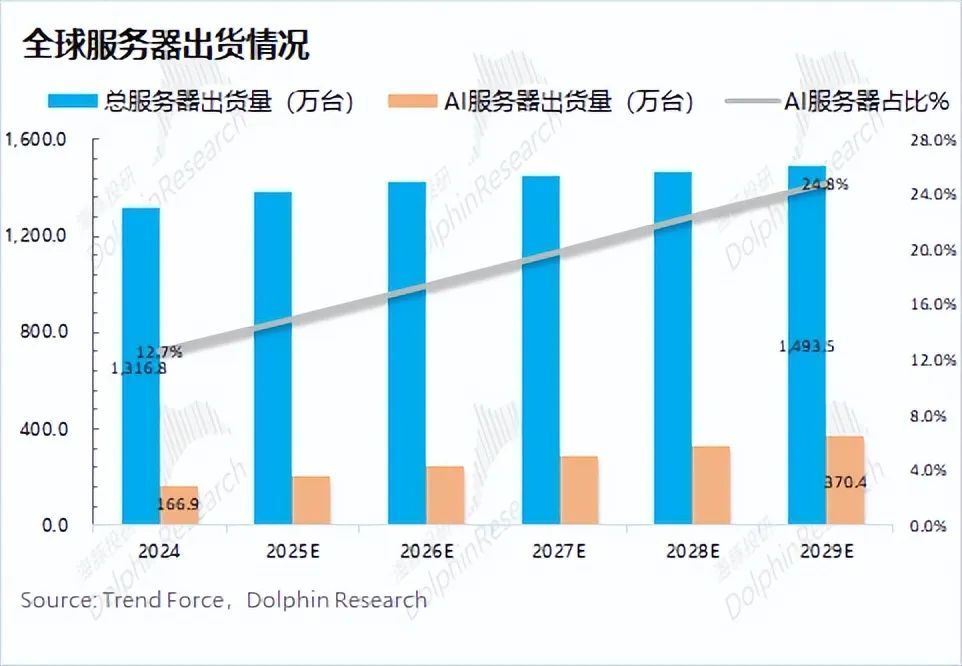
① In terms of volume: According to TrendForce data, the compound annual growth rate of global AI server shipments over the past five years has been 27%, closely matching the combined capital expenditure growth rate of the four major cloud service providers (27.7%). Large cloud service providers are the primary drivers behind this server market growth.
On this basis, Dolphin Insights anticipates a slight deceleration in AI server shipment growth, maintaining a compound annual growth rate of 15.6% over the next five years. Currently, AI servers account for about 14% of total market volume, and this share is expected to increase to 25% by 2029.
② In terms of price: Combining market data, Dolphin Insights estimates the average price of AI servers to be around $150,000-$160,000, significantly higher than that of traditional servers. Currently, high-end AI servers fetch prices exceeding $1 million, pushing up the overall average price. As server performance and integration improve, high-end product prices are expected to continue rising. Meanwhile, there remains a robust demand for mid-to-low-end AI servers. Dolphin Insights assumes that the overall average price of AI servers will fluctuate within a narrow range.
③ AI Server Market Space: Considering both volume and price, the AI server market is projected to grow to $551.8 billion by 2029, with a compound annual growth rate of 15.8% from 2025 to 2029.
Combining (a+b), Dolphin Insights expects the overall server market size to exceed $600 billion, with a compound annual growth rate of 13.5%. The surge in demand for AI servers has expanded the server market from the previous $50-60 billion (corresponding to traditional servers) by tenfold. By 2029, although AI servers will account for only 25% of shipments, they will contribute nearly 90% of the market size.
2.5 AI Servers and Dell's Advantages
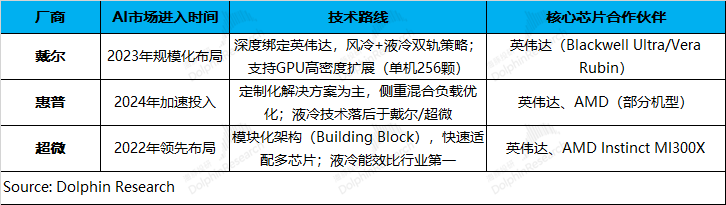
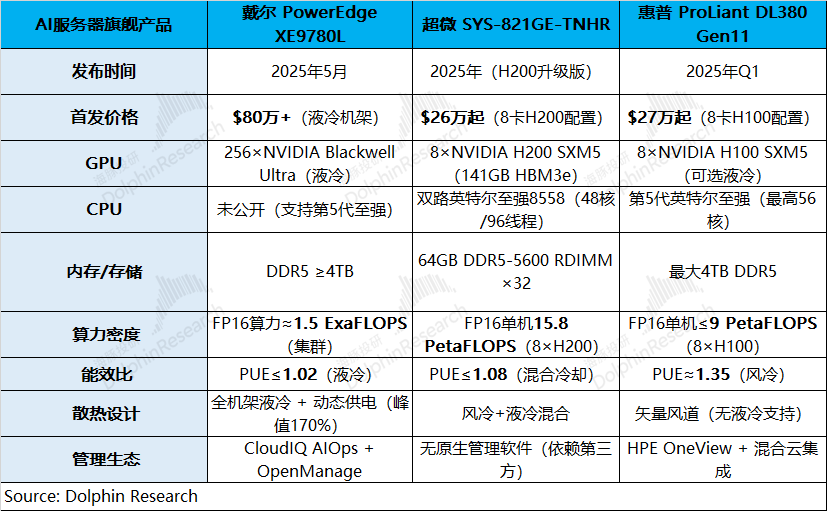
Server brand OEMs (Dell, HP, Supermicro) entered the AI server market successively after 2022, each with its unique characteristics:
a) Dell: Initiated its layout in 2023, with deep ties to NVIDIA. b) HP: Accelerated investments in 2024, forming collaborations with both NVIDIA and AMD but lagging behind in liquid cooling technology. c) Supermicro: Was the first among the three to shift focus to the AI server field, partnering with both NVIDIA and AMD and boasting relatively advanced liquid cooling technology.
Comparing the flagship AI server products of these three manufacturers reveals that Dell's offering is relatively ahead of Supermicro and HP. Leveraging its deep collaboration with NVIDIA, Dell's PowerEdge XE9712, delivered to CoreWeave, is also the world's first AI server system based on GB300, positioning Dell ahead of its competitors in overall progress.
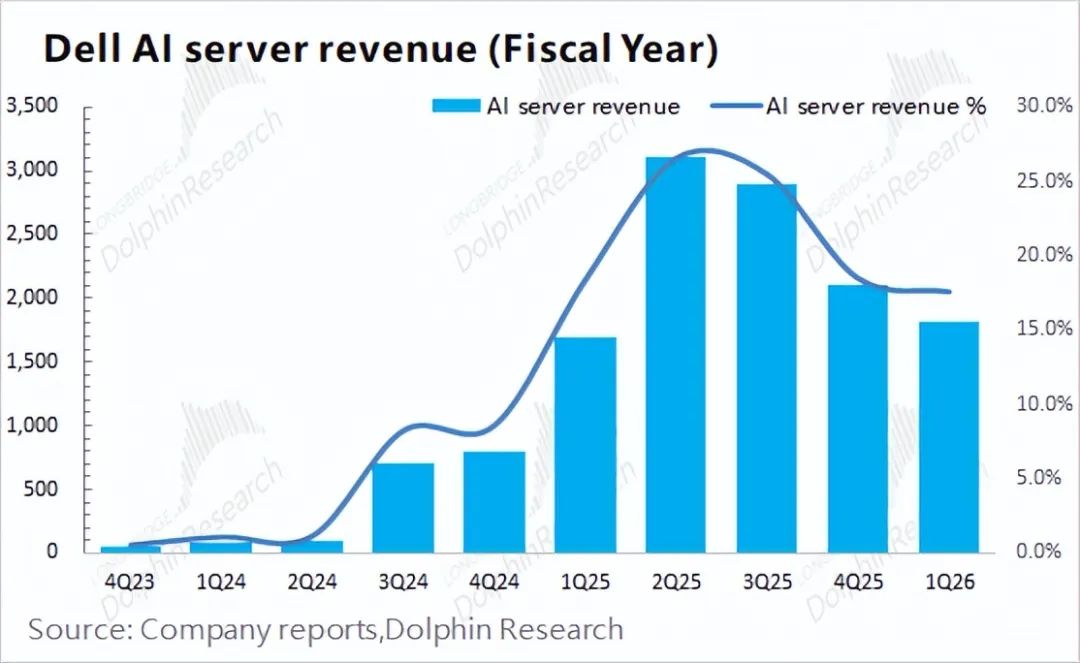
Since Dell embarked on a large-scale AI server deployment in 2023, the company's AI server revenue has soared, approaching $10 billion for the full year 2024.
Dell's AI servers, due to their deep collaboration with NVIDIA, have experienced a sequential decline in revenue over the past two quarters, primarily impacted by the adjustment and transition of GB series chips.
With the ramp-up of GB300 mass production and driven by demand from second-tier and emerging cloud service providers like CoreWeave, Dell's AI server revenue is anticipated to surge in the second half of the year, resulting in a "front-loaded decline, back-loaded growth" pattern for the full year.
This analysis of Dell's server business concludes here. The next article will delve into the PC business, particularly the opportunities in AI PCs, along with an overall value judgment of the company. Stay tuned.
< End here >
- END -
// Reprint Authorization
This article is an original work by Dolphin Insights. For reprint requests, please obtain authorization.
// Disclaimer and General Disclosure Note
This report is intended for general data use only, designed for general browsing and data reference by users of Dolphin Insights and its affiliated entities. It does not consider the specific investment objectives, product preferences, risk tolerance, financial situation, or special needs of any individual receiving this report. Investors must consult independent professional advisors before making investment decisions based on this report. Any person making investment decisions using or referring to the content or information in this report does so at their own risk. Dolphin Insights shall not be held liable for any direct or indirect responsibilities or losses arising from the use of the data contained in this report. The information and data in this report are based on publicly available sources and are for reference purposes only. Dolphin Insights strives to ensure but does not guarantee the reliability, accuracy, and completeness of the relevant information and data.
The information or opinions expressed in this report should not be construed or deemed as an offer to sell securities or an invitation to buy or sell securities in any jurisdiction. They do not constitute recommendations, inquiries, or suggestions regarding relevant securities or related financial instruments. The information, tools, and data in this report are not intended for or to be distributed to citizens or residents of jurisdictions where the distribution, publication, provision, or use of such information, tools, and data would violate applicable laws or regulations or subject Dolphin Insights and/or its subsidiaries or affiliated companies to any registration or licensing requirements in such jurisdictions.
This report reflects the personal views, insights, and analysis methods of the relevant creative personnel and does not represent the position of Dolphin Insights and/or its affiliated entities.
This report is produced by Dolphin Insights, and the copyright belongs solely to Dolphin Insights. Without Dolphin Insights' prior written consent, no institution or individual may (i) produce, copy, reproduce, photocopy, forward, or make any form of copies or reproductions in any manner, and/or (ii) directly or indirectly redistribute or transfer to other unauthorized persons. Dolphin Insights reserves all relevant rights.
-
![]()
Internet Valuation Logic Shifts: From Scale Narrative to Profit Accountability
-
VOYAH Struggles to Find Its Niche in the Competitive Auto Market
-
![]()
Maxwell Technologies Gains Indirect Stake in Precision Optics via New Venture
-
![]()
Raising 1.8 Billion! This Domestic Optical Inspection 'Little Giant' is Going Public
-
China's AI 'Normandy Moment': The Explicit and Implicit Threads of BATL
-
![]()
Starting at 4999 Yuan! Nubia RedMagic Gaming Tablet 5 Pro Review: Impressive Performance, But Hefty Price Tag
-
![]()
ByteDance Initiates First Major Management Reform
-
![]()
AI is Quietly Destroying a Trillion-Dollar Industry