AI Computing Power: From Feast to ‘Leftover Feast’?
 07/14 2026
 488
488
In Dolphin Research's previous analysis, 'AI Struggles at Amazon: Will There Be a Comeback?', we explored AWS's AI strategy from several perspectives. From its self-developed chips, collaboration with Anthropic, and its model capabilities, we observed a notable improvement in Amazon's overall AI capabilities, significantly narrowing the gap with leading player Google.
Two points piqued Dolphin Research's curiosity: first, the profit margins of AI services for cloud providers seem better than expected; second, cloud providers currently rely heavily on their model partners, with revenue growth largely dependent on the increased usage of AI models.
Therefore, in this piece, Dolphin Research further delves into a more detailed quantitative perspective to explore:
1. What is the logic behind the improvement in profit margins for cloud providers? What is the potential magnitude of this improvement?
2. To what extent does the computing power demand from model developers drive the revenue of cloud providers? What are the potential implications of over-reliance on model developers for cloud providers?
3. From the above perspectives, what guiding significance does this have for industry investment preferences within the AI supply chain?
The following is a detailed analysis.
1. Exploring Changes in Gross Profit Margins of AI Cloud Services and the Underlying Reasons
According to our previous overview, one reason why the profit margins of AI cloud services are not as poor as expected is that, in terms of revenue structure, higher-margin MaaS/TaaS services have partially replaced lower-margin 'bare metal' IaaS services.
From a first-principles perspective, the decisive factor influencing the profit margins of cloud providers is clearly their bargaining power within the entire AI supply chain.
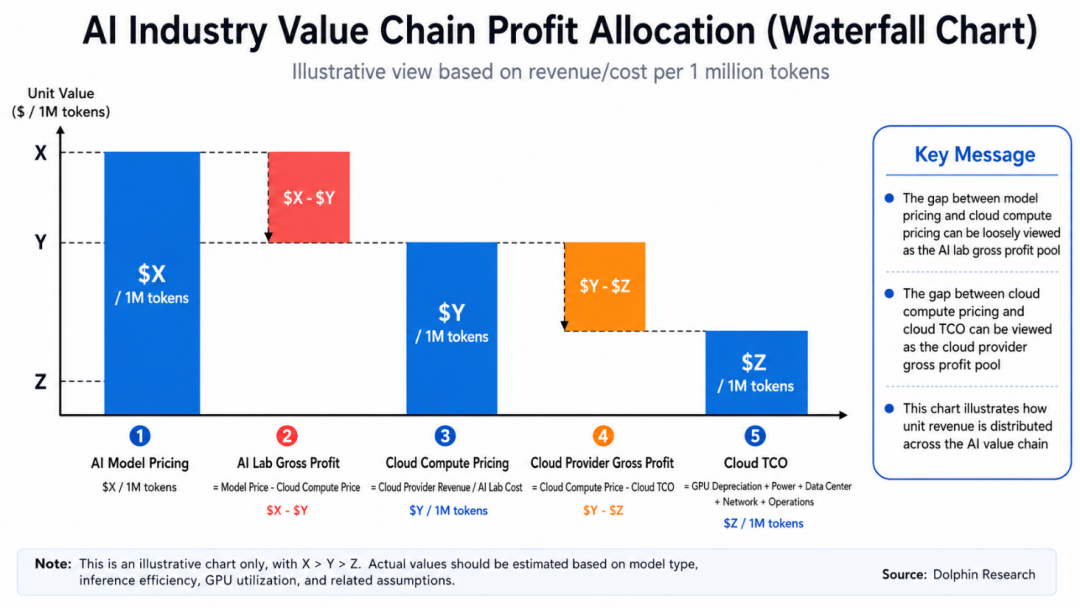
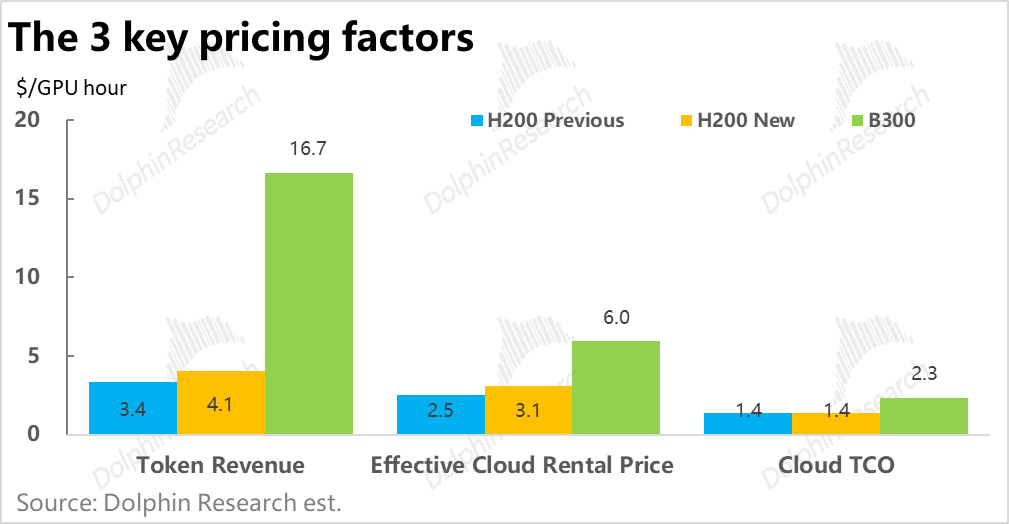
Alternatively, consider the following quantifiable pricing factors: the price end-users pay for using AI large models, the price AI Labs pay for computing power, and the cost for cloud providers to supply computing power (which can be further divided into relatively fixed operational costs like electricity and more variable hardware prices). The following section examines the changing trends of these three pricing factors from the perspective of unit Token economics, as well as their impact on the profit margins of cloud providers and the entire supply chain.
1.1 How are the prices of models, cloud services, and chips changing?
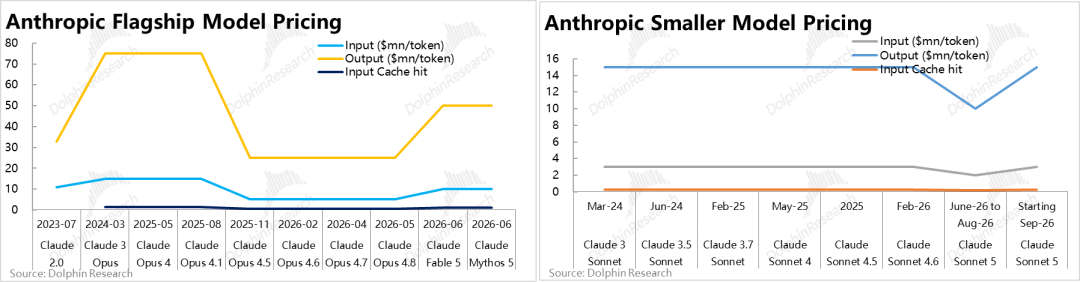
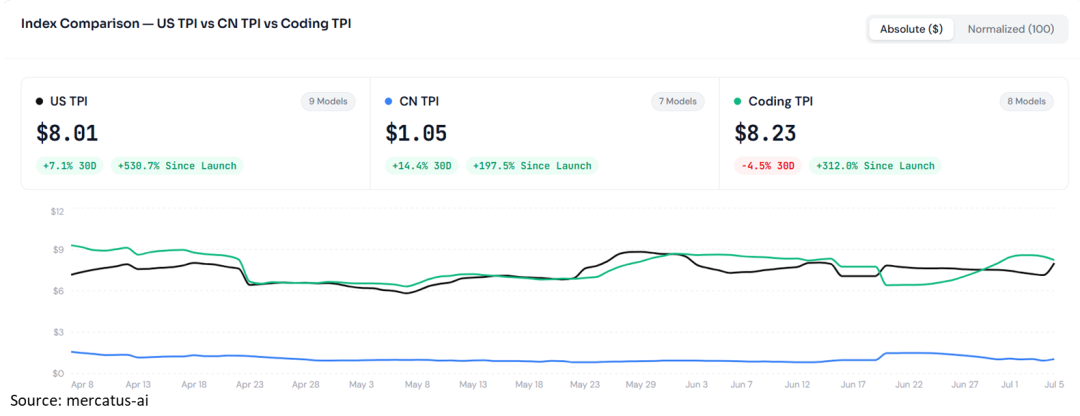
a. Large model pricing: neither inflationary nor deflationary: First, regarding the usage prices of large models, considering only the pay-as-you-go model (excluding subscription models), whether looking at the official pricing from Anthropic or the real Token price indices compiled by third-party institutions (derived from a mix of usage prices for Input/Output/Cache-hit across various model tiers), it is evident that AI model prices have not trended upwards with model iterations and capability improvements. Instead, they have fluctuated within a range or remained flat.
b. Significant deflation in unit computing costs: Unlike the relatively stable unit Token pricing of models across iterations, the cost of generating unit Tokens has shown a clear deflationary trend over time. (Note: The metric used here is TCO proposed by SemiAnalysis, referring to the total cost of computing power, including both the Capex component for construction and the Opex component for ongoing operations.)
Based on testing with the Qwen 3.5 model, it is evident that the cost of generating unit Tokens has significantly decreased with each chip generation. For example, the cost per million Tokens for the latest GB200 NVL72 is approximately one-third to one-fourth that of the H100/200.
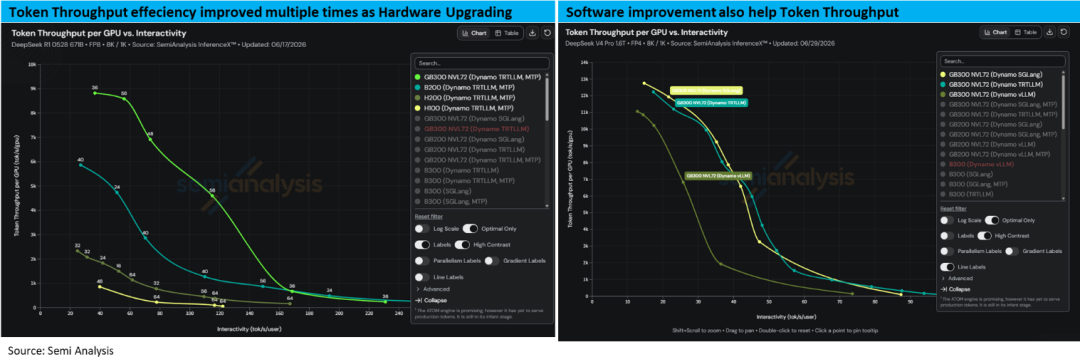
The reason behind this cost deflation is that as chip costs increase, the price increase is far smaller than the improvement in Token generation efficiency. Moreover, this significant efficiency gain is attributed to joint improvements in both hardware and software.
At the hardware level, taking DeepSeek R1 as an example, under the same engineering arrangement, the GB300 can output Tokens per second roughly 4 to 10 times faster than the H200. At the software/engineering level, taking DeepSeek V4 as an example, even when based on the same GB300 hardware but with different engineering arrangements, the output efficiency can vary by 2 to 4 times.
Given efficiency differences of up to 10x, although a single GB300 is significantly more expensive than an H200, the price difference does not exceed 2 times. With chip performance surging and prices rising moderately, the deflationary effect dominates.
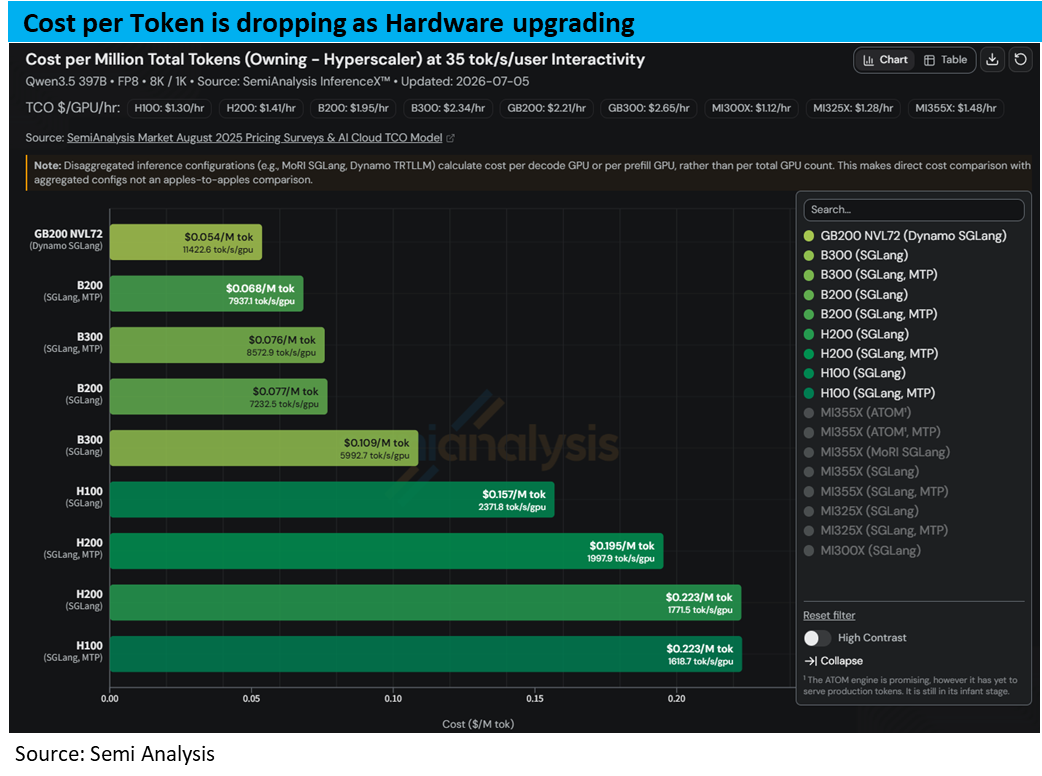
c. Based on the above information, a simple calculation shows that if the comprehensive price of the Qwen 3.5 model is $1 per million Tokens, considering only the single factor of the decrease in the unit Token generation cost of chips—from $0.2 (H200) to approximately $0.05 (GB300)—the gross profit margin per Token generated can increase by about 15 percentage points.
Summarizing the core logic behind this phenomenon, the chip industry in the AI era still largely maintains the 'technological deflation effect,' where performance significantly improves with each generation while chip prices remain relatively stable. In other words, a substantial portion of the performance gains from each chip generation is passed on downstream. However, the pricing of AI (leading) models does not pass on these performance gains to end-users but retains them as profits.
1.2 Have cloud providers raised their prices?
However, as mentioned earlier, the profit between 'end-user pricing' and 'hardware operating costs' is shared by cloud providers and AI model companies. The allocation of these profits between cloud providers and AI model companies is primarily determined by the cloud providers' computing power rental prices. If cloud computing power pricing remains largely stable, the 'additional gross profit margin' is almost entirely taken by AI Labs. If cloud computing power pricing trends upwards, cloud providers can also share in some of the 'additional gross profit margin.'
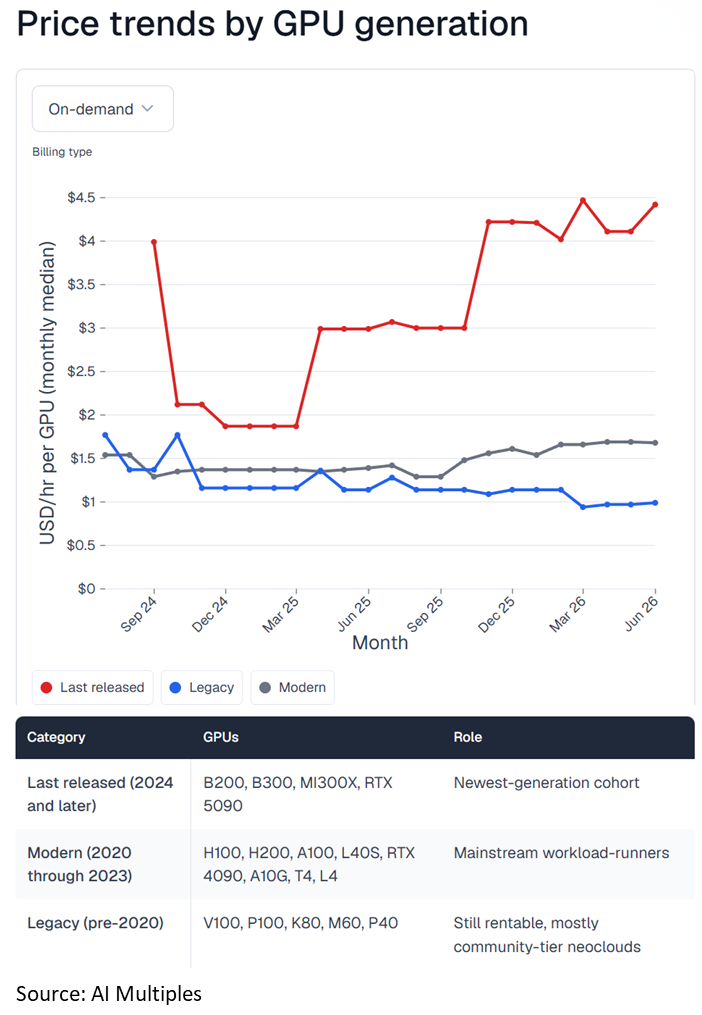
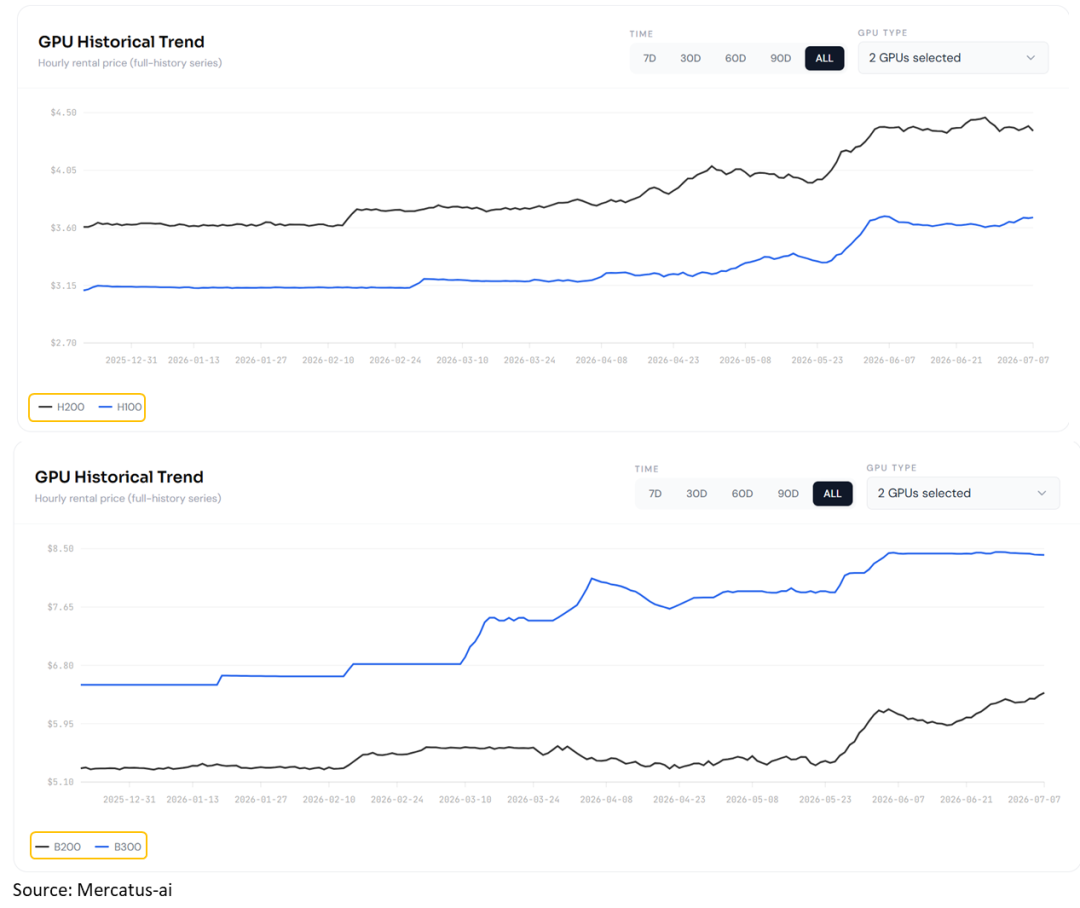
So, what is the reality? Compiling on-demand prices for cloud leasing from multiple sources reveals a consistent trend: cloud computing power pricing has indeed entered a noticeable upward cycle since the end of 2025. This suggests that, in a situation of significant undersupply of computing power, cloud providers' bargaining power has indeed improved. Therefore, in addition to the positive changes in revenue structure, even the gross profit margins of 'bare metal' IaaS leasing business should have improved. Specifically:
a. The largest price increases have been for the latest chip generations: From a generational perspective, cloud leasing prices for the latest GPU generations (such as B200 or newer) have increased the most significantly, rising by approximately one-fourth to one-half since the end of 2025, according to various data sources.
b. Older mainstream chips are also seeing price increases: Leasing prices for currently mainstream GPU chips in the market (H200 or earlier products) have also increased by a certain margin, around 15% to 20%, since the end of 2025.
Logically, the leasing prices of these previous-generation chips should gradually decrease with technological and temporal iterations. The recent upward trend in cloud leasing prices, including for chips that have been on the market for 3 to 5 years, on the one hand, validates the current severe undersupply of computing power (willingness to pay a premium for relatively outdated chips), and on the other hand, reflects the improving bargaining power and profit margins of cloud providers.
Only chips that are even older and lower-performing than the A100 (pre-2000) are showing signs of being 'gradually replaced,' with average leasing prices decreasing by about one-third from the end of 2024 to the present. However, they are not entirely obsolete and can still contribute revenue at lower prices.
Another crucial signal is that older chips do not become 'idle assets' as new chip capabilities significantly improve but continue to contribute cash flow.
2. How much have the gross profit margins of cloud providers' AI revenue improved?
2.1 Joint benefits of software and hardware technological advancements
From the above, we conclude that the gross profit margins of both model developers and cloud providers' AI computing power businesses are improving (note that this does not mean the gross profit margins of AI computing power businesses have caught up with or exceeded those of traditional computing power leasing). However, this conclusion is primarily based on qualitative and trend-based judgments. Next, we will quantitatively estimate how much the gross profit margins of model developers and cloud providers may have changed.
To simplify the issue, the following calculations focus on 'inference gross profit margins,' considering only the revenue generated from inference and its direct computing power costs, excluding other factors such as training/research and development costs. Additionally, since the subsequent calculations are based solely on the Qwen 3.5 model, the absolute values of the estimated profits/profit margins may not reflect reality. However, since the model remains unchanged, the trends and relative levels of profit margin changes are still meaningful.
Below, we use a controlled variable approach to conduct two comparisons: one from a longitudinal perspective, controlling for consistent underlying hardware and examining changes in gross profit margins over time due to improvements in software/engineering capabilities leading to increased Token generation efficiency and cloud leasing price increases.
The other is from a horizontal (Note: ' horizontal ' should likely be 'lateral' or 'cross-sectional') perspective, comparing changes in gross profit margins under different chip scenarios based on the latest pricing and technology (Note: all data below are estimated from the perspective of a single GPU).
Directly presenting the conclusions:
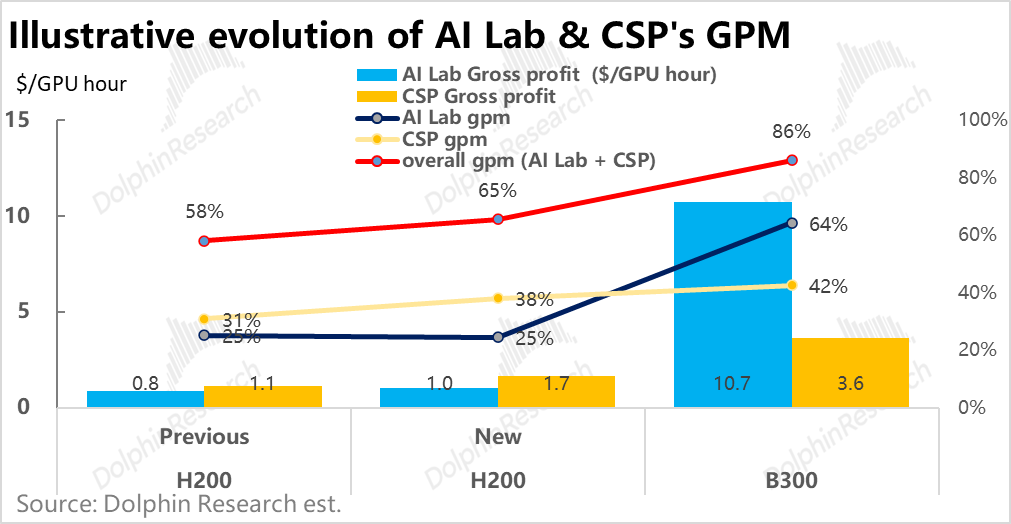
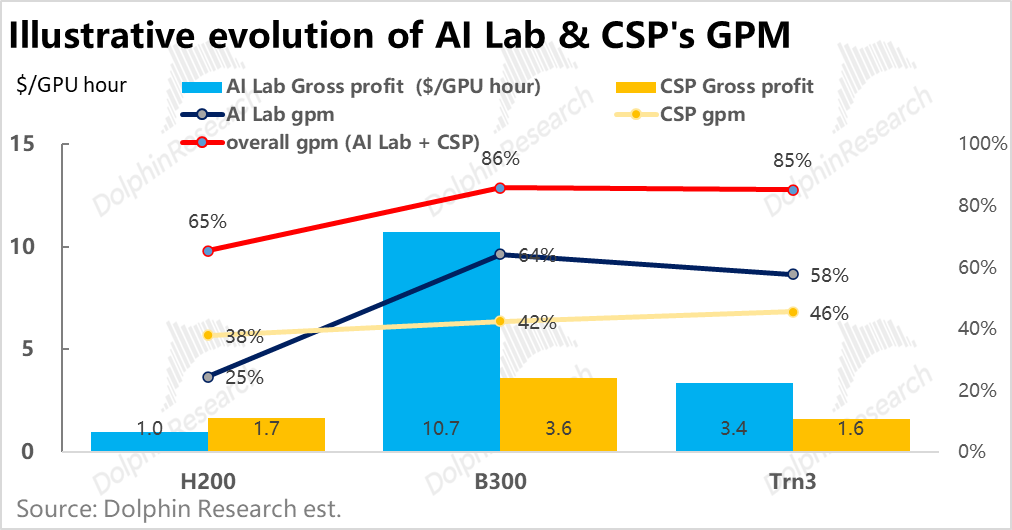
a. With the hardware remaining H200 and considering only the approximately 20%+ increase in Token generation efficiency due to software technological progress over time, along with a roughly 20% increase in H200 leasing prices after September 2025, the AI Lab's inference gross profit increased from $1.2 to $1.4. Since unit revenue also increased, the gross profit margin changed little.
The cloud provider's gross profit increased from $0.8 to $1.7 (gross profit per GPU per hour, based on this metric), with the gross profit margin increasing from 31% to 38%.
It should be noted that since AI Labs and cloud providers generally have long-term agreements, their actual leasing prices may not increase in line with real-time prices.
b. Based on the latest software technology and cloud leasing prices, but comparing B300 with H200 in terms of hardware, due to the explosive improvement in B300's output efficiency (approximately 8 times that of H200), while the unit leasing price of B300 is less than 2 times that of H200, the AI Lab's unit gross profit (contribution per GPU per hour) increased significantly from $1.4 to approximately $11.6, with the corresponding gross profit margin increasing from 35% to 69%.
The cloud provider's unit gross profit margin increased from $1.7 to $3.6, with the gross profit margin increasing from 38% to 42%.
c. Combining the above comparisons, the comprehensive unit gross profit improvement brought about by the joint progress of software and hardware technologies, comparing GB300 with H200 under older technology, is quite substantial, increasing from less than $2 to over $14. Even though the vast majority of this incremental profit is taken by model developers, cloud providers, while only 'sipping the soup,' can still enjoy a gross profit margin improvement of over 10 percentage points.
However, it should be noted that the above calculations do not account for recent price increases in hardware other than chips, such as storage. Since these hardware components have seen pure price increases without significant performance improvements, they will erode the cloud providers' gross profit margins.
2.2 Can Trainium chips bring higher profit margins?
However, it can be noted that the above calculations for profit margin improvements are based on NVIDIA chips. One of the core advantages of cloud providers lies in their ability to develop proprietary chips. With integrated in-house research and development of both software and hardware, enabling targeted optimizations, proprietary chips generally offer better profit margins for cloud providers.
Quantitatively, based on the latest Trainium 3 chip, how much can it further improve the gross profit margin of AWS's AI computing power leasing business? To answer this question, two key metrics need to be estimated: the Token generation efficiency of the Trainium 3 chip (Tokens per second) and the TCO of the Trn3.
a. Token generation efficiency: Although actual measured data is lacking, based on previously compiled paper specifications, the computing power of Trn3 at FP8 precision is 2.5 PFLOPs, about 25% higher than H200 and about 50% of B300. Therefore, Trn3's Token output per second is estimated to be between 2600 and 4300, closer to the lower bound, so we assume 3000 Tokens/s (when used with the Qwen 3.5 model).
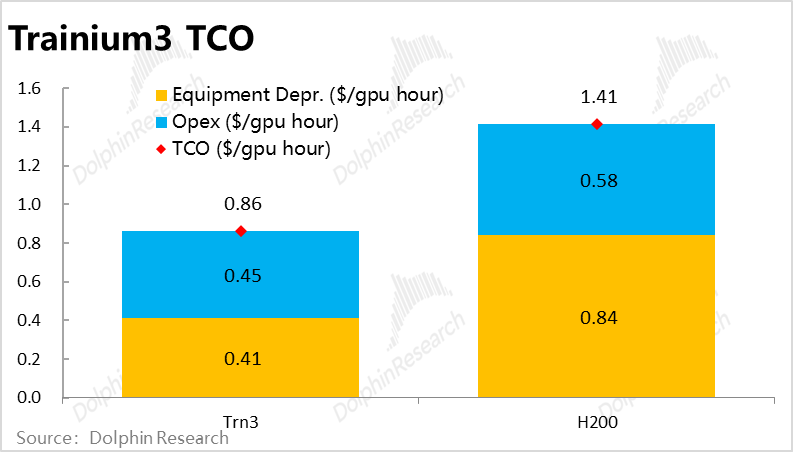
b. TCO Costs: The total cost of running a chip can be broadly divided into two parts. One is the depreciation expense corresponding to the total investment required for the chip and all its supporting hardware equipment. This part varies significantly depending on the chip. The other part is the depreciation of general-purpose facilities such as data center warehouses, power supply/cooling, as well as costs for daily operations like electricity and personnel. This portion of costs should be relatively fixed and will not change significantly even with different chips.
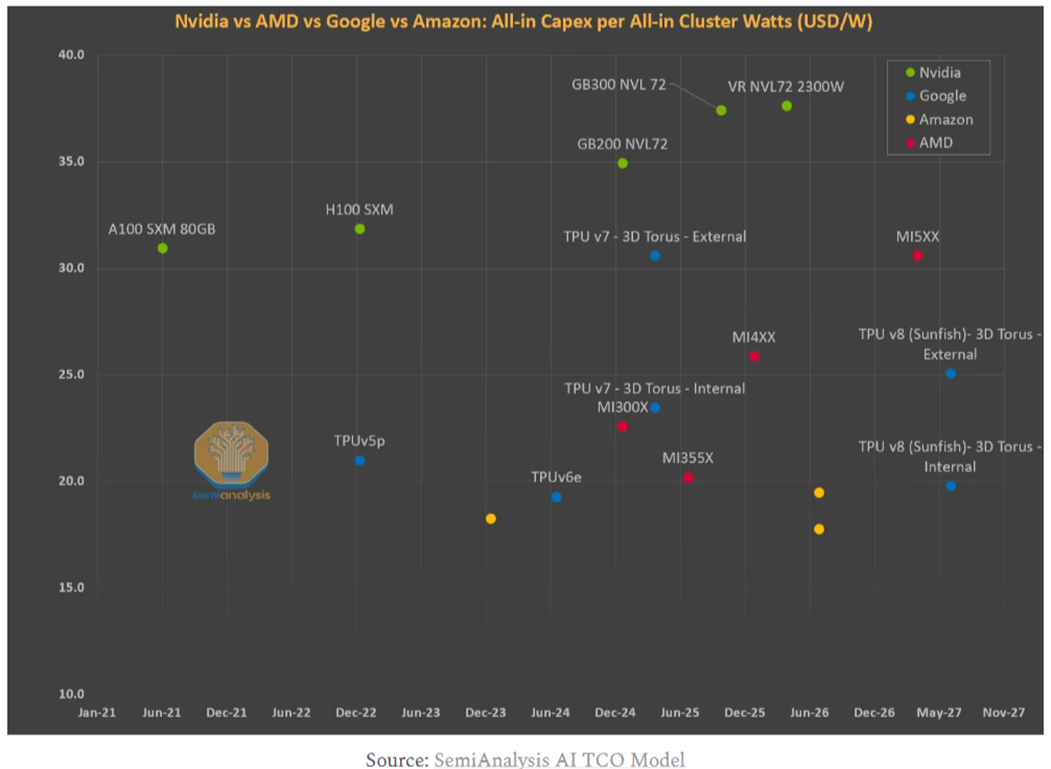
According to statistics from Semi Analysis, the All-in-capex for the Trn3 chip is $17-$19 per watt, which is approximately half of the Capex required per watt for the GB300. (Note: Dolphin Research believes that the Capex mentioned here includes only equipment Capex, and fixed asset Capex such as that for factory buildings should not be included). Assuming a five-year depreciation period, the depreciation cost for Trn3 can be estimated at approximately $0.41 per GPU-hour.
As for quasi-fixed costs that do not change much, such as warehouse depreciation and electricity, based on our calculations for nearly 10 chips, the cost range per kilowatt-hour is concentrated around $0.44-$0.51. Since proprietary chips can be specifically optimized, we assume that the cost of Trn3 is close to the lower end of the range, which translates to $0.45 per GPU-hour after conversion.
Adding up the two parts above, we estimate the TCO cost of the Trn3 chip to be $0.86 per GPU-hour, which is nearly 40% lower than the $1.41 for the H200.
c. The comprehensive gross profit margin of the Trainium3 chip is close to that of the B300: Based on the above calculations, the overall capability of the Trn3 chip is approximately 30%-40% higher than that of the H200, while its comprehensive cost is 40% lower. The comprehensive gross profit margin generated by using the Trn3 chip is also as high as 85% (shared by cloud providers and model developers), which is nearly consistent with the gross profit margin that can be contributed by the B300, currently one of the highest-performance chips.
This means that when used for inference in small and medium-sized models, Trn3 can almost be equivalently substituted for the B300. With such energy efficiency, as long as AWS is willing to make certain concessions in the cloud leasing pricing of Trn3, it is fully capable of attracting customers to switch their inference workloads from other hardware to Trn3 chips.
Regarding the profit distribution between cloud providers and model developers, if AWS is willing to set the cloud leasing price of Trn3 at 70% of that of the H200 (note that the performance of Trn3 is significantly stronger than that of the H200), the gross profit margins of cloud providers and model developers will be exactly the same as in the B300 scenario. If the leasing price of Trn3 is set at 80% of that of the H200, then the gross profit margin of cloud providers themselves will increase to approximately 46%, compared to 42% in the B300 scenario.
Summarizing the above analysis, it can be seen that under the combined effects of three factors—significant improvements in Token output efficiency driven by advancements in software and hardware technologies, no significant decline in unit Token pricing, and a slight increase in cloud leasing prices—the gross profit margin of cloud providers' AI businesses can experience a noticeable improvement.
Moreover, the calculations here are for the low-margin 'bare metal' leasing business. When combined with higher-margin MaaS/PaaS businesses, the overall profitability of cloud providers' AI businesses will be even higher.
III. How Much Supply and Demand for Computing Power Exist Respectively
From both qualitative and quantitative perspectives, we have thoroughly demonstrated the core logic behind the improvement in profit margins for cloud providers' AI businesses—the increasing bargaining power of cloud and model companies over upstream chip companies.
Next, we will discuss another crucial factor for the cloud computing industry and the companies within it—the magnitude of the incremental cloud demand driven by AI and whether it matches the planned growth rate of computing power supply. There are two perspectives here. One is the comparison of supply and demand at the industry level, which determines how the competitive landscape of the industry and the bargaining power within the industrial chain will change in the future.
The other perspective is at the level of individual cloud provider companies, specifically whether current cloud revenue expectations fully reflect the AI computing power demand for that cloud provider and whether the company's computing power supply is sufficient to support revenue growth.
To address these two questions, the pain point that Dolphin Research needs to resolve here is that the main driver of demand for computing power is the ARR of AI model companies, while the supply side is represented by the Capex of cloud providers. ARR and Capex cannot be directly compared, making it impossible to intuitively discern whether the future computing power supply and demand will continue to be in a state of persistent undersupply or show signs of oversupply.
Therefore, we will unify both demand and supply under a single metric—computing power capacity (in GW)—to explore the answers to the aforementioned questions. Note that although the forecast will extend to 2030, the focus will only be on 2028. Beyond that, visibility is too low, making it essentially meaningless.
3.1. Estimation of Demand
According to our previous analysis, the vast majority of incremental demand for AI clouds currently originates from the training and inference needs of two leading AI Labs, with a smaller portion coming from the self-use needs of cloud providers or other large technology companies. Therefore, the demand for AI cloud computing is largely equivalent to the demand from AI Labs.
However, due to the non-linear nature of AI technological advancements and related demand growth, it is difficult to determine whether future technological development will hit a bottleneck or suddenly experience a significant upgrade. Consequently, the following is more of a scenario assumption, namely, if the revenue of model developers reaches a certain level, what would be the equivalent demand for cloud computing power? Below is the specific estimation logic:
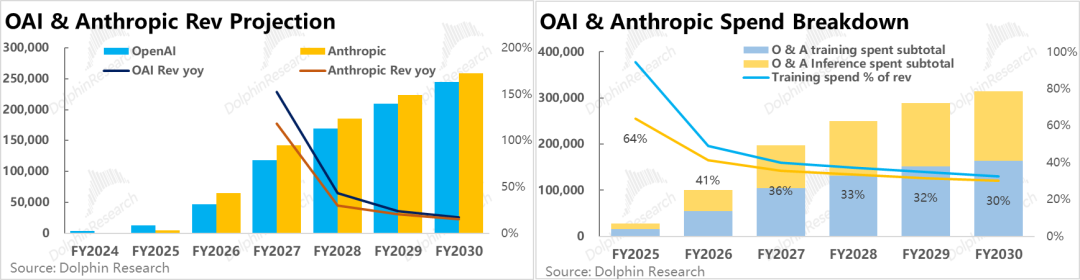
a. Revenue Forecast for Two Major Model Unicorns—Revenue Reaching $250 Billion by 2030. Although the pace of AI technological development is quite difficult to predict, assuming reference to OpenAI's own vision of achieving approximately $280 billion in revenue by 2030, we conservatively lower our expectations to around $250 billion.
A key assumption here is that starting from 2028, the revenue growth rate of the two model giants will quickly transition from triple-digit explosive growth in the previous period to a 'stable growth period' with a growth rate below 50%. This is crucial for the subsequent conclusions.
Another key assumption is that considering the recent narrowing of the gap between the capabilities of GPT base models and Codex as an entry point compared to Claude Code, we believe that OAI's revenue should quickly align with Anthropic's from 2026 onwards.
b. Cloud Computing Power Expenditure: This is divided into two parts—training expenditure and inference expenditure.
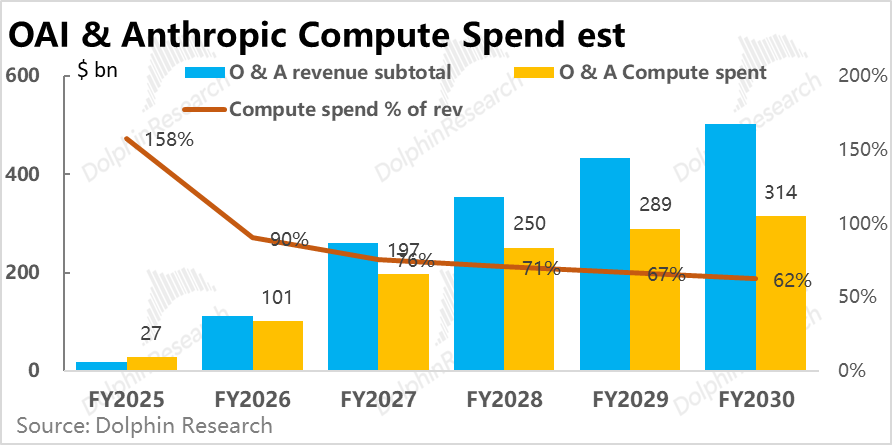
The key assumption for inference expenditure is that on the one hand, as the unit energy efficiency of chips further improves, there is still room for the gross profit margin of inference to rise. However, a counteracting factor is that it will be difficult for model developers to maintain unit Token pricing without reductions in the long term (eventually entering a stage of increased volume and decreased price). Therefore, it is expected that the gross profit margin for inference will only increase slightly from the current approximately 65% to around 70%.
Training expenditure, on the other hand, may not necessarily increase proportionally with revenue growth and depends more on the subsequent evolution speed of models. Out of conservatism, we assume that training expenditure will still experience high growth in 2027 (with a year-on-year growth rate of nearly 100%), but will quickly drop to below 30% starting from 2028.
Based on the above assumptions, we estimate that by 2028, the total cloud computing power expenditure of the two model giants will reach approximately $250 billion, accounting for about 71% of their annual revenue.
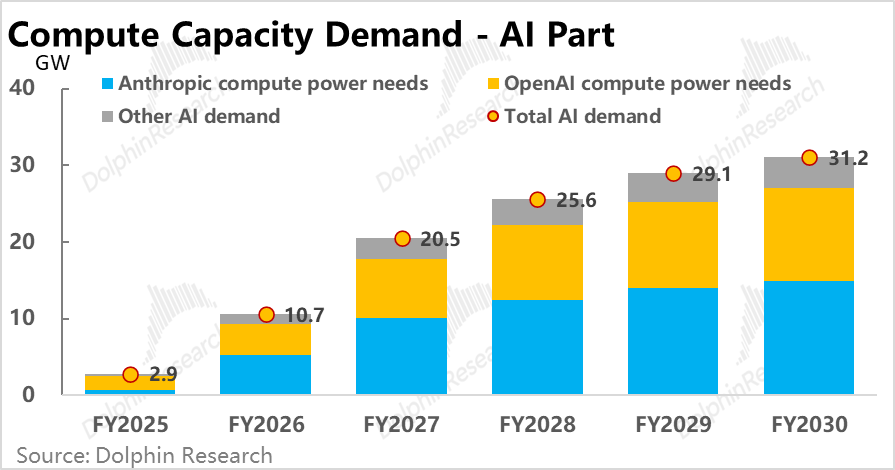
c. Total AI Computing Power Demand Could Reach 26GW by 2028: Based on a relatively complex conversion logic (training and inference require different amounts of GPUs, ASICs, and CPUs, and the revenue per GW corresponding to different chip types also varies, which will not be elaborated on in detail here), and assuming that the computing power demand of other AI Labs (excluding the self-use needs of cloud providers) is about 15% of that of the two giants, we estimate that the scale of AI computing power demand will be 25.6 GW by 2028, an increase of nearly 23 GW compared to 2025.
d. Traditional Cloud Demand
In addition, although traditional cloud computing demand is no longer a major growth driver, its absolute volume still accounts for the majority, and we also need to consider the incremental computing power scale corresponding to traditional demand.
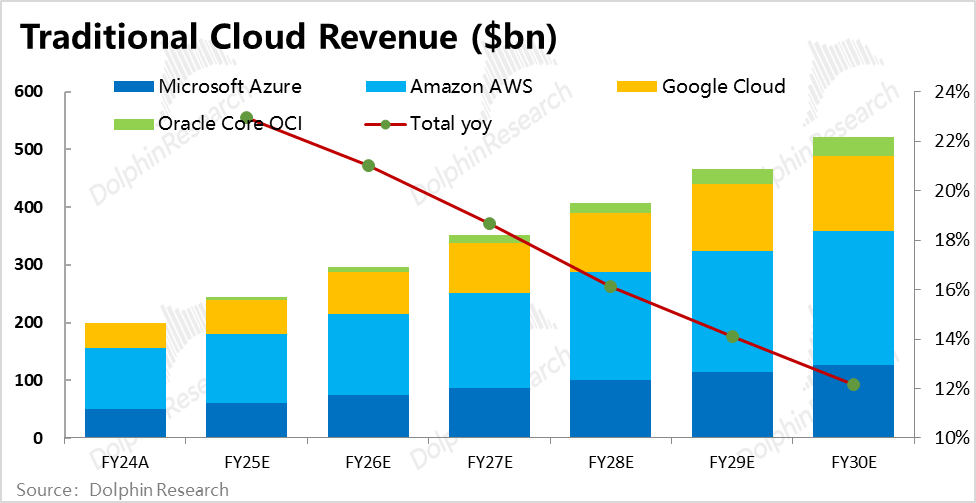
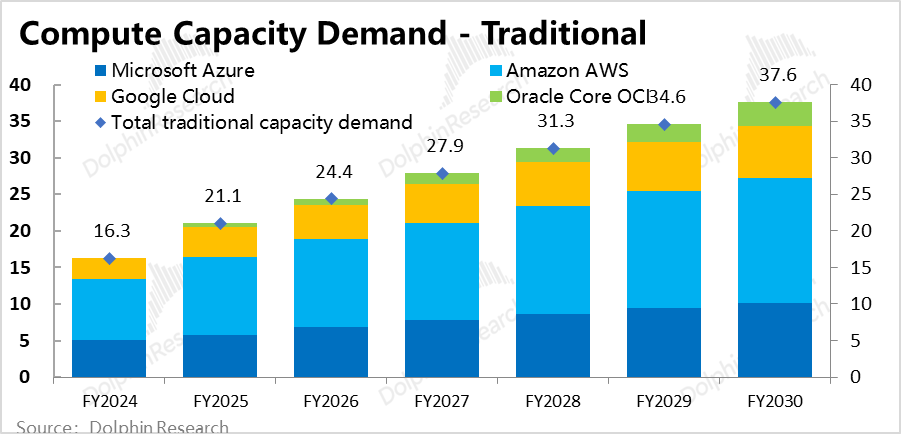
The estimation logic for this is relatively simple. Considering that nearly 100% of cloud providers' cloud revenue and computing power were still used for traditional demand in 2024, we can use the computing power and revenue scale already in place in 2024 as a basis and calculate the required computing power scale proportionally based on the subsequent growth of traditional cloud revenue.
Considering that various cloud providers have recently indicated that AI, especially AI Agents, will also drive demand for traditional computing power, we expect traditional cloud revenue to maintain a relatively high growth rate of around 20% between 2026 and 2027. However, considering that there is not much growth in companies' overall IT expenditure budgets and that there is a trade-off between AI investment and traditional IT investment, we conservatively expect the growth rate of traditional cloud demand to slow down significantly after 2028.
Based on the above assumptions, we estimate that the computing power scale required for traditional cloud computing will reach approximately 31GW by 2028, an increase of about 10 GW compared to 2025.
3.2. Comparison of Supply and Demand: Will Oversupply Occur Starting in 2028?
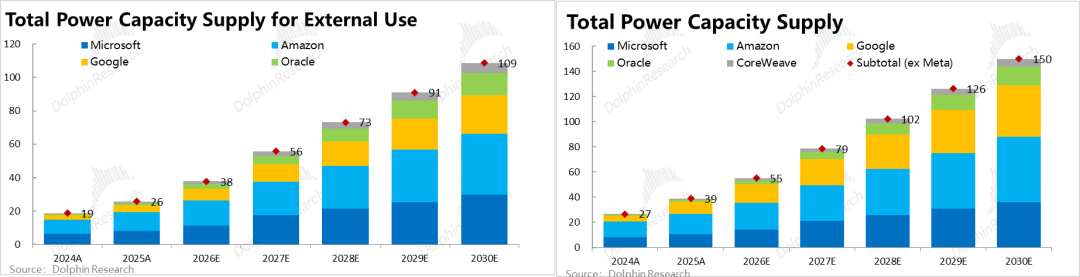
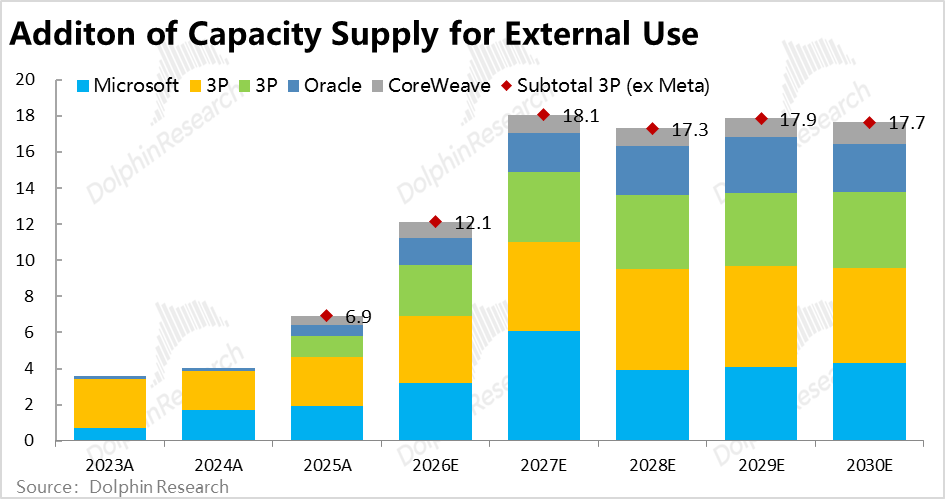
a. How Much Will the Overall Computing Power Supply of Cloud Providers Increase? After estimating demand, the next step is to look at the planned computing power supply of several major leading cloud providers (excluding Meta) in the future. It should be noted that except for Oracle, which has provided a long-term target up to 2030, other cloud providers generally only provide guidance on computing power scale up to 2027 (mostly doubling from the 2025 scale). Therefore, our estimation of the computing power supply rollout rhythm after 2027 is based on optimizations of forecasts from multiple investment banks.
The conclusion is that by 2028, the total computing power scale of several major leading cloud providers will reach approximately 100 GW. After excluding the portion reserved for internal business use, the computing power scale available for external leasing will be about 73 GW, an increase of about 47 GW compared to 2025.
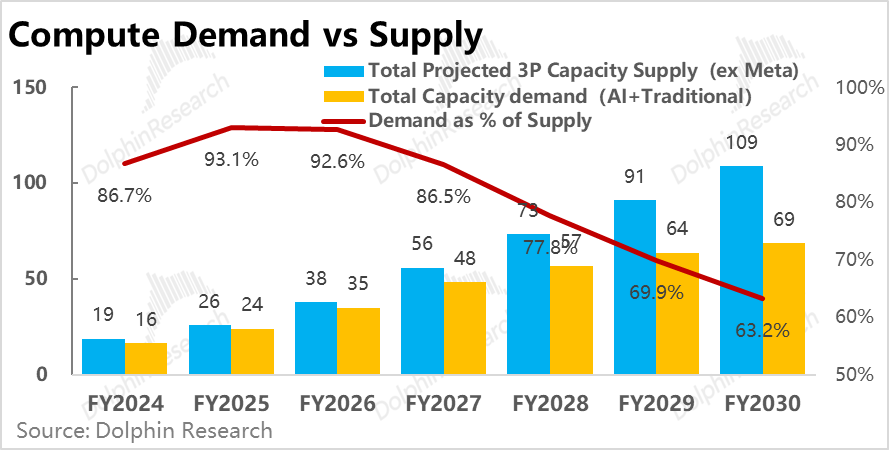
b. Will Computing Power Be in Oversupply? According to our previous estimations, the computing power scale corresponding to AI + traditional demand will be approximately 53 GW by 2028, which is significantly lower than the total computing power supply.
According to our calculations, the supply-demand gap will show a tightening trend between 2024 and 2026 (with the proportion of demand to supply rising from 87% to 93%). By 2027, the supply-demand relationship will return to the 2024 level, and starting from 2028, a clear trend of oversupply will emerge, with the gap widening further.
c. What Are the Implications of the 'Potential' Oversupply of Computing Power?
However, as Dolphin Research has repeatedly emphasized, the above estimations are only a scenario assumption. After all, no one knows exactly how much AI demand there will be after 2026 or how much computing power supply there will be after 2027. The truly valuable information is that the currently assumed AI revenue growth expectations (that the two leading AI Labs can generate approximately $500 billion in annual revenue by 2030) are insufficient to support the current market's linear extrapolation expectations that new computing power supply and Capex will remain high and not decline in 2028 and beyond.
To be precise, we are not necessarily suggesting that there will be an oversupply of computing power in the future, as it is absolutely possible for AI application scenarios and demand to experience another significant boost. This could be a leap in the model capabilities of OAI and Anthropic, or the emergence of other equally massive application and monetization scenarios for AI applications beyond Coding.
The real issue is that the market's current expectations have already factored in 'the huge incremental space or new AI application scenarios that I don't know what they are but I believe must exist' and have been reflected in the expectations for computing power construction and Capex.
This means that once AI development does not progress as rapidly in the next 1-2 years, computing power construction and cloud providers' Capex investments may peak in 2027, even if they may increase again later if new scenarios are discovered.
Summary: To summarize the above, Dolphin Research's two core inferences are: a. Among the three roles in the AI industrial chain—hardware (mainly chips), cloud providers, and model developers—the bargaining power of hardware providers is shifting downstream to cloud providers and model developers, with model developers capturing the majority and cloud providers a minority.
b. Currently, the market linearly extrapolates that the construction of computing power and cloud providers' Capex will remain high, not significantly declining after peaking around 2027-28, and has already factored in 'AI incremental demand that may not be non-existent but is currently invisible.'
As for the impact on investment logic, Dolphin Research believes this is a double negative for upstream hardware but has both positive and negative implications for cloud providers.
a. Firstly, the bargaining power of hardware vendors (primarily referring to chips, as storage remains the main bottleneck) has decreased. The core reason is that the absolute performance of self-developed chips by cloud providers has significantly caught up with flagship-level GPU chips, and their relative energy efficiency may have even surpassed them. Multiple signals indicate that cloud providers' dependence on external chip suppliers has significantly decreased. To retain customers, chip vendors must concede profits.
b. Furthermore, the construction of computing power and Capex may peak and decline in 2027 (even if only temporarily), which will have a greater impact on upstream hardware vendors. After all, the revenue of upstream hardware vendors depends on the incremental growth of computing power construction. A peak in Capex implies a year-over-year decline in revenue, while the revenue of cloud providers is based on the existing stock of computing power, and a slowdown in construction merely means a slowdown in revenue growth.
Moreover, given the current market sentiment, the positive impact of significantly reducing Capex and restoring cash flow may outweigh the negative impact of a decline in cloud revenue growth.
c. However, this does not mean that cloud providers will face no negative impacts. It is evident that if the supply of computing power temporarily exceeds demand, the competitive landscape among cloud providers will deteriorate, leading to competition for limited demand. Therefore, their performance may significantly diverge. It is possible that some cloud providers, by strongly binding with AI Labs and securing a majority of computing power orders, could further increase their cloud revenue growth.
However, increased competition and the need for cloud providers to compete for model vendors' order contracts mean that the overall bargaining power of cloud providers will also decline (unless cloud providers' own model capabilities significantly improve, reducing their reliance on external models). Cloud leasing prices are likely to shift from a premium to a discount, dragging down the profit margins of cloud businesses (although some of this may be offset by the positive impact of improved chip efficiency).
- END -
// Reprint Authorization
This article is an original piece by Dolphin Research. Reprinting requires authorization.
// Disclaimer and General Disclosure Notice
This report is intended for general comprehensive data purposes, designed for general reading and data reference by users of Dolphin Research and its affiliated institutions. It does not take into account the specific investment objectives, investment product preferences, risk tolerance, financial situation, or special needs of any individual receiving this report. Investors must consult with independent professional advisors before making investment decisions based on this report. Any person making investment decisions based on or referring to the content or information mentioned in this report assumes their own risk. Dolphin Research shall not be liable for any direct or indirect responsibilities or losses that may arise from the use of the data contained in this report. The information and data contained in this report are based on publicly available sources and are for reference purposes only. Dolphin Research strives for but does not guarantee the reliability, accuracy, and completeness of the relevant information and data.
The information or opinions mentioned in this report may not be regarded or construed as an offer to sell securities or an invitation to buy or sell securities in any jurisdiction, nor do they constitute advice, inquiries, or recommendations regarding relevant securities or related financial instruments. The information, tools, and materials contained in this report are not intended for or intended to be distributed to jurisdictions where the distribution, publication, provision, or use of such information, tools, and materials would contravene applicable laws or regulations or result in Dolphin Research and/or its subsidiaries or affiliated companies being subject to any registration or licensing requirements in such jurisdictions, or to citizens or residents of such jurisdictions.
This report merely reflects the personal views, insights, and analytical methods of the relevant creators and does not represent the stance of Dolphin Research and/or its affiliated institutions.
This report is produced by Dolphin Research, and the copyright is solely owned by Dolphin Research. Without the prior written consent of Dolphin Research, no institution or individual may (i) make, copy, reproduce, duplicate, forward, or create any form of copies or reproductions in any manner, and/or (ii) directly or indirectly redistribute or transfer them to other unauthorized persons. Dolphin Research reserves all relevant rights.
-
It's Time to Tally the ROI for Tokens
-
![]()
WPS, with 678 Million Users, Seeks Equilibrium Between Revenue Growth and User Experience
-
![]()
Seres, Once a Profit Leader, Shifts from Gains to Losses in H1: It’s Not Entirely Huawei’s Fault | MIRROR Pro
-
![]()
Why Google Remains 'Others' After 16 Years in the Smartphone Business
-
![]()
The Theory of Distillation Threat
-
![]()
Iterative Communication in Automotive Electronics: ADI's Innovative AB, GMSL, and EB Solutions
-
![]()
Despite AITO’s Explosive Sales, Why is Seres Still Struggling Financially?
-
![]()
For Seres, Losses Aren't the Toughest Challenge