"Awakening of Insects" Signals Market Recovery - CAAM: Domestic Auto Market Still Lacks Momentum
 04/13 2026
 531
531
The Impact of a Single "Spring Festival Month" Resonates Throughout the Year: The automobile market experiences particularly pronounced seasonal fluctuations between peak and off-peak periods this year.
On April 10, the China Association of Automobile Manufacturers (CAAM) unveiled the market data for the first quarter of the year, revealing that the market only started to show signs of gradual recovery following the "Awakening of Insects" (a solar term typically occurring in early March): "Post-Spring Festival, corporate production and business operations picked up pace, leading to increased market activity. In March, automotive production and sales witnessed a significant month-on-month rebound, demonstrating improvement over the preceding two months."
From a data standpoint, "automotive production and sales experienced a slight decline in the first quarter. However, by March, the decline had narrowed compared to the January-February period, indicating a positive trajectory."
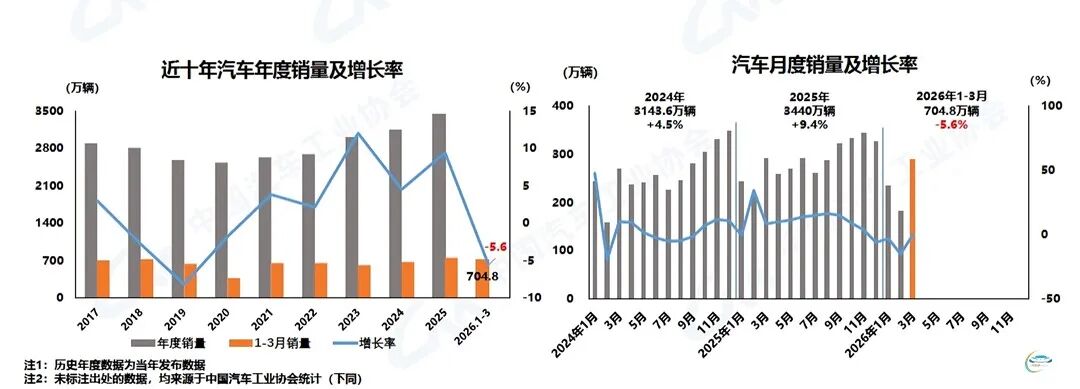
CAAM data reveals: In March, automotive production and sales reached 2.917 million and 2.899 million units, respectively, with month-on-month increases of 74.4% and 60.6%, albeit with year-on-year decreases of 3% and 0.6%. Chen Shihua, Deputy Secretary-General of CAAM, stated at the press conference, "This is also attributable to the high year-on-year base."
Examining the cumulative data for the first quarter, from January to March, automotive production and sales stood at 7.039 million and 7.048 million units, respectively, with year-on-year decreases of 6.9% and 5.6%.
From the perspective of the frontline market, the "Spring Festival Month" actually influenced two consecutive months. A closer examination of domestic sales uncovers an even more pronounced peak-and-trough pattern: From January to March, domestic automotive sales reached 4.823 million units, marking a year-on-year decrease of 20.3%. By March, although domestic automotive sales surged by 78.6% month-on-month, the year-on-year decline remained in the double digits, reaching 16%.
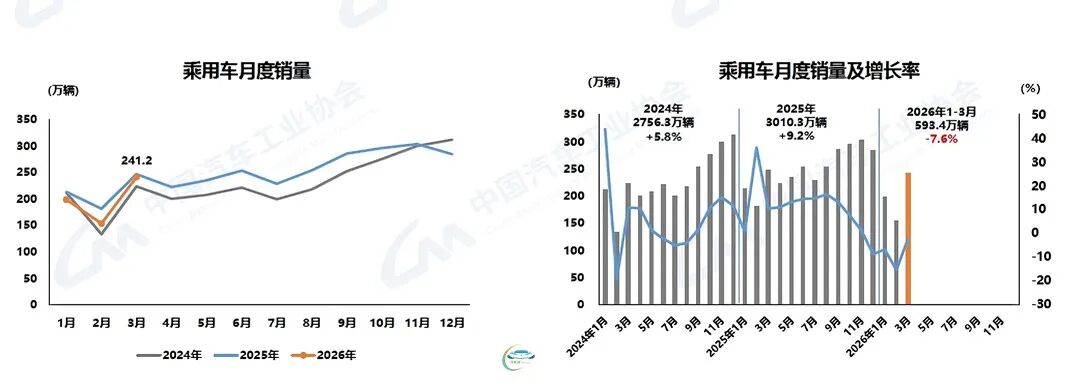
The "Spring Festival Month" exerted the greatest impact on the passenger car market. In comparison to overall market data, as the mainstay, the passenger car market saw production and sales reach 2.446 million and 2.412 million units in March, with month-on-month increases of 74.8% and 57.1%, but year-on-year decreases of 5% and 2.3%. Domestic sales reached 1.663 million units, marking a month-on-month increase of 75.1% but a year-on-year decrease of 19.2%.
From January to March, passenger car production and sales reached 5.909 million and 5.934 million units, respectively, with year-on-year decreases of 9.3% and 7.6%. Domestic sales reached 4.013 million units, a year-on-year decrease of 23.4%—nearly a quarter.
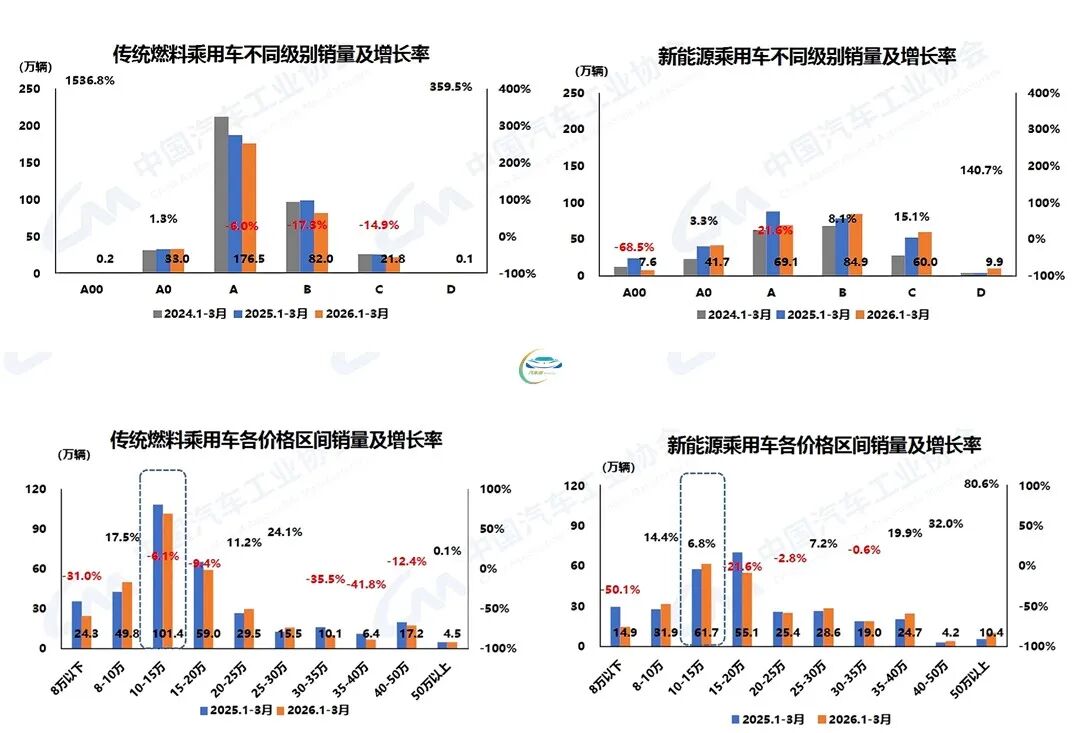
In contrast, traditional fuel passenger cars remained the primary contributors to the decline: From January to March, sales of traditional fuel passenger cars across Class A to Class C all decreased, with the Class A market, which accounts for the majority of sales, reaching a cumulative sales volume of 1.765 million units, a year-on-year decrease of 6%.
New energy passenger cars fared differently: The two main segments that experienced a decline in the first quarter were Class A00 and Class A. The Class B market, which accounts for the majority of sales, reached a cumulative sales volume of 849,000 units in the first quarter, a year-on-year increase of 8.1%. The Class A00 market, which saw a decline of 68.5%, was analyzed by CAAM as "the most significantly impacted by policy changes." From a consumer standpoint, Class A00 new energy vehicles were originally priced low, so the impact of the reduction in purchase tax incentives was not easily absorbed.
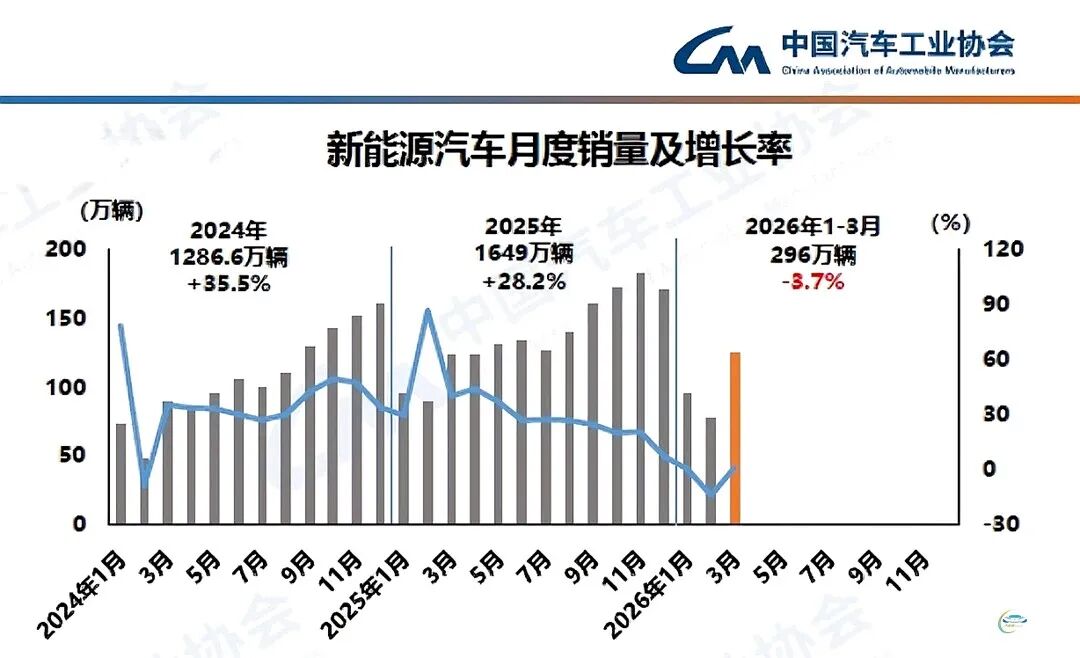
The influence of peak and off-peak seasons is substantial. New energy vehicles, as a growth driver in the market, also only began to rebound after the "Awakening of Insects": In March, NEV production and sales reached 1.231 million and 1.252 million units, respectively, with production decreasing by 3.6% year-on-year but sales increasing by 1.2% year-on-year. NEVs accounted for 43.2% of total new vehicle sales.
Reviewing the cumulative data, from January to March, NEV production and sales reached 2.965 million and 2.96 million units, respectively, with year-on-year decreases of 6.8% and 3.7%—slightly better than the overall market data, driven by an 18.3% increase in new energy commercial vehicles.
By the end of the first quarter, NEVs accounted for 42% of total new vehicle sales.
In terms of domestic sales, NEV domestic sales reached 882,000 units in March, an 82.4% month-on-month increase but an 18.3% year-on-year decrease. Among them, new energy passenger car domestic sales reached 796,000 units, a 79.1% month-on-month increase but a 21.1% year-on-year decrease; new energy commercial vehicle domestic sales reached 85,000 units, a 1.2-fold month-on-month increase and a 21.7% year-on-year increase.
From January to March, NEV domestic sales reached 2.006 million units, a 23.8% year-on-year decrease—with new energy passenger cars leading the decline: domestic sales reached 1.822 million units, a 26.7% year-on-year decrease. In contrast, new energy commercial vehicle domestic sales reached 184,000 units, a 23.6% year-on-year increase. Of course, it should also be noted that the base for new energy commercial vehicles is relatively small, so fluctuations have a more pronounced impact.
The new energy vehicle market is poised for even more dramatic transformations this year, with joint venture brands significantly ramping up their launches of new NEV models compared to previous years. Subtle shifts are already evident in CAAM data. If we examine cumulative data over several months, the market share changes among different national brands also become apparent.
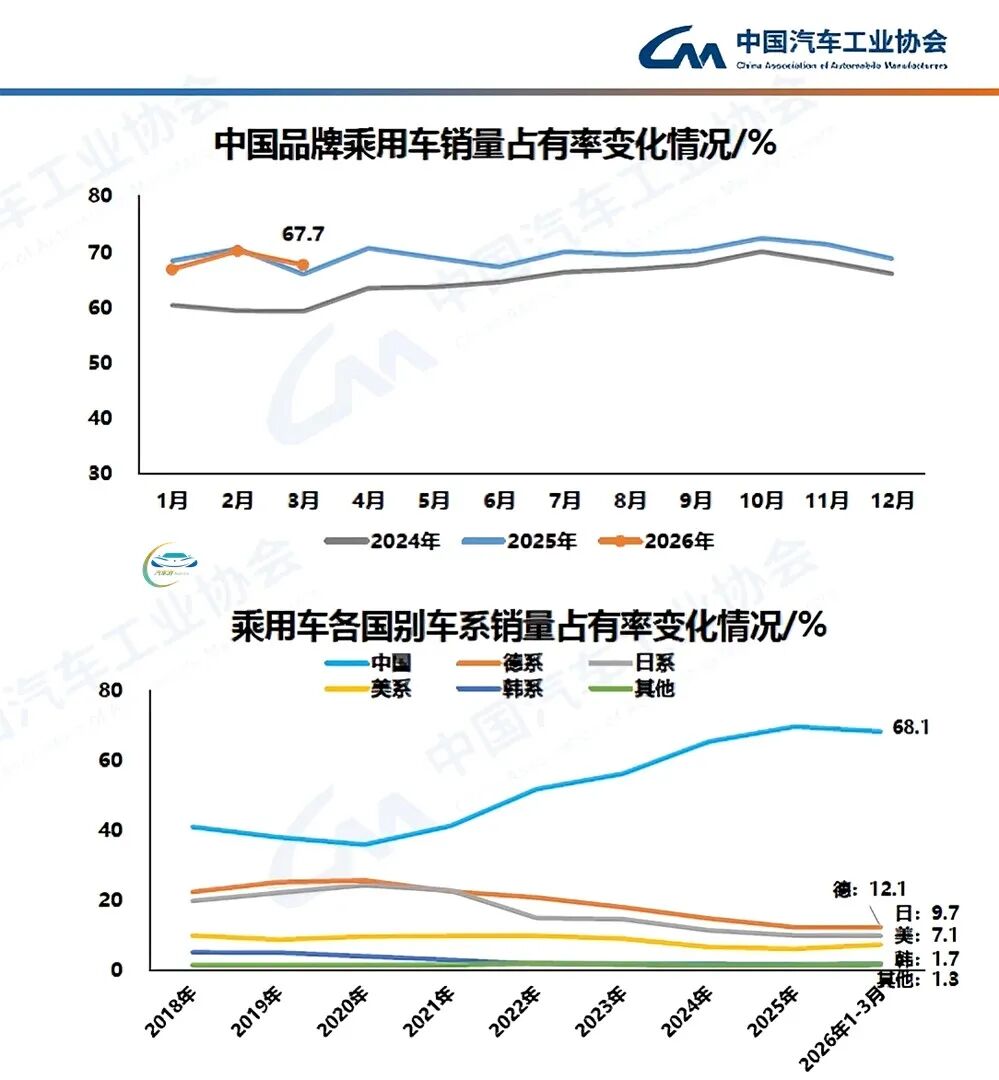
First, let's consider Chinese brand passenger cars, the mainstay of the NEV market: In March, Chinese brand passenger car sales reached 1.632 million units, a 0.2% year-on-year increase, with a market share of 67.7%, up 1.7 percentage points year-on-year. From January to March, Chinese brand passenger car sales reached 4.039 million units, a 7.6% year-on-year decrease, with a market share of 68.1%, unchanged from last year.
Focusing solely on March, among other national brands, Japanese cars exhibited significant changes. After reviewing data from the previous two months, compared to February's 8.8% market share, Japanese cars' market share surged to 9.7% in March, forming a stark contrast to the usual fluctuations of only 0.1-0.2 percentage points.
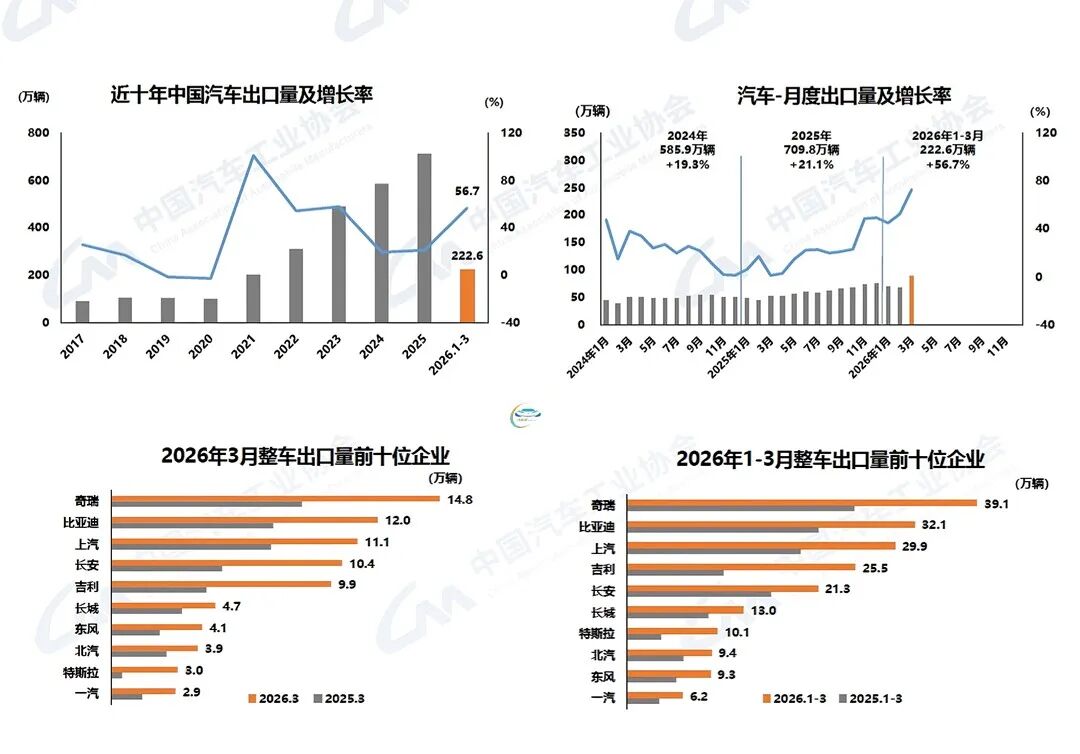
Among the data released by CAAM, the only area showing positive growth was export data: In March, automobile exports reached 875,000 units, a 30.2% month-on-month increase and a 72.7% year-on-year increase. From January to March, automobile exports reached 2.226 million units, a 56.7% year-on-year increase.
Among these, NEV exports reached 371,000 units in March, a 31.6% month-on-month increase and a 1.3-fold year-on-year increase. Traditional fuel vehicle exports reached 505,000 units, a 29.2% month-on-month increase and a 44.6% year-on-year increase. In the first quarter, cumulative NEV exports reached 954,000 units, a 1.2-fold year-on-year increase, while traditional fuel vehicle exports reached 1.271 million units, a 29.9% year-on-year increase.
Among the automobile companies vying for exports, the top three remain Chery, BYD, and SAIC. Changan Automobile witnessed a significant increase in exports in March, with exports surging to 104,000 units—exceeding Geely's ranking and breaking the 100,000-unit mark, compared to February's 65,000 units, a more than 60% increase.
As the first quarter draws to a close, CAAM analyzed the upcoming market trends: Looking ahead to the second quarter, the effects of policies such as the "Two News" (likely referring to specific industry policies) will continue to unfold, and the Beijing Auto Show will initiate a period of密集 (intensive) new product launches, helping to boost market enthusiasm and stimulate automobile consumption. However, it should also be noted that the current external environment is complex and volatile, with rising geopolitical conflict risks and high volatility in raw material and key component prices, further increasing operational pressures on enterprises. The domestic market momentum remains weak, and the industry still faces significant pressure. It is essential to closely monitor changes in the external environment, effectively respond to various risks and challenges, continuously expand domestic demand, thoroughly address "involutionary" competition, create a favorable market environment, and support the stable operation of the industry.
-
![]()
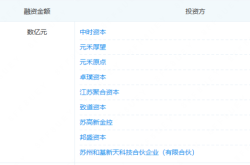
Jitian Xingzhou: A Pioneer in Optical Payloads Secures Hundreds of Millions in Series B Funding!
-
![]()
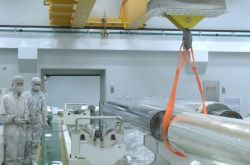
Orders Secured Through to the Second Half of the Year! The Rationale Behind the 'Surge' in Demand for This Company’s Optical-Grade Base Films
-
![]()
Beyond Patents: The Retail Rivalry of Insta360 and DJI Unfolds
-
![]()
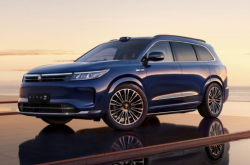
180 Billion Market Cap Vanished! How Did Seres Fall So Far?
-
![]()
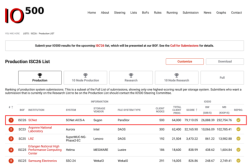
Blockbuster! Domestic storage takes the global double crown for the first time, from an AI company
-
![]()
China Spearheads Formulation! World's Pioneering Global Technical Regulation for Automated Driving Systems Greenlit and Unveiled
-
![]()
Farewell to Pulsed Support Policies: Three Major Auto Policy Directions from Multiple Departments Take Effect on the Same Day
-
![]()
Embercore AI’s Accelerated Funding: The Robot Industry’s Shift Toward ‘Learning Systems’