Great Wall and Changan: Both Report Profit Declines in H1, but for Entirely Different Reasons
 07/16 2026
 536
536
Written by | Bishan
Source | Bowang Finance
Recently, Great Wall and Changan have both submitted their first-half results. Both independent Chinese automakers reported significant declines in net profit—Great Wall's attributable net profit was RMB 2.35 billion to RMB 2.6 billion, a 60% year-on-year drop; Changan fared worse, with RMB 740 million to RMB 970 million, a decline of more than 60% year-on-year.
At first glance, both seem to be struggling, like brothers in misfortune.
But a closer look at the financial reports reveals that they are entirely different stories. Great Wall's profit decline was primarily due to RMB 2.274 billion in overseas tax subsidies that did not arrive this year, coupled with RMB 266 million in exchange losses—last year, it had a foreign exchange gain of RMB 1.493 billion, creating a difference of RMB 1.7 billion. These two non-recurring factors added up to nearly RMB 4 billion, creating a significant dent in the profit statement. However, if you look at its net profit excluding non-recurring items, it was RMB 1.5 billion to RMB 1.75 billion, with a much smaller decline than the attributable net profit, at just over 50%.
What does this indicate? It suggests that Great Wall's core business is not as bad as it seems.
What about Changan? Its net profit excluding non-recurring items was RMB 230 million to RMB 330 million, an 80% year-on-year drop. The decline in non-recurring items was deeper than the attributable net profit decline, indicating that its operational difficulties are more severe than the reported figures suggest. Sales were 1.1189 million units, a 17.44% year-on-year drop; independent brand sales fell by nearly 20%; and cumulative new energy vehicle sales were 414,200 units, also down 8.3%. In two words: under pressure across the board.
In essence, Great Wall is experiencing "pain on paper," while Changan is feeling "pain in its bones." One was hit by foreign exchange and subsidy timing issues but still has a solid foundation; the other is facing real-scale contraction and tight cash flow, with a negative operating cash flow of RMB 11.647 billion in the first quarter, sounding the alarm.
But when it comes to which is more dangerous, it's not that simple.
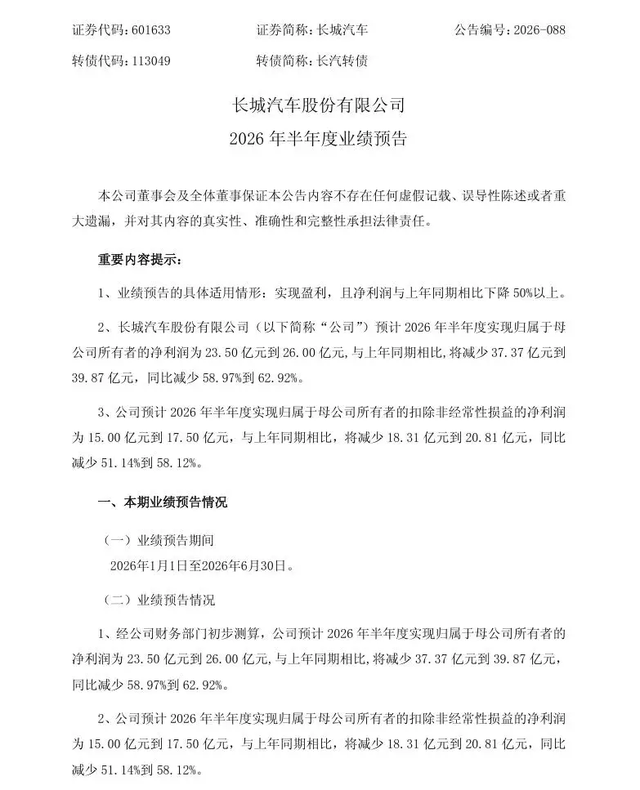
Figure 1: Great Wall Motor's H1 2026 Performance Preview Announcement
01 Both Report Profit Declines, but for Different Reasons
Let's first clarify the numbers.
Great Wall's attributable net profit in the first half of last year was RMB 6.337 billion, compared to RMB 2.35 billion to RMB 2.6 billion this year, a reduction of nearly RMB 4 billion. At first glance, this is alarming, but you need to understand how that RMB 4 billion disappeared.
RMB 2.274 billion was the overseas tax subsidy received last year but not this year. This money was not from operations but from the government—receiving it was luck, not receiving it is normal. The other factor is the flip-flop in foreign exchange gains and losses: last year, there was a gain of RMB 1.493 billion, which turned into a loss of RMB 266 million this year, creating a difference of RMB 1.759 billion. Is this unlucky? Of course. But is it an operational issue? No.
These two factors add up to just over RMB 4 billion. If you add them back, Great Wall's operating profit for the first half of the year actually increased.
Now, look at the numbers excluding non-recurring items: RMB 1.5 billion to RMB 1.75 billion, a 51% to 58% year-on-year decline. While the drop is significant, it looks much better than the attributable net profit. Non-recurring items are the true reflection of operations, indicating that Great Wall's core business of selling and manufacturing cars has not collapsed. Overseas sales were 291,400 units, a 47.44% year-on-year increase, accounting for half of total sales. Domestically, the inventory-to-sales ratio was 1.5, and the inventory coefficient was 1.3, well below the industry average of 1.58—what does this mean? While other companies have two months' worth of vehicles sitting in warehouses, Great Wall's channels have minimal inventory, and the Terminal is clean.
Changan's situation is entirely different.
Its attributable net profit fell by 60%, but its net profit excluding non-recurring items dropped by 80%. The deeper decline in non-recurring items compared to attributable net profit is a dangerous signal—it means non-recurring gains are "polishing" the financial statements.
Sales fell by 17.44%, independent brand sales dropped by 19.91%, and new energy vehicle sales decreased by 8.3%. Everything is declining, with no stable segment. A negative operating cash flow of RMB 11.647 billion in the first quarter means what? For Changan, selling a vehicle is not generating cash but causing blood loss.
Great Wall's collapse is an "accounting collapse," while Changan's is an "operational collapse." One can still stand after taking a hit, while the other is already bleeding.
Of course, Great Wall is not without issues. Its sales completion rate in the first half of the year was only 32.4%, and its annual target of 1.8 million units seems unattainable. All three main brands—Haval, Tank, and WEY—saw negative growth in June—Haval fell by 3.38%, Tank by 27.16%, and WEY by 29.48%. If not for Ora's 229% surge, the numbers would look even worse. The domestic core business is loosening, which is a fact.
But even so, Great Wall's channels are healthy, overseas sales are increasing, and cash flow is not sounding alarms. When compared, it's clear which company has a stronger foundation.
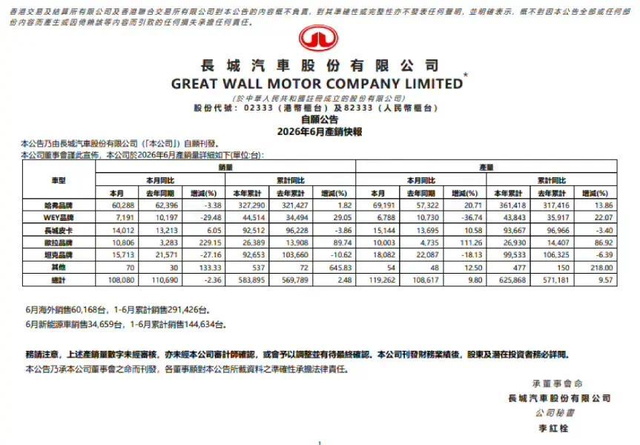
Figure 2: Great Wall Motor's H1 2026 Production and Sales Report—Haval, Tank, and WEY All Decline, Only Ora Rises
02 Overseas Markets: Both a Lifeline and a Thorn
Both Great Wall and Changan view overseas markets as their second growth engine, with both reporting rapid growth in the first half—Great Wall at 47.44%, Changan at 35.1%. But behind this high growth, each faces its own challenges.
Let's start with Great Wall.
Overseas sales were 291,400 units, accounting for 49.9% of total sales, just shy of 50%. This is indeed impressive in terms of globalization. However, the issue is that Great Wall's overseas gross margin is 16.70%, lower than the domestic 18.61%. This shatters the common perception that "overseas markets are more profitable."
Why? Because Great Wall's overseas Layout (I think you mean "layout" or "presence") relies heavily on the Russian market. Everyone understands the current situation in Russia—Western brands have fully withdrawn, and Chinese automakers have stepped in to fill the void, capitalizing on a geopolitical opportunity. But how long will this window last? No one can say for sure. Once geopolitical winds shift or Russian local protectionism rises, Great Wall's overseas foundation will shake violently.
Moreover, its success in Russia relies on cost-effectiveness, with no brand premium established yet. The 16.70% gross margin reflects this—volume is up, but profits are not.
A more hidden risk is exchange rates. Last year, Great Wall benefited from RMB 1.5 billion in foreign exchange gains, but this year it incurred RMB 266 million in losses, a difference of RMB 1.7 billion. The higher the share of overseas revenue, the greater the impact of exchange rate fluctuations on the profit statement. Previously, exchange rate risks were theoretical; now, they have become a reality.
Great Wall's response was to launch an H-share buyback plan, capping it at 10% of issued H-shares. Wei Jianjun stated, "We will not be swayed by capital pressures or sacrifice long-term development for short-term performance." This sounds firm but also reveals anxiety—the stock price has fallen too sharply, and management must do something to stabilize confidence.
Changan, on the other hand, sold 402,000 units overseas, accounting for 33.6% of total sales, with a 35.1% growth rate, also impressive. However, Changan's overseas Layout (layout) is more diversified, less reliant on a single market than Great Wall. This is an advantage in risk diversification but also means insufficient deep cultivation in each market.
Both face the same paradox: overseas markets are the fastest-growing segment but also the riskiest. Exchange rate fluctuations, geopolitics, and trade barriers hang over their heads, ready to strike at any moment.
In essence, going overseas is not a safe haven but another battlefield.
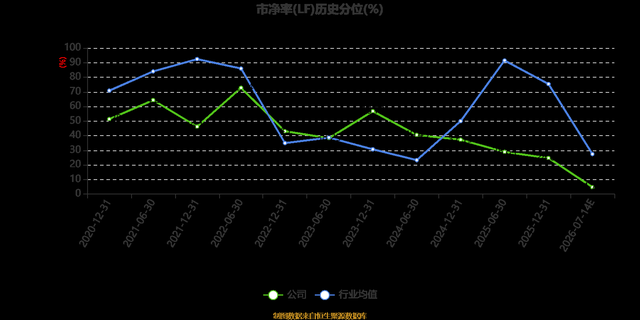
Figure 3: Changan Automobile's Price-to-Book Ratio (LF) Historical Percentile—Stock Price Under Continuous Pressure
03 New Energy Transition: One is Slow, the Other is Losing Money
If overseas markets are a shared hope for both companies, new energy vehicles are a shared pain—just experienced differently. Great Wall is slow, while Changan is losing money.
Let's look at Great Wall first.
Its new energy vehicle penetration rate was 24.8% in the first half, while the industry average reached 57.4%, and June saw a surge to 62.9%. Great Wall is not just "a step behind" but "two steps behind."
More dangerously, all three main brands—Haval, Tank, and WEY—saw negative growth in June. Haval fell by 3.38%, Tank by 27.16%, and WEY by 29.48%. These brands are Great Wall's core business, and their decline means what? It means Great Wall's fuel-powered vehicle (I think you mean "fuel vehicle") dividend (dividend or advantage) is rapidly fading, and new energy vehicles are not picking up the slack.
Ora did grow by 229%, but the brand is too small to support the overall business. Moreover, Ora's positioning is female-oriented and low-end, offering limited help for Great Wall's overall brand upgrade. You cannot expect a single Ora to compete against BYD's 1.8 million units.
Great Wall's sluggishness in new energy is related to its product structure. The Haval H6, once a national bestseller, has been overtaken by BYD's Song family. The Tank series is doing well in the niche off-road segment, but this niche cannot support a large-scale transition. WEY has struggled for years with a wavering positioning, leaving consumers confused about what it represents.
Now, let's look at Changan.
While Changan has not disclosed its new energy vehicle penetration rate separately, its sales structure shows a decline. Cumulative new energy vehicle sales were 414,200 units, an 8.3% year-on-year drop, while the industry is growing rapidly. This means Changan is losing ground in the new energy vehicle race.
The bigger trouble lies with Avatr and Deepal.
These two brands incurred losses exceeding RMB 2 billion in 2025. What does RMB 2 billion mean? Changan's total attributable net profit in the first half of the year was only RMB 740 million to RMB 970 million, so the losses from its two new energy subsidiary brands are more than double the group's profit. This is not "strategic losses" but "bleeding losses."
Avatr is positioned as a high-end intelligent electric vehicle, partnering with Huawei and CATL—a strong lineup, but sales have not picked up. Deepal follows a mid-range route, priced between RMB 150,000 and RMB 250,000, a highly competitive red ocean—BYD, XPeng, Leapmotor, and Neta are all formidable opponents.
Changan's response was to promote "three heroes to the cabinet"—Chen Zhuo and Di Zhirui were appointed as vice presidents, forming a new energy decision-making core with Deng Chenghao. The move is clear: centralize new energy decision-making to reduce internal friction and make a last-ditch effort. But can personnel changes solve the problem? Unlikely. Product strength, brand recognition, and channel efficiency all need improvement, and these cannot be fixed by simply changing personnel.
Great Wall and Changan face similar dilemmas in new energy: declining profits from fuel vehicles and an inability to reach break-even in new energy vehicles, leaving them stuck in the middle. However, their situations differ subtly—Great Wall's "reluctance to transition" is costing it, while Changan's "transition but with losses" is intensifying anxiety.
The industry penetration rate has surpassed 60%, with BYD selling 1.8085 million new energy vehicles in the first half, Geely 1.423 million (56.2% new energy share), and Chery 1.3575 million (35% new energy share). Great Wall is at 24.8%, and Changan's new energy sales are still declining. Are these two companies worried?
Yes, they are. But is worry enough? The window for new energy vehicles is closing, and every step behind doubles the cost of catching up later.
In the end, both Great Wall and Changan submitted failing profit reports in the first half, but the underlying issues are entirely different.
Great Wall has "external injuries"—foreign exchange and subsidy timing issues have created a dent in its profit statement, but its operational foundation remains strong. It has volume overseas, clean channels, and no cash flow alarms. The H-share buyback is also signaling to the market. Its problems are internal: a loosening domestic core business and a slow new energy transition. If Wei Jianjun cannot raise Great Wall's new energy penetration rate to the industry pass mark within the next 18 months, Great Wall will go from "slow" to "left behind."
Changan has "internal injuries"—shrinking sales, tight cash flow, and continuous losses in its new energy subsidiary brands are all life-threatening issues. It still holds 1.11 million units in scale (compared to Great Wall's 580,000), its biggest asset. But scale cannot feed it; the negative RMB 11.6 billion operating cash flow in the first quarter indicates that Changan's ability to generate cash is rapidly declining. Whether Avatr and Deepal can turn a profit is a matter of survival; if they cannot, Changan will go from a "transformation straggler" to a "persistent loser."
Both companies must answer the same question: with fuel vehicle profits in irreversible decline and new energy vehicles unable to reach break-even, how will they navigate this "deep-water zone of transformation"?
The industry's profit margin is now in the low single digits, and price wars continue. There is no standard answer. But one thing is certain—in this industry, being slow is not the problem; thinking you're fine when you're slow is.
Data sources: Great Wall Motor/Changan Automobile's H1 2026 performance previews, production and sales reports, historical financial reports, CPCA data, and East Money.
-
![]()
The Dead End of GoPro: Unveiling the Decisive Factors in DJI and Insta360's Competition
-
![]()
The Dead End for GoPro: Unveiling the Key to Victory in DJI and Insta360's Competition
-
DeepSeek Targets A-share IPO Amid RMB 480 Billion Valuation Debate
-
![]()
WPS Meitu XiuXiu: The Threat to Its Market Position from AI Large Models
-
![]()
After Seres Reports Losses, What Is the Capital Market Really Worried About?
-
![]()
Honor, Stepfun, and Nubia Vie for 'Pioneering' Status: The Fierce Contest Among AI-Powered Smartphones
-
![]()
Glory, Stepfun, and Nubia Vie for the Pioneering Position: AI-Powered Smartphones Engage in Intense Competition
-
![]()
Apple AI Gains Approval but Faces Outdated Challenges