J.P. Morgan's 2027 Forecast for China's Auto Industry: Three Hurdles, Competing for Share in a Shrinking Market
 10/12 2026
 394
394
Recently, J.P. Morgan released an annual outlook for China's auto industry, with three keywords in the title: policy headwinds, profit risks, and exit strategies.
Several friends in supply chain and overseas expansion shared it recently and asked for my thoughts.
Most online interpretations focus on ratings and target prices—who got downgraded, who is favored. Frankly, these are not very useful for those working at automakers and suppliers.
I read through all 52 pages of the report and reorganized the key figures relevant to industry practitioners into seven charts.
My biggest takeaway is that these three hurdles are interconnected.
If domestic sales stall, automakers push harder overseas. But the harder they push, the tighter Europe closes its doors. When doors tighten, local factories must be built, yet profits are falling—where will the funding come from?
This piece does not discuss investments but focuses on what industry insiders can control: how these three hurdles will affect your planning, pricing, and overseas projects from the second half of 2026 through 2027.
1. Domestic: Retail sales down 20%, set to fall further in 2027
2. Profits: Expectations slashed by 40%, with more cuts likely
3. Overseas: Beyond tariffs, a full toolbox of barriers awaits
4. Solutions: Localization and consolidation—two slow paths
Let’s dive in.
01 Domestic retail sales down 20%, set to fall further in 2027
Exports prop up total volume but not domestic prices
Start with the most direct numbers.
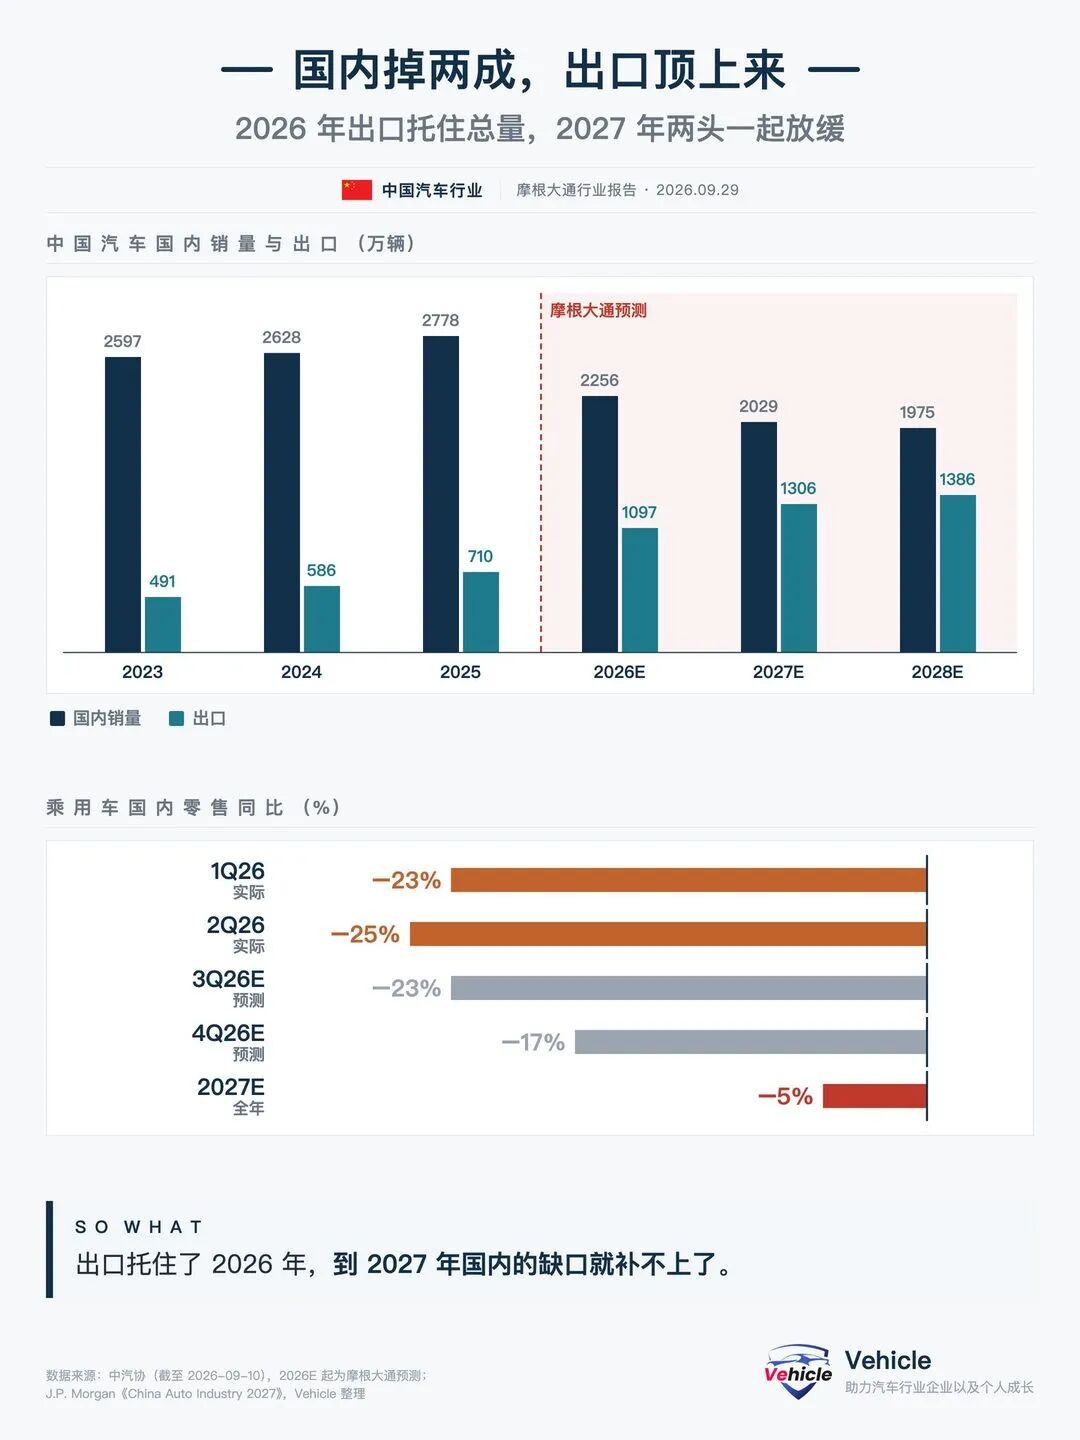
J.P. Morgan forecasts 18.96 million passenger vehicle retail sales in China for 2026, down 21% from 2025. Another 5% drop is expected in 2027, bringing the total to 18.01 million.
Over the same period, passenger vehicle exports are projected to rise from 6.04 million to 9.70 million, a 61% increase.
On balance, wholesale volumes will only decline by 5% in 2026—not as dire as it sounds.
The problem emerges in 2027.
Export growth will slow to 20% while domestic sales continue to decline. Total domestic vehicle sales are projected at 20.29 million, nearly 7.5 million fewer than in 2025.
Quarterly breakdowns show passenger vehicle retail sales declining by 23% and 25% year-on-year in the first half of 2026, with the second half projected at 23% and 17%. Not a single quarter will see positive growth.
Pricing shows no improvement either. The report notes industry-wide terminal discounts remain at 15%–16%, peaking at around 17% in the first half of 2025.
Efforts to curb cutthroat competition since last summer have yielded limited results. The report attributes this directly to overcapacity, which cannot be resolved through mere price war halts.
Will 2027 be better or worse?
The report provides a range: with stimulus policies, domestic passenger vehicle demand could stabilize; without subsidies, a 5% decline is likely. The baseline scenario assumes some stimulus but with downward risks.
My judgment: planning for a 5% decline in 2027 is safer.
Two reasons: first, the timing and scale of stimulus policies remain uncertain. Second, even if demand stabilizes, it would be at the low levels seen after a 20% drop in 2026—price wars will not end.
In short, do not view 2027 as a recovery year but as the second year of competing for shrinking market share.
The table below shows three scenarios derived from the report, with a “pressure” scenario added by me.
2027 Domestic Sales Planning: Three Scenarios (Copy Directly)
Optimistic: Domestic demand stabilizes (stimulus policies implemented)
Applicable: When handheld orders exist and stimulus is confirmed
Baseline: Domestic demand down 5% (no new subsidies)
Applicable: Default for budgeting, production scheduling, and hiring
Pressure: Domestic demand down 10% (stimulus fails, price wars intensify)
Applicable: Cash flow projections, inventory caps, production halt plans
Each scenario clearly outlines three elements:
1. Production and inventory caps
2. Per-unit price assumptions (terminal discounts tested at 15%–17%)
3. Triggers for scenario switching (monthly retail YoY, terminal discounts, policy announcements)
Note: The report’s forecasts were made in September 2026. Numbers will change with subsequent policies. Update monthly.
02 Profit expectations slashed by 40%, with more cuts likely
Chip shortages, exchange rates, and payment terms tighten simultaneously
The second hurdle appears on profit statements.
A striking figure in the report: market profit expectations for Chinese automakers have been revised downward by over 40% this year.
J.P. Morgan’s forecasts are another 10%–11% lower than the market consensus.
Downgrades are not uniform.
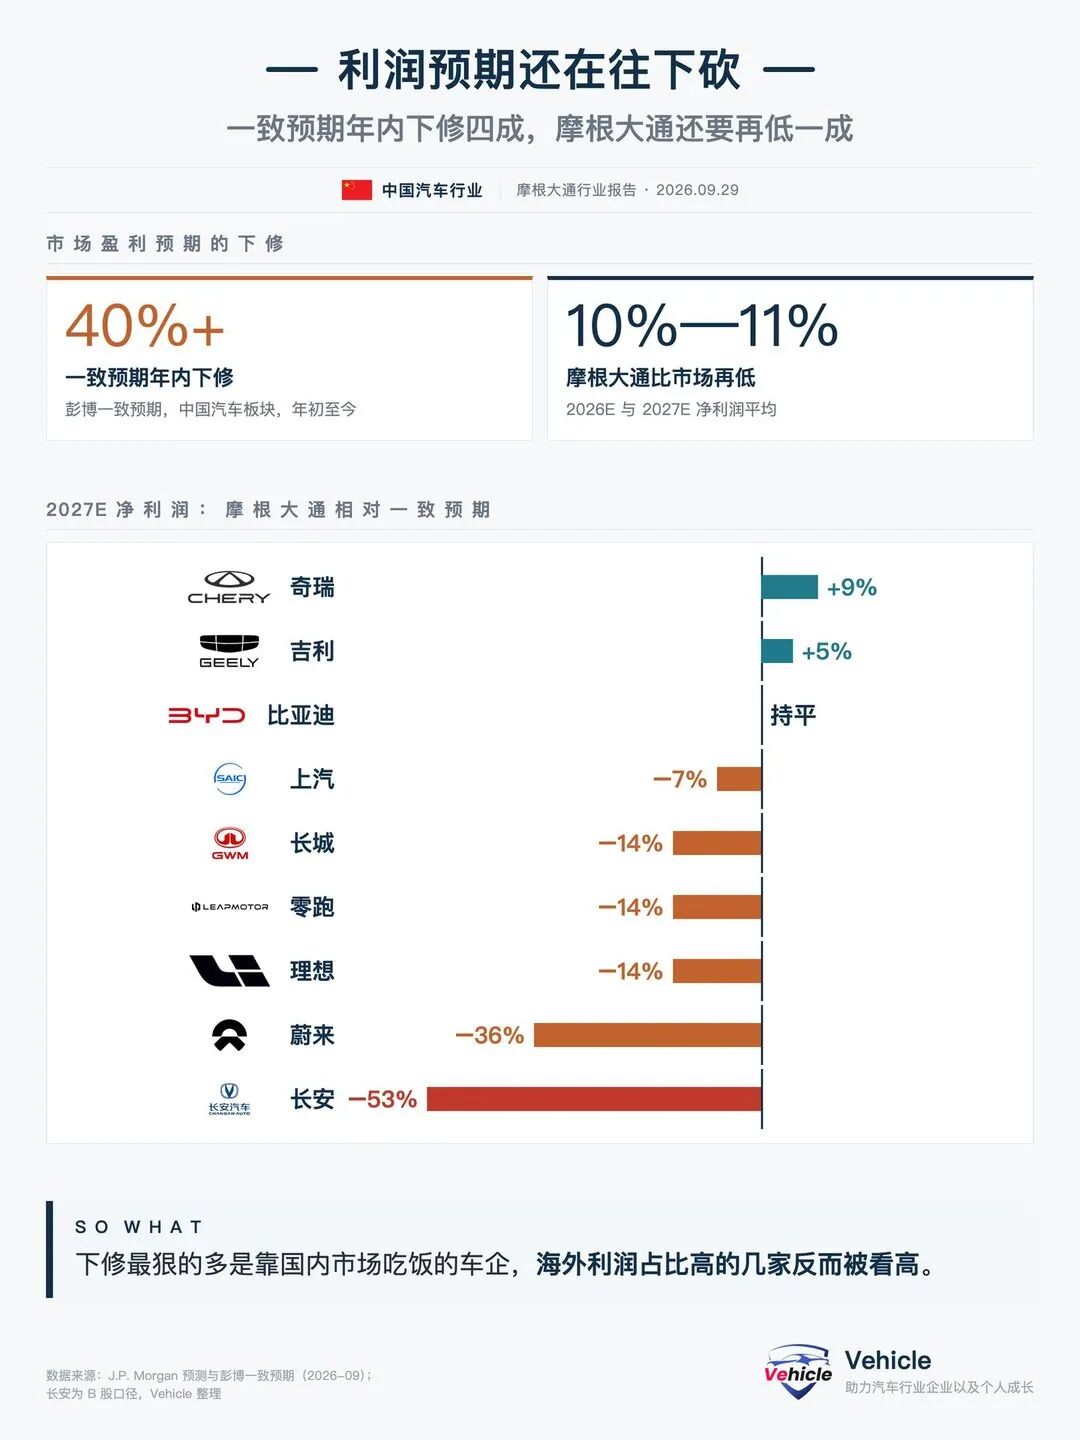
Changan’s 2027 profit forecast is 53% below market expectations, NIO’s 36% lower, and Great Wall, Leapmotor, and Li Auto all face 14% cuts. BYD remains largely unchanged, while Geely and Chery exceed expectations by 5% and 9%, respectively.
My interpretation: companies with higher overseas profit shares are more stable. Chery derives over 90% of its profits overseas, and Geely’s overseas profits likely account for more than half.
Costs: Memory chip prices to rise again next year
Half the profit decline stems from revenue, half from costs.
The report cites J.P. Morgan’s semiconductor team, projecting DRAM or NAND prices could rise by over 20% in 2027.
Modern smart EVs rely heavily on memory chips for cockpits, ADAS, and domain controllers. Several automakers already mentioned rising memory and commodity costs pressuring margins during Q2 2026 earnings calls.
A stronger RMB will also result in foreign exchange losses when converting overseas revenue.
Payment terms: Automakers’ ability to defer payments to suppliers is shrinking
This is the most critical point for supply chain professionals.
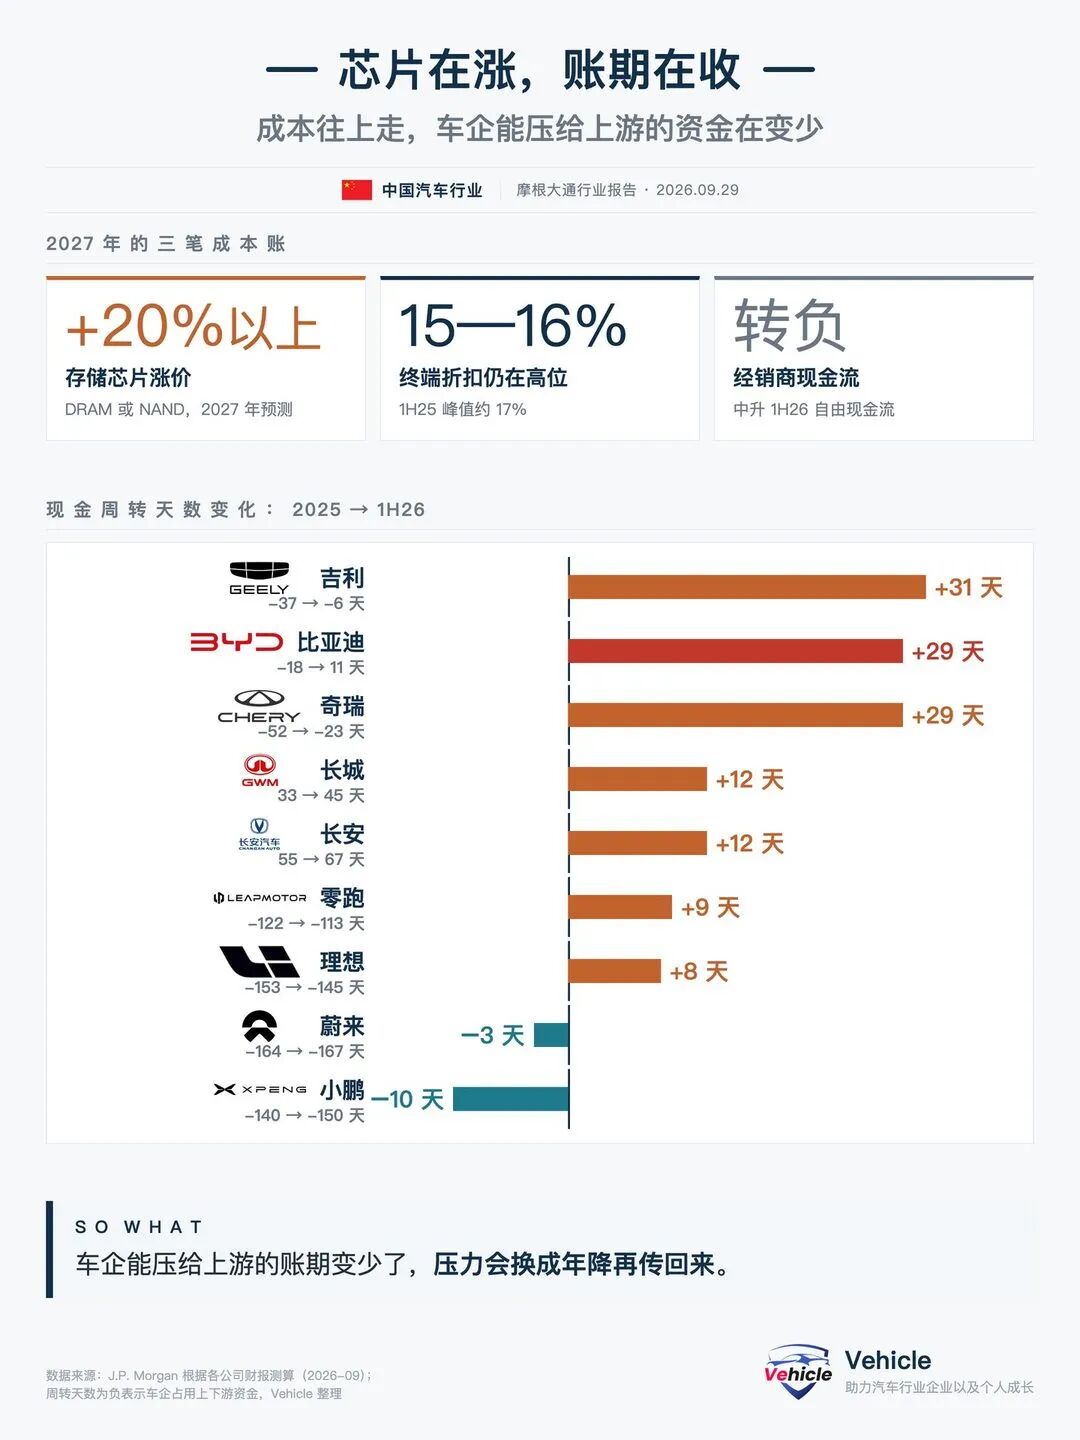
Negative cash conversion cycles mean automakers receive payments before paying suppliers, effectively using supplier and dealer funds for working capital.
BYD’s cycle lengthened from 18 days in 2025 to +11 days in H1 2026. Geely’s increased from 37 to 6 days, and Chery’s from 52 to 23 days.
My judgment: this pressure will shift upstream in 2027 through annual price cuts and extended payment terms.
As automakers’ cash flow deteriorates, they will seek to recover funds from suppliers. Quoting and stocking based on 2025 rhythms will leave you vulnerable next year.
Six Key Checks for Supplier Quotes and Contracts in 2027 (Copy Directly)
1. Memory chips, copper, aluminum, etc.: Are there price linkage clauses? What is the linkage frequency?
2. Annual price cuts: How many points are customers demanding next year? How does this compare to this year?
3. Payment terms: What is the gap between contractual terms and actual payment days? Who covers bill discounting costs?
4. Exchange rates: Which currency are overseas projects settled in? Who bears exchange rate fluctuations?
5. Customer mix: How many of your top three customers rely primarily on the domestic market?
6. Inventory: What is the gap between customer production schedules and actual deliveries? Which figure guides stocking?
Note: Cash conversion cycles are calculated from public filings and may vary across companies. Focus on trends rather than precise comparisons.
03 Beyond tariffs, a full toolbox of barriers awaits
BEV taxes already imposed, PHEV and market share caps loom
The third hurdle lies overseas and is, in my view, the toughest.
First, assess Chinese automakers’ overseas progress.
According to the report, Chinese automakers’ retail market share outside China rose from 1.5% in 2020 to 6.4% in 2025 and reached 8.2% in the first seven months of 2026. Excluding the U.S., this figure reached 11%–12% in August.
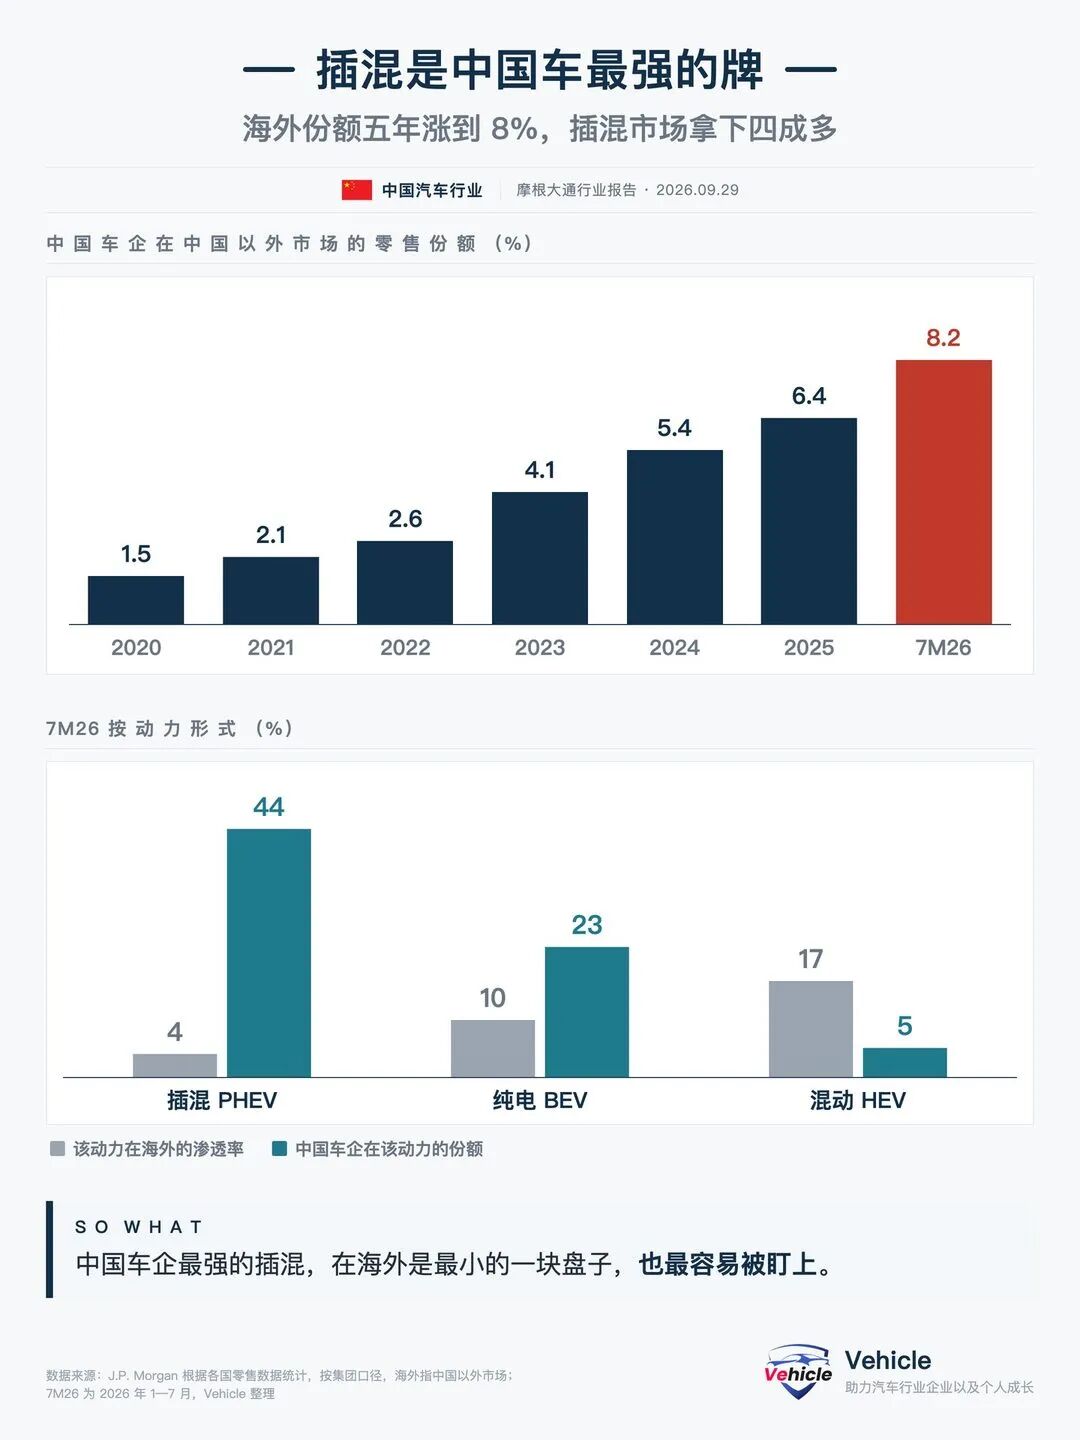
Breaking it down by powertrain is more revealing.
Chinese automakers hold 44% of the overseas PHEV market, 23% of BEVs, and just 5% of hybrids.
Yet penetration rates abroad show the opposite trend: hybrids at 17%, BEVs at 10%, and PHEVs at only 4%.
Chinese automakers dominate the smallest overseas segment—offering growth potential but also drawing scrutiny.
The EU’s toolbox
Since October 2024, the EU has imposed roughly 30% anti-subsidy tariffs on Chinese-made BEVs, a fact widely known.
The report highlights additional measures:
PHEV tariffs possible: Chinese brands hold ~36% of Western Europe’s PHEV market and ~64% of Eastern Europe’s (excluding Russia). The report suggests tariffs could arrive by late 2027.
Industrial Acceleration Act (IAA): Links subsidies to local content requirements, with implementation possible by mid-2027.
Export tax rebate cuts: No official statements yet, but the report speculates these could become bargaining chips in EU-China negotiations around late 2027.
Hybrid market share caps: Reports suggest the EU proposed China voluntarily limit hybrids to 15% of EU sales, though this remains unconfirmed. For details, see Vehicle’s article “How Will EU Curbs on Chinese Hybrids Impact Exports?”
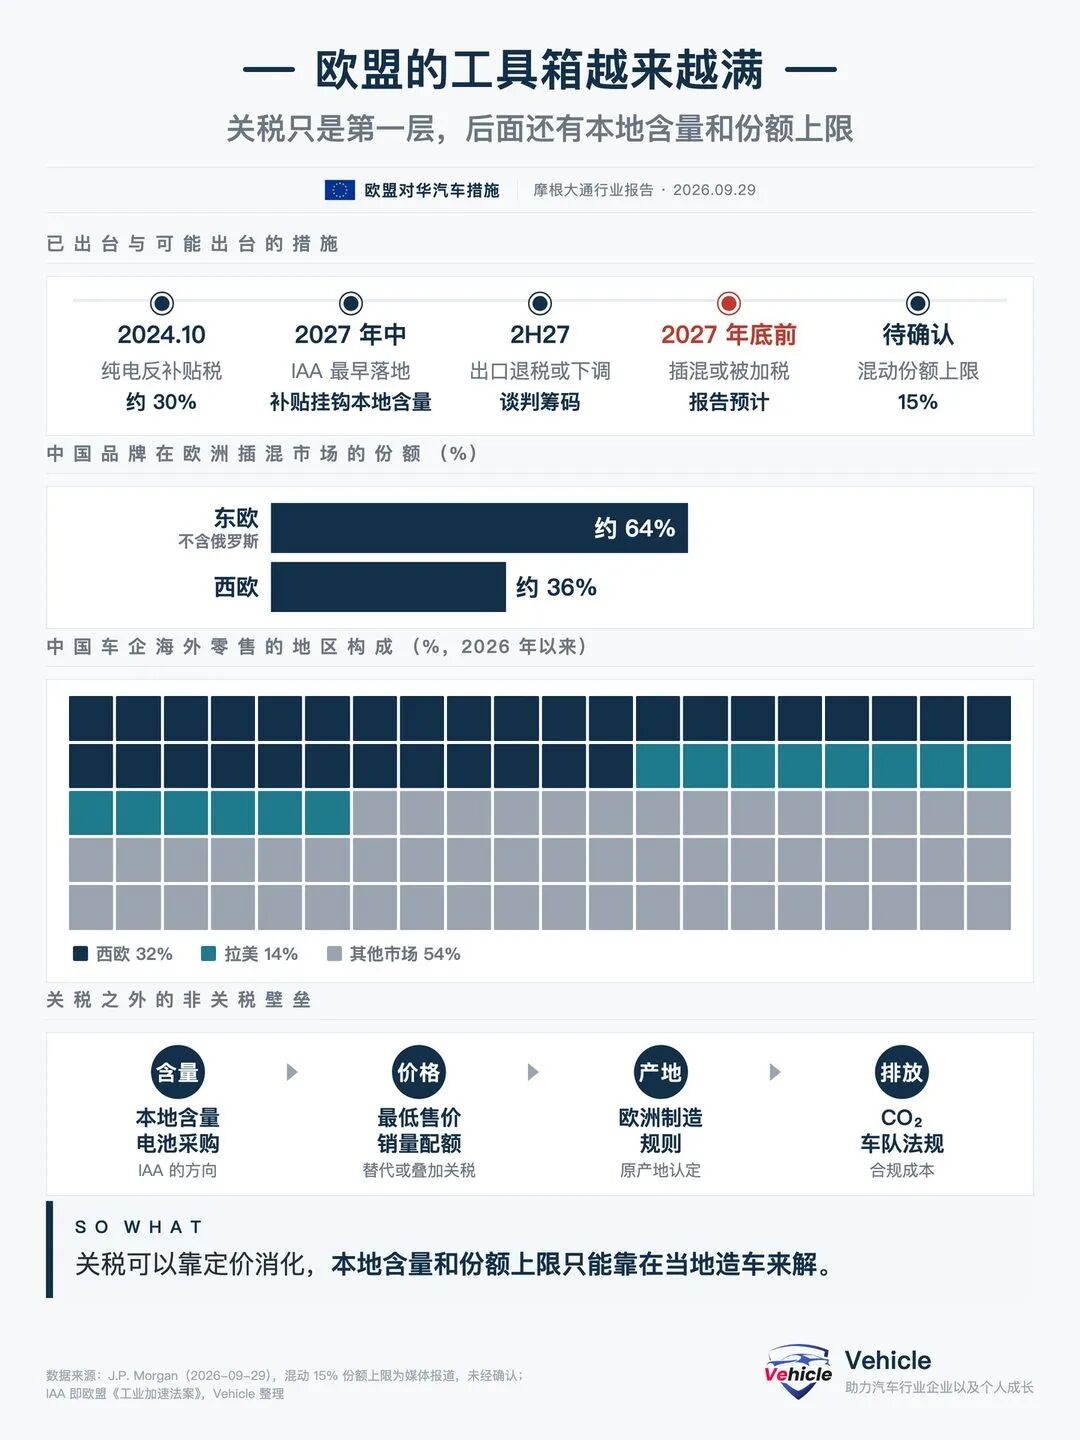
Beyond tariffs, expect local content and battery procurement requirements, minimum pricing and quotas, “Made in Europe” rules, and CO2 fleet regulations.
Another key figure: Western Europe accounts for 32% of Chinese automakers’ overseas retail sales this year. A third of sales concentrated in one region is inherently risky.
1986 Japan offers a clear precedent
The report includes a boxed section on how European countries handled Japanese cars in 1986.
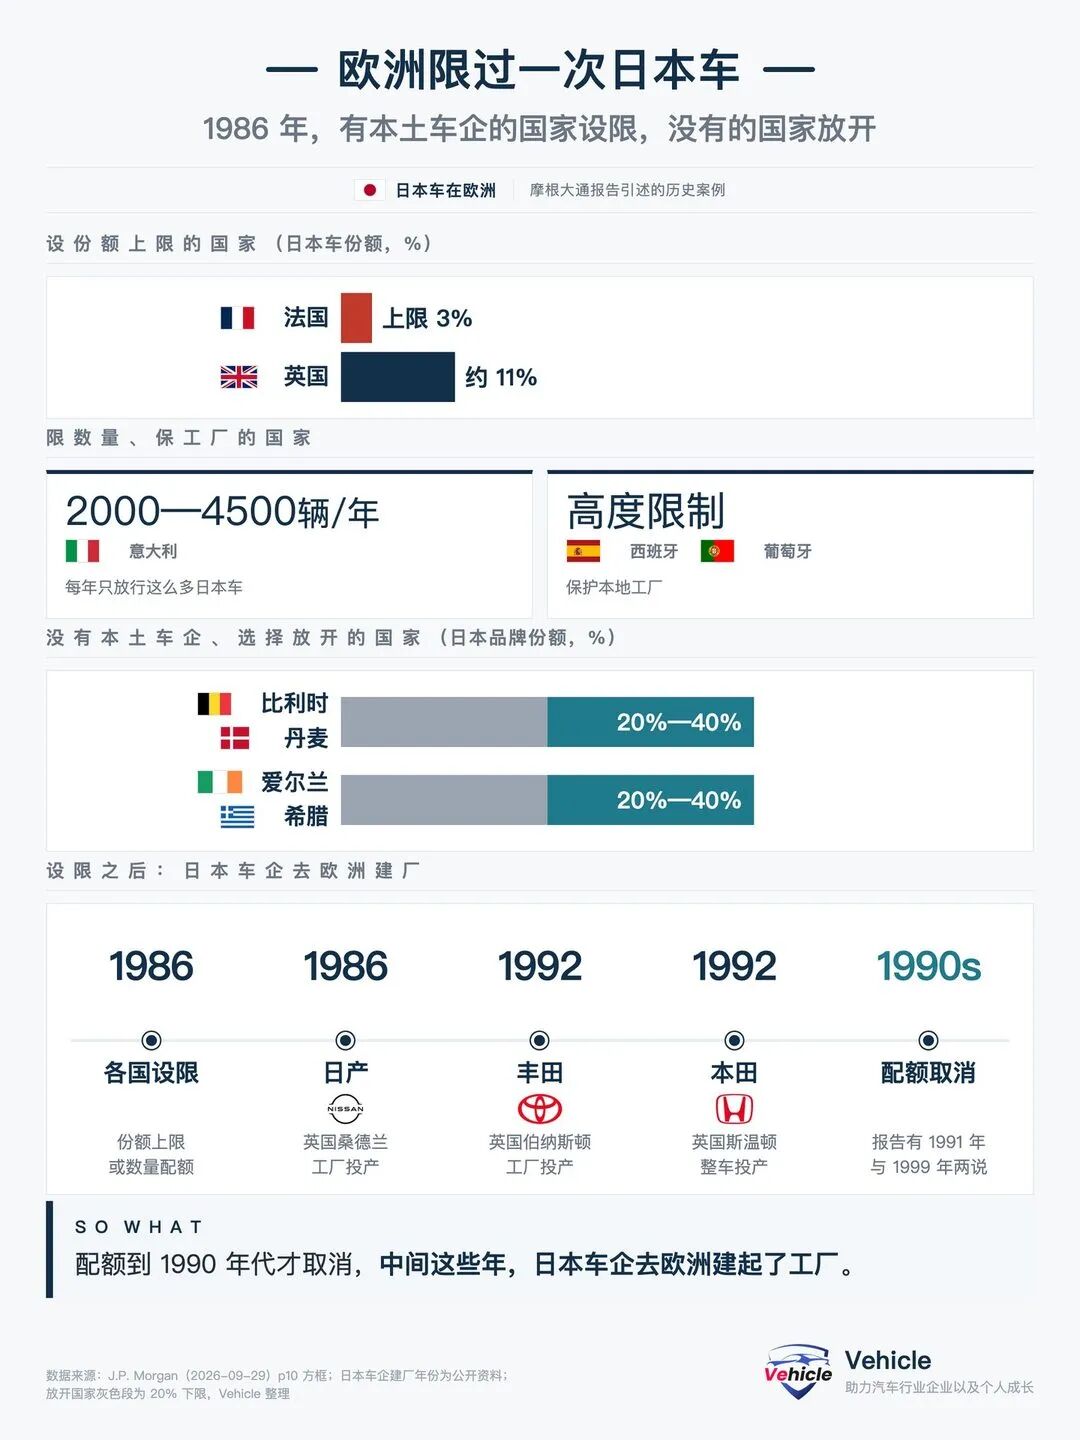
France capped Japanese market share at 3%, Italy allowed just 2,000–4,500 units annually, the UK around 11%, and Spain and Portugal imposed strict limits.
Belgium, Denmark, Ireland, and Greece—countries without domestic automakers—opened their markets, allowing Japanese brands to quickly capture 20%–40% shares.
The pattern is clear: countries with automotive industries imposed restrictions; those without did not.
These quotas remained until the 1990s. During this period, Nissan, Toyota, and Honda sequentially built factories in the UK.
Clarification: The report’s main text states restrictions were lifted in “1999,” while the boxed section says “December 31, 1991.” I’ve standardized this to “the 1990s.”
My judgment: 2027 European PHEV planning must include a tariff scenario.
PHEVs are among the best-selling overseas categories for Chinese automakers and the EU’s most likely next target. Higher market shares invite greater scrutiny.
For market selection, avoid over-relying on major Western European countries. The report notes Latin America already accounts for 14% of Chinese automakers’ overseas retail sales—markets without domestic automakers face lower barriers.
04 Only two paths forward, both slow
Localization dodges barriers, consolidation curbs cutthroat competition
The report’s final section, “Exit Strategies,” discusses how to navigate these challenges.
For overseas markets, the report states:
“Localization becomes the key mitigation tool.”
Source: J.P. Morgan, September 29, 2026
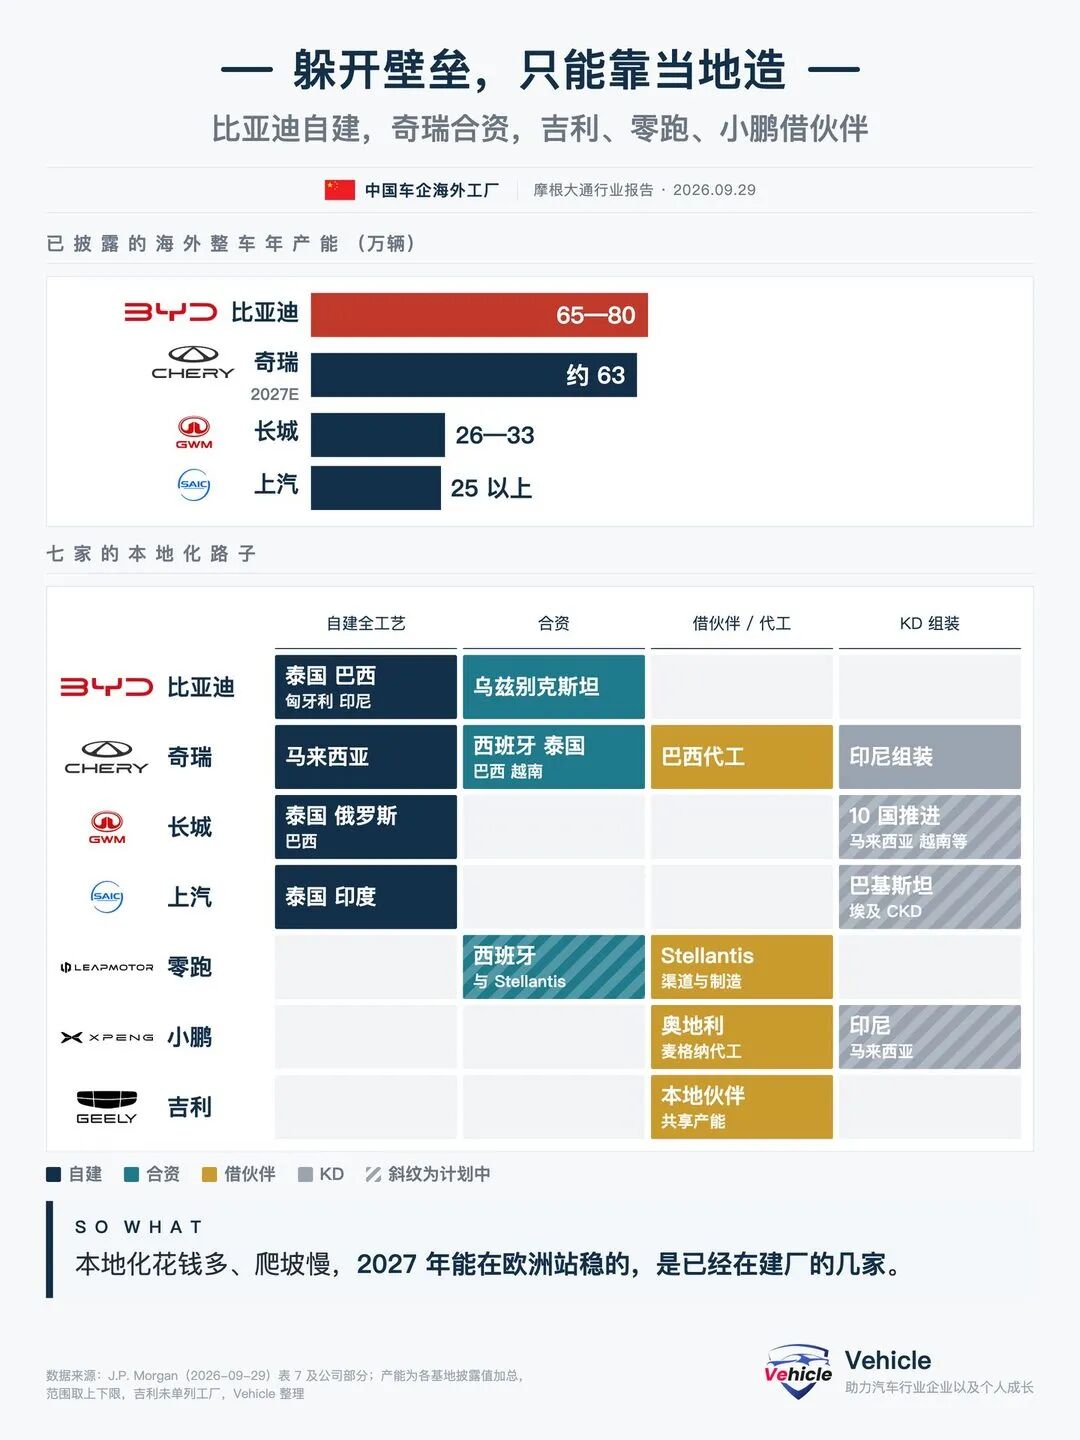
Approaches vary by company.
BYD: Building full-process factories in Thailand, Brazil, Hungary, and Indonesia. The report considers it best prepared for European expansion.
Chery: Self-owned facilities in Malaysia, joint ventures in Spain, Thailand, Brazil, and Vietnam, and assembly in Indonesia. Total capacity could reach ~630,000 units by 2027.
Geely: Partnering with local firms and sharing capacity to minimize heavy investments.
Leapmotor: Leveraging Stellantis’ channels and manufacturing, with KD assembly in Spain expected to start in Q4 2026.
XPeng: Contract manufacturing with Magna in Austria; KD operations in Indonesia and Malaysia.
Localization is no panacea. The report lists challenges: high capital expenditures, long ramp-up periods, skilled labor shortages, expensive energy, complex approvals, and union pressures.
This circles back to the second hurdle—falling profits. Where will localization funding come from?
Thus, I believe only companies already building factories or securing partners by 2027 will gain a foothold in Europe. Those starting site selection now will only arrive after 2028.
For domestic markets: consolidation
The report identifies supply-side reform as the solution, likely government-led.
A signal is FAW and GAC’s integration of Toyota’s China operations. The report views this as a critical node for further industry consolidation, suggesting their self-owned brands might also merge long-term.
But consolidation takes time. The report explicitly states no profit improvements will occur in the next 6–9 months. GAC Toyota’s sales have declined ~50% year-to-date.
In short, consolidation addresses problems beyond 2028. For 2027, companies must fend for themselves.
Finally, here’s a prompt to apply these three hurdles to your company using any large language model:
“I work at a [automaker/parts supplier] responsible for [domestic sales/overseas business/procurement/finance].
List the three areas our company will most likely be affected by in 2027, with three points for each hurdle.”
Array
Array
Array
Array
Array
Array
Array
Array
Array
Array
Array
Array
Array
Array
Array
Array
Array
Array
Array
Array
-
![]()
J.P. Morgan's 2027 Forecast for China's Auto Industry: Three Hurdles, Competing for Share in a Shrinking Market
-
![]()
Nominal vs. Effective Computing Power: Key Considerations for Autonomous Driving
-
![]()
Final Verdict: Unveiling the Scale of China’s Domestic Off-Road Vehicle Market
-
![]()
Geely Launches Global Dealer Recruitment Drive for Battery Sales!
-
AI Assistant: Beyond Mere 'Chatting'
-
![]()
68% of Notebook Production Costs Tied to CPU, Memory, and SSD! Manufacturers Grapple with Tough Choices
-
![]()
Young People’s Disillusionment with Mercedes-Benz and BMW: The Decline of the Premium Brand Pricing Model
-
![]()
Zunjie V800 Brake Pedal Bracket Base Upgrade Plan to Be Finalized by Month-End, With Upgrades Commencing in November