What Chinese Automakers Look Like in the Eyes of European Policy Circles
 11/17 2026
 436
When we discuss Chinese cars in Europe, we usually turn to the monthly sales rankings: who BYD has overtaken this time, where Leapmotor sits in the standings.
But European policy circles are watching a different scoreboard: after the tariffs came into force, have electric vehicles shipped from China actually declined?
On July 13, the European Federation for Transport and Environment (T&E) released a 44-page report, "The presence of Chinese carmakers in the EU auto market," tracking this very question all the way from 2020 to 2035.
T&E is headquartered in Brussels and has long been involved in lobbying on EU vehicle carbon emission regulations.
The report serves as a mirror: this is what Chinese automakers look like in the eyes of European policy circles.
Its core conclusion comes down to a single sentence: tariffs have had an effect, but they cannot stop Chinese EVs from continuing to grow in the EU.
The first prescription it offers the EU is to extend trade defenses to batteries.
I read all 44 pages from start to finish and will walk through them in the report's own order—what each page says, whether the numbers hold up, and what it all means for Chinese automakers and battery plants.
The Bottom Line in One Sentence
Imports of China-made BEVs have stabilized at about 350,000 units per year, accounting for 17% of EU BEV sales (peaking at 22% in 2024).
Among BEVs shipped from China, the share of Chinese brands rose from 35% to 54%.
Even after tariffs, Chinese-brand BEVs remain on average 21% cheaper.
Chinese brands' BEV share in 2035: about 15% if targets remain unchanged, up to about 30% if targets are relaxed.
EU battery imports from China grew sevenfold in five years, approaching US$30 billion, with tariffs of only 1%–3%.
The two-page summary at the beginning of the report is itself a comparison table. On the left is what tariffs achieved; on the right is what they did not.
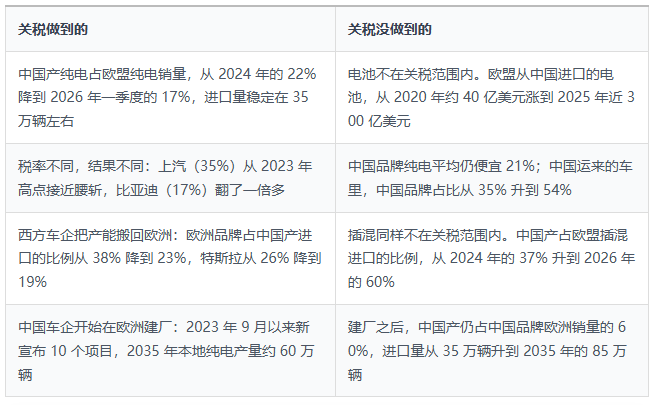
The EU's EV tariffs worked—but they will not stem the rise of Chinese EV sales into the EU.
— T&E report executive summary
01 Nearly 1 Million BEVs Exported Overseas in a Year
Context · Exports from Chinese automakers 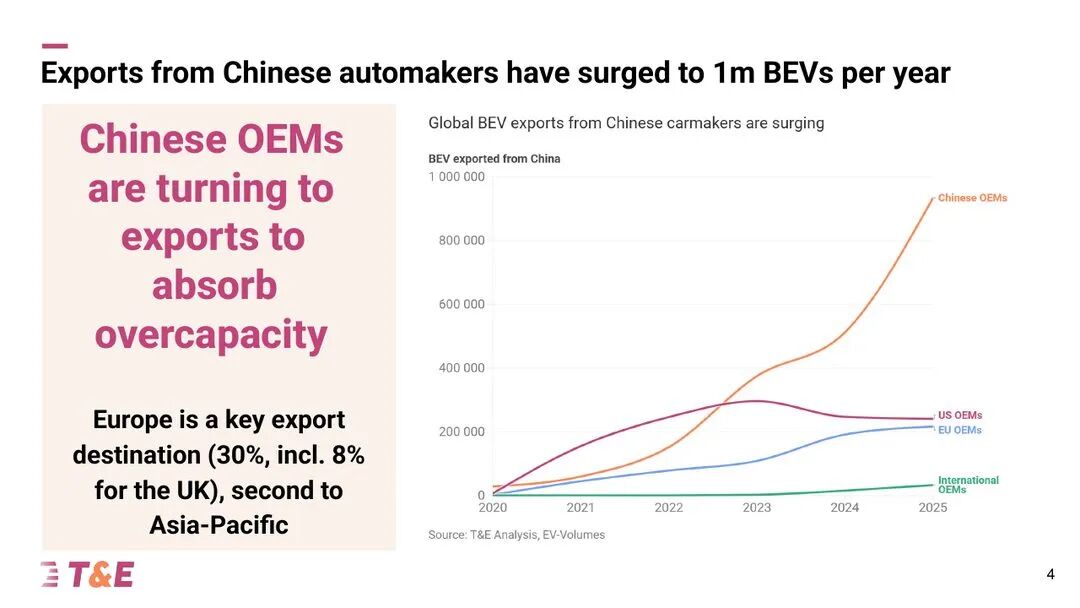
Page 4 of the report | BEVs exported from China, by automaker nationality
The main text opens with an export curve.
BEVs exported from China by Chinese brands numbered only about 30,000 in 2020, about 380,000 in 2023, and surged to around 930,000 in 2025 (estimated visually from the curve; the headline says 1 million).
The other three lines are almost flat.
US automakers—mainly Tesla's Shanghai plant—reached about 300,000 in 2023 and then fell back to 240,000.
European automakers accounted for about 220,000.
The headline T&E pairs with this chart: Chinese automakers are turning to exports to absorb overcapacity.
By destination, Europe accounts for 30%, of which the UK accounts for 8 percentage points, making it the second-largest destination after Asia-Pacific.
The conclusion page adds two pieces of context: the US market is effectively closed, and Europe is the main place where higher profits can be made.
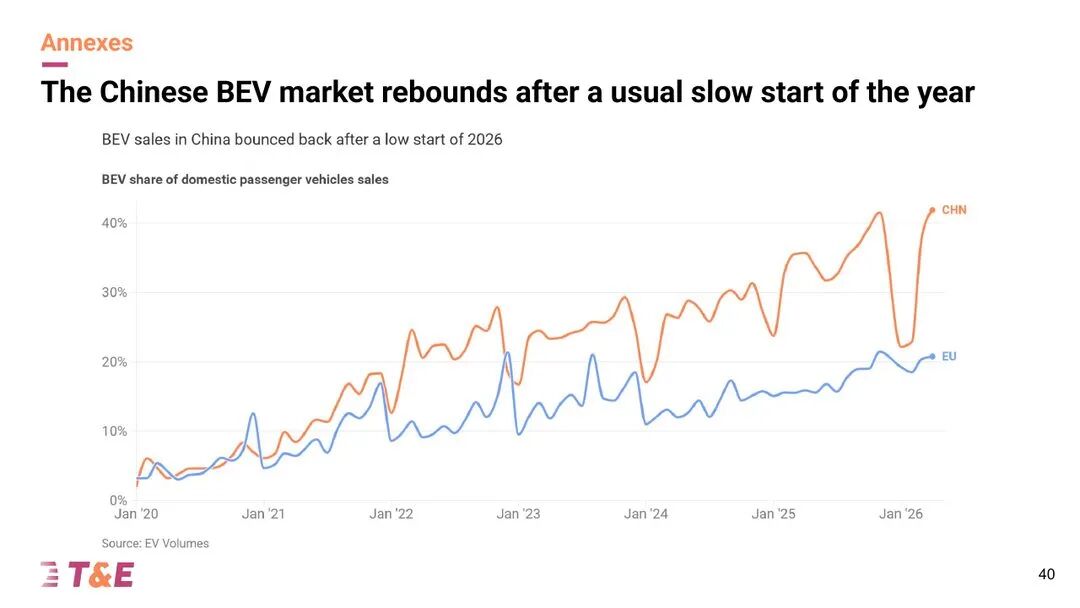
Page 40 of the report (appendix) | BEV share of domestic passenger car sales: China and the EU
An appendix chart responds to the claim that "Chinese EVs can't sell anymore."
According to the report, after China canceled EV subsidies in early 2026, the domestic BEV penetration rate fell from about 41% at the end of 2025 to about 22% at one point.
By the time the report was finalized, this line had already returned to about 42%. Over the same period, the EU was around 21%.
T&E's judgment is that China's electrification is still accelerating, and the portion that cannot be absorbed domestically will continue to flow outward.
02 350,000 Units Unchanged—But the Owners Changed
Section 1 · BEV imports from China: how effective were the tariffs? 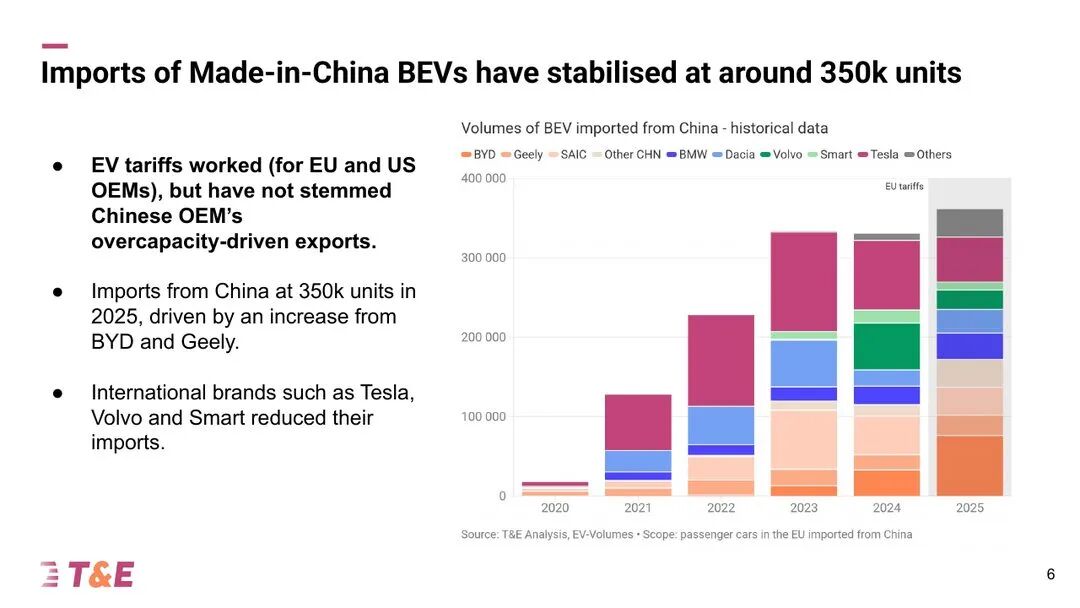
Page 6 of the report | Number of BEVs imported into the EU from China, by brand
First, look at volume.
BEVs shipped from China into the EU numbered fewer than 20,000 in 2020 and surged to about 330,000 in 2023.
Countervailing duties took effect in 2024; that year the figure was about 330,000.
In 2025 it was about 360,000 (estimated visually from the bar chart; the report text consistently says 350,000).
Total volume barely moved. What moved was the color inside the bars.
The segments for Tesla, Volvo, and Smart visibly shortened, while those for BYD and Geely lengthened.
BYD alone accounted for about 76,000 in 2025, up from just over 10,000 two years earlier.
T&E's argument is that tariffs worked on European and American automakers but failed to stop exports driven by Chinese automakers' overcapacity.
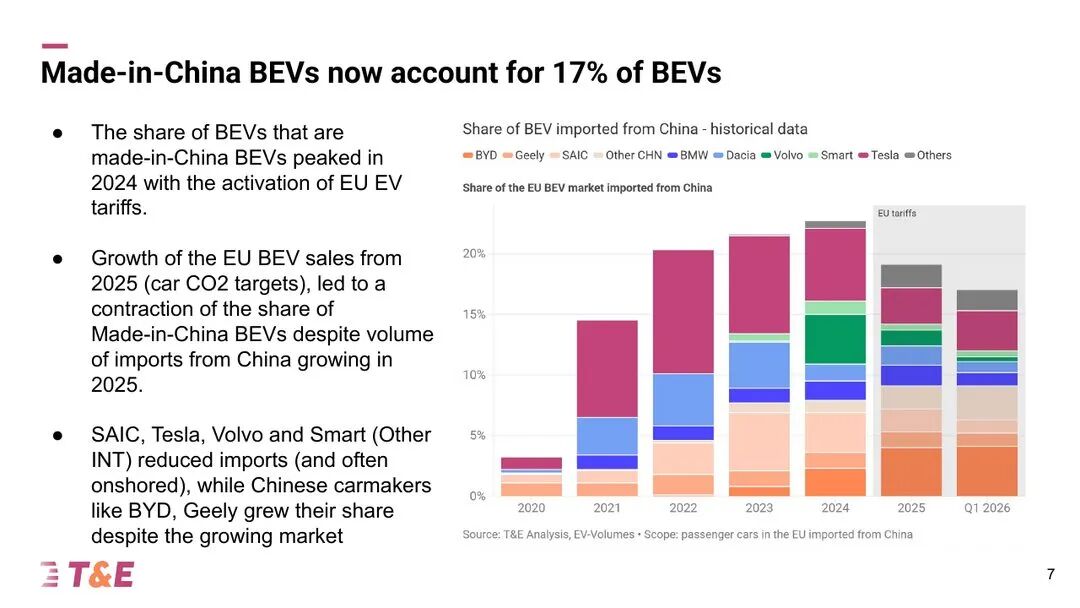
Page 7 of the report | China-made BEVs as a share of EU BEV sales
Now look at share. China-made BEVs as a share of EU BEV sales peaked in 2024 at about 22%.
In 2025 it fell to about 19%, and in Q1 2026 it was 17%.
Volume did not fall, but share did.
The reason lies in the denominator: EU carbon emission targets tightened in 2025, and the overall BEV market grew larger.
The share decline came from Europe's own EVs selling more, not from imports decreasing.
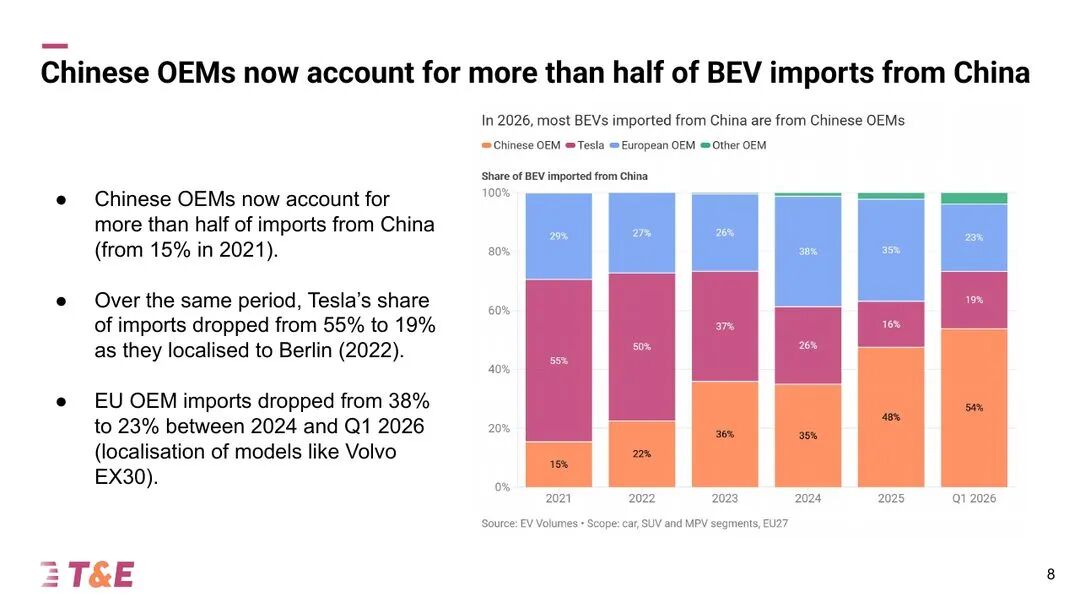
Page 8 of the report | Share of BEVs imported from China, by automaker nationality
The third chart is the core of this chapter. It breaks down BEVs shipped from China by brand nationality:
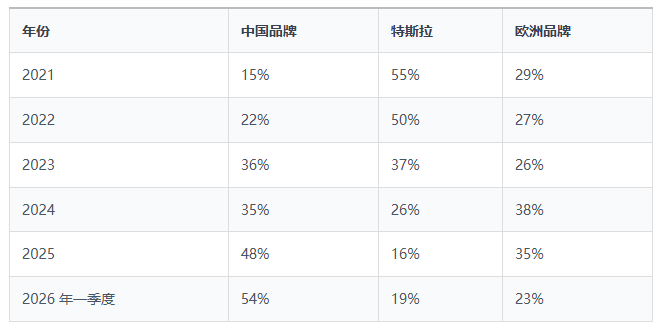
After Tesla's Berlin plant began production in 2022, the share of Shanghai exports to Europe kept falling.
The turning point for European brands came after 2024, as models such as the Volvo EX30 were moved back to production in Europe.
The space vacated was filled by Chinese brands.
Five years ago, only 15% of the EVs shipped from China carried Chinese brands; now it is 54%.
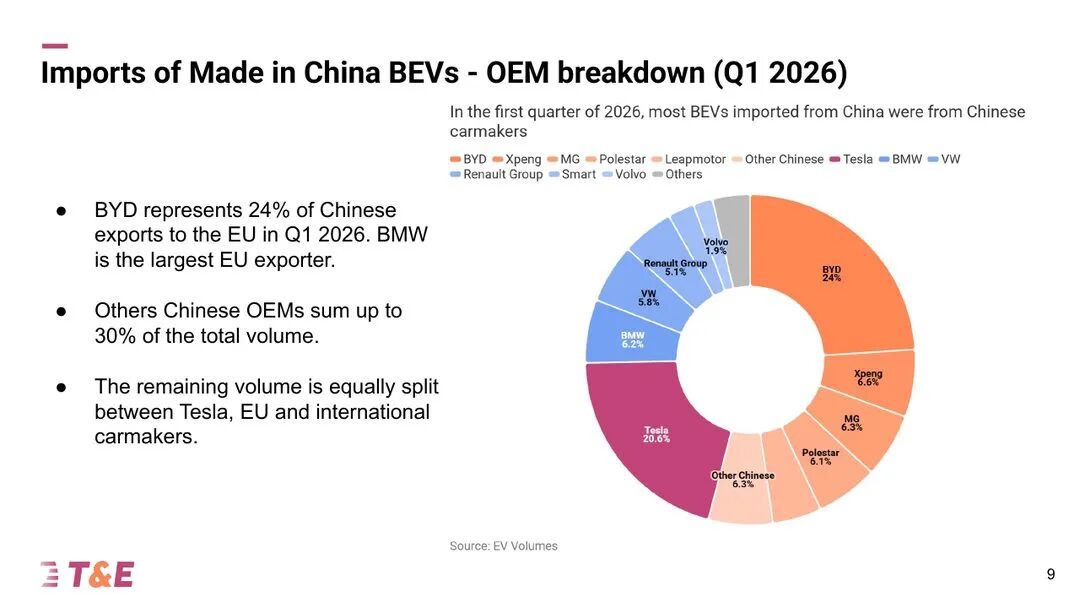
Page 9 of the report | Brand composition of BEV imports from China in Q1 2026
By brand in Q1 2026, BYD alone accounted for 24% and Tesla 20.6%.
After that came Xpeng at 6.6%, MG at 6.3%, BMW at 6.2%, Volkswagen at 5.8%, Polestar and Renault Group at 5.1% each, and Volvo at only 1.9%.
Among European automakers, BMW imports the most from China. Polestar is counted as a Chinese brand in this chart.
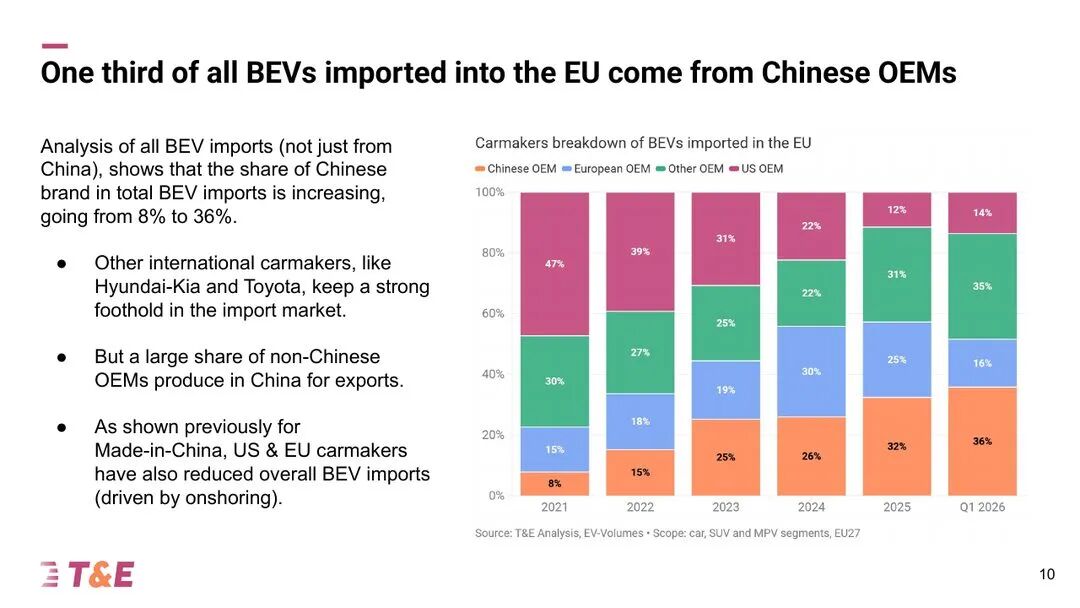
Page 10 of the report | Share of all BEVs imported by the EU, by automaker nationality
The previous charts looked only at China-made BEVs. This page broadens the scope to all BEVs imported by the EU, regardless of where they are produced.
The share of Chinese brands rose from 8% in 2021 to 36% in Q1 2026—more than one-third.
US brands fell from 47% to 14%.
European brands' own imports fell from 30% in 2024 to 16%.
Other international brands such as Hyundai-Kia and Toyota held on to 35%.
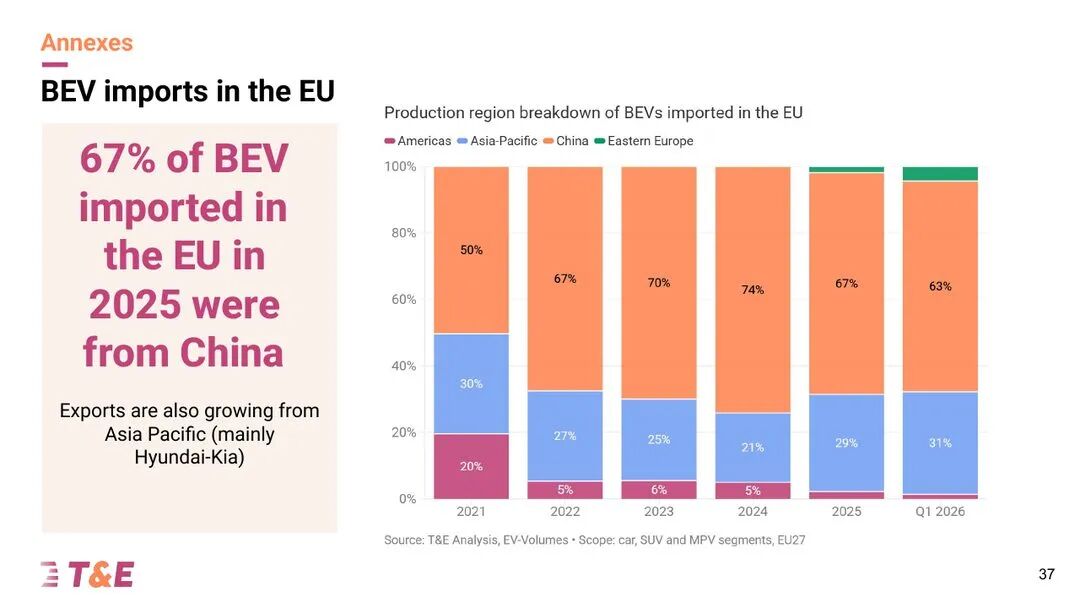
Page 37 of the report (appendix) | Share of EU BEV imports, by origin
Appendix page 37 switches to the origin basis: in 2025, 67% of BEVs imported by the EU came from China, after peaking at 74% in 2024.
In Q1 2026 it was 63%. Other Asia-Pacific regions rebounded to 31%, mainly Hyundai-Kia.
Looking back at this chapter, tariffs drove European and American brands' production back to Europe, while Chinese brands stayed on board and even loaded more.
03 An 18-Point Tariff-Rate Gap Flips the Curve
Section 1 · Price gap and tariff effect: BYD vs SAIC 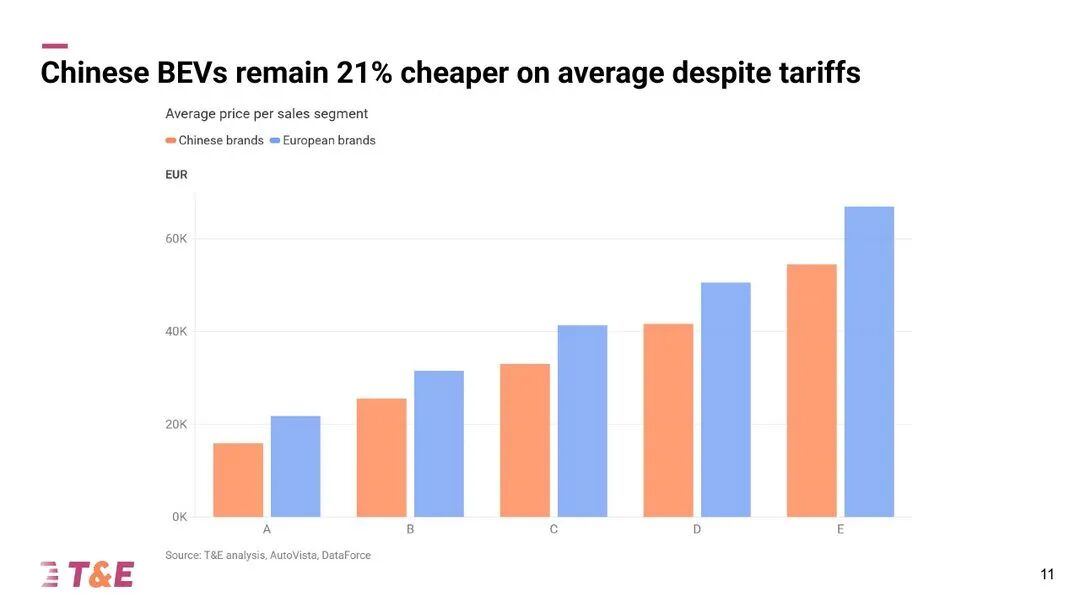
Page 11 of the report | Average price by segment: Chinese brands vs European brands
Even after tariffs, Chinese-brand BEVs remain on average 21% cheaper than European brands.
The chart divides vehicles into five segments, A to E, and Chinese brands are cheaper in every segment.
Visually, segment A is about €16,000 versus €22,000, segment C about €33,000 versus €41,000, and segment E about €55,000 versus €67,000.
This is a comparison of average prices by segment. The report does not specify whether list prices or transaction prices are used, nor does it adjust for equipment.
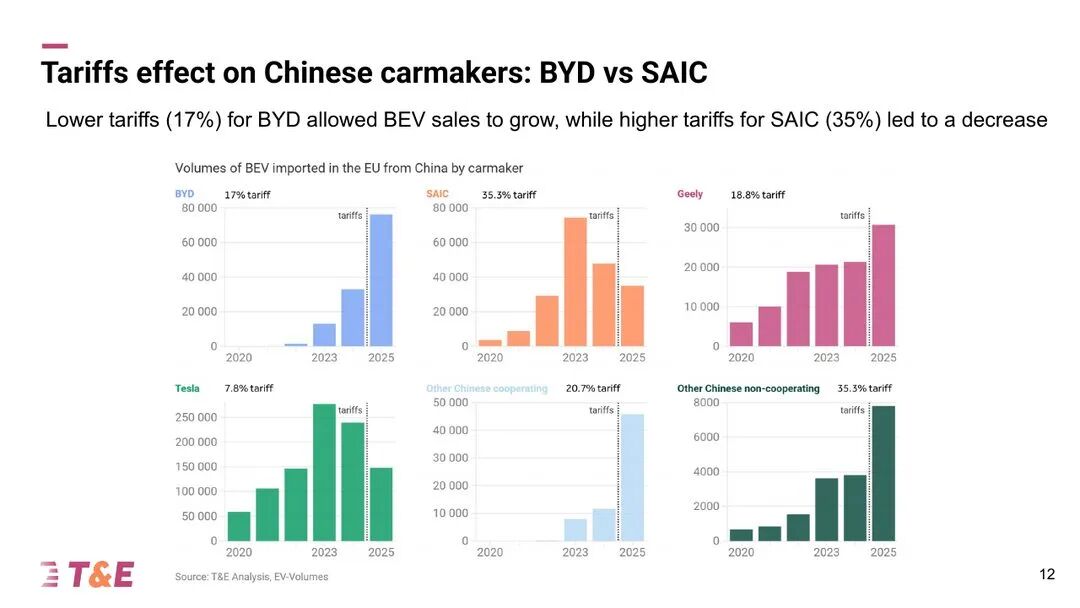
Page 12 of the report | Number of BEVs imported from China by each automaker and the corresponding countervailing duty rate
Page 12 is the most interesting chart in the whole report: six small charts, six tariff-rate tiers.
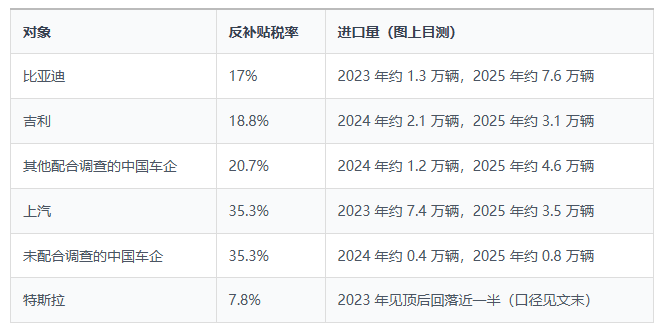
T&E's reading is very direct. BYD, with the lower tariff rate, more than doubled its sales;
SAIC, with the highest tariff rate, fell by about half from its 2023 peak.
The point it wants to make is that Chinese automakers are highly sensitive to tariff rates, and different rates set by the EU produce different outcomes.
There are also counterexamples in the same chart.
The group that did not cooperate with the investigation also faced 35.3%, and its sales also doubled in 2025, but from a very small base of less than 10,000 units.
So tariff rates explain SAIC, but not everything.
SAIC (mainly MG) was the Chinese automaker with the largest BEV imports from China in 2023; with the largest base, it was also hit most directly.
The report does not break down other factors.
One piece of background the report does not mention: these are countervailing duties, which must be added on top of the regular 10% import tariff.
For Chinese automakers, the meaning of this page is clear: an 18-point tariff-rate gap is enough to rewrite a brand's curve in Europe.
04 The Half That Tariffs Did Not Cover
Section 2 · How do BEVs compare with other powertrains? 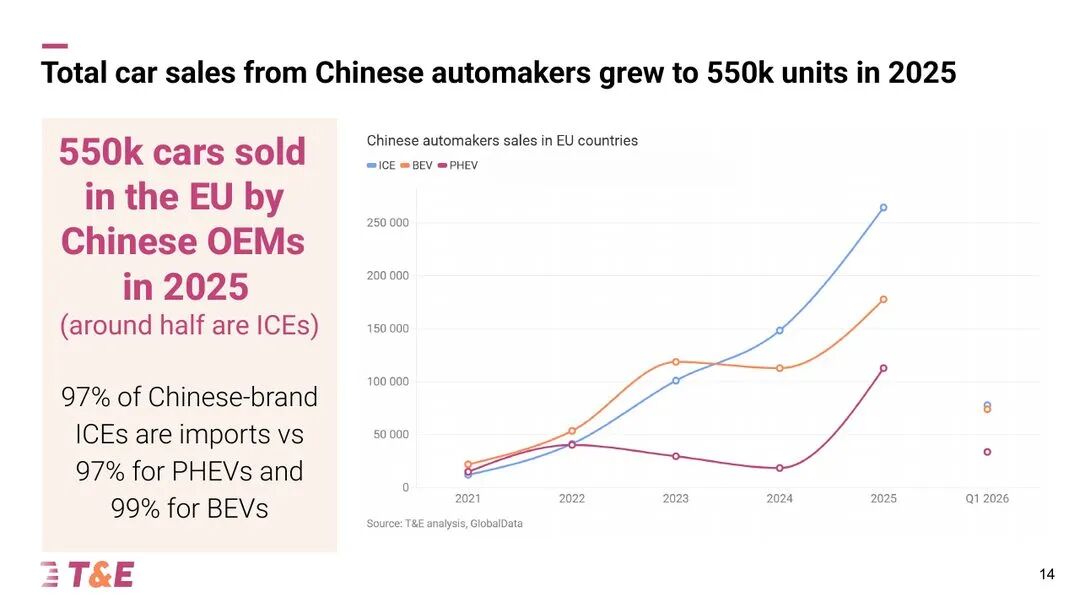
Page 14 of the report | Sales of Chinese automakers in the EU, by powertrain type
Tariffs only cover BEVs. Once all powertrain types are laid out, the picture looks different.
In 2025, Chinese automakers sold about 550,000 vehicles in the EU in total, nearly half of which were ICE vehicles.
Visually from the chart: about 265,000 ICE vehicles, about 178,000 BEVs, and about 113,000 plug-in hybrids.
And almost all were imported. ICE vehicles 97%, plug-in hybrids 97%, BEVs 99%.
The PHEV line is the steepest. In 2024 it was under 20,000 units, and in 2025 it jumped directly to over 110,000 units.
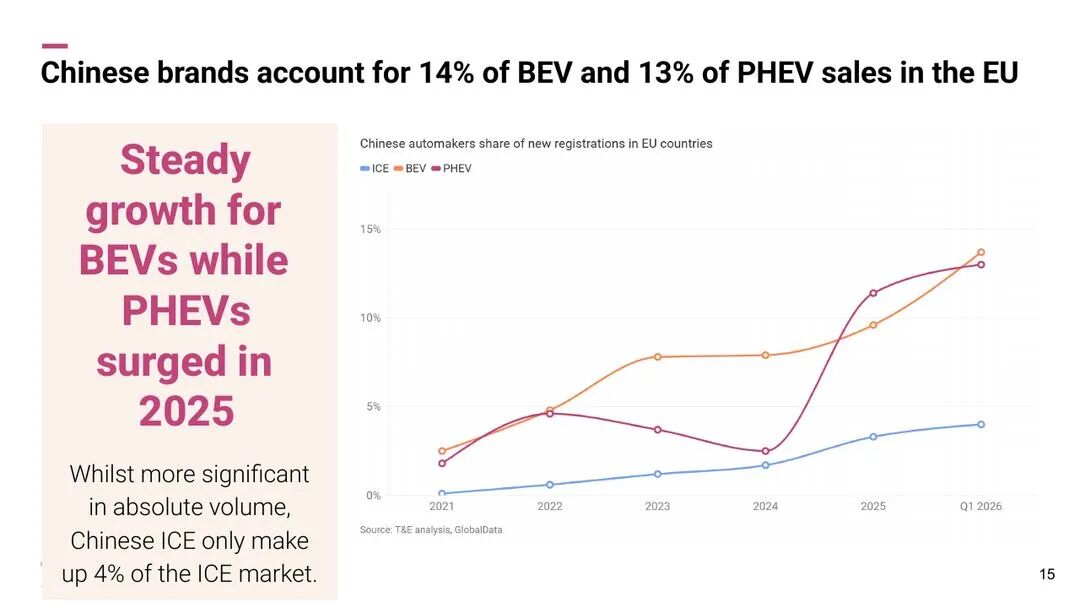
Report page 15 | Share of EU new car registrations held by Chinese automakers, by powertrain type
Switching to share: in Q1 2026, Chinese brands captured 14% of EU BEV registrations and 13% of PHEV registrations.
BEVs climbed up step by step, from 7.8% in 2023 to 9.6% in 2025.
PHEVs jumped from 2.5% to 11.4% within a single year in 2025.
ICE vehicles sell the most, but they account for only 4% of the EU ICE market.
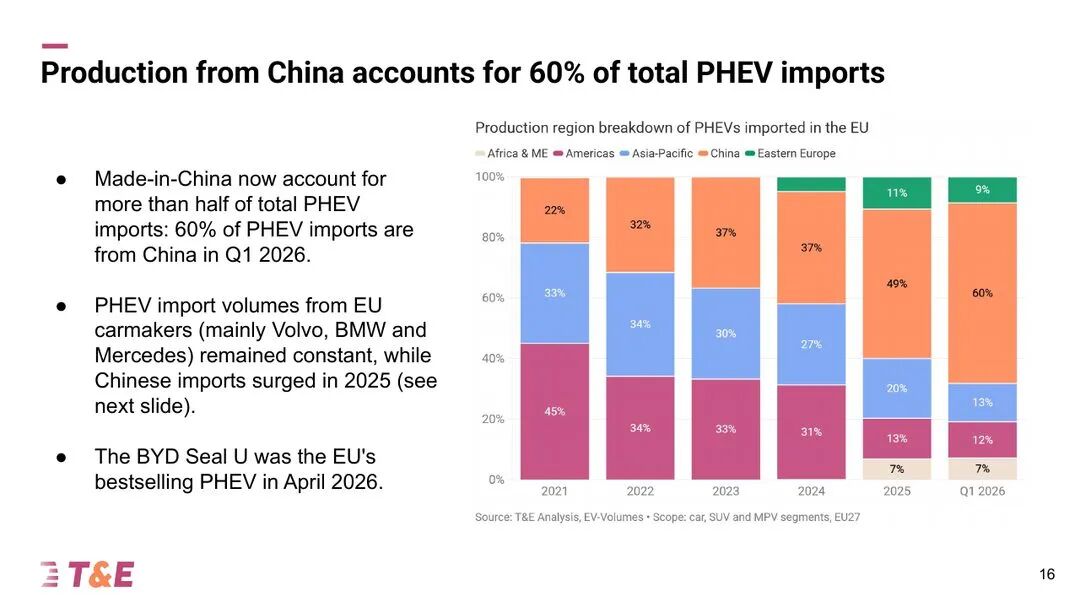
Report page 16 | Share of EU-imported PHEVs by country of origin
The shift in origin of imported PHEVs is even more direct.
The share from China was 37% in 2024, 49% in 2025, and 60% in Q1 2026.
The Americas fell from 45% in 2021 to 12%, and the rest of Asia-Pacific fell from 33% to 13%.
In April 2026, BYD Seal U (the domestic Song PLUS) was the best-selling PHEV model in the EU.
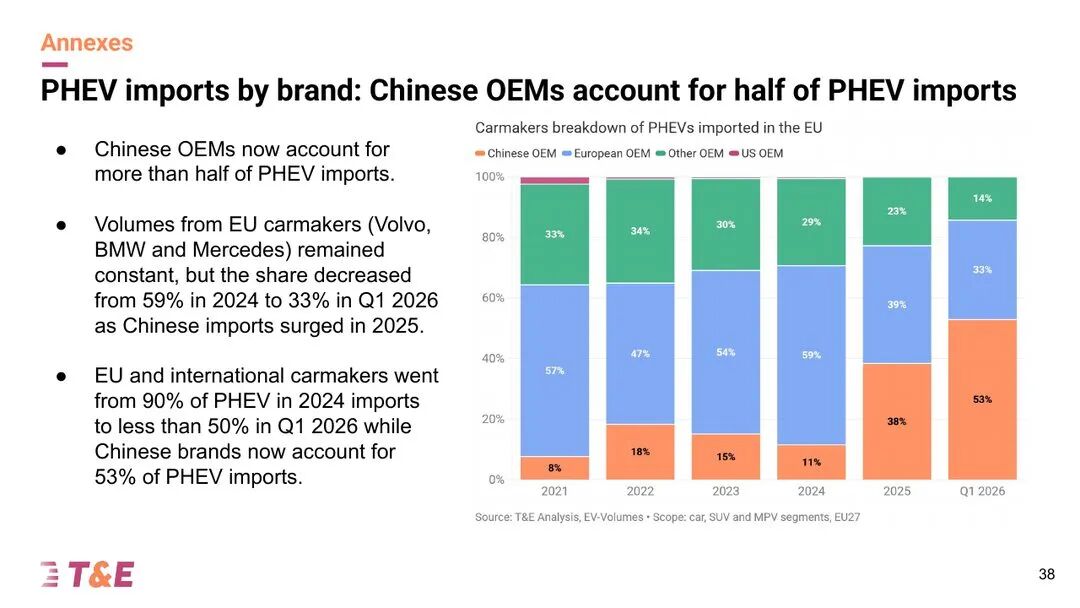
Report page 38 (appendix) | Share of EU-imported PHEVs by automaker nationality
Appendix page 38 breaks it down again by brand.
Among imported PHEVs, Chinese brands accounted for 11% in 2024 and 53% in Q1 2026.
European brands are mainly Volvo, BMW, and Mercedes-Benz; their import volume did not change, but their share was diluted from 59% to 33%.
T&E places this in the column of "what tariffs failed to do": PHEVs are outside the scope of tariffs, so they became the new channel.
This report was published in July. What happened afterward, I covered in the Bernstein export tracker piece.
According to Bernstein's report, on October 9 China and the EU reached a consensus on hybrid exports, with an annual import target of about 400,000 units.
This is second-hand information and is not in the T&E report.
05 2035: 15% or 30%
Section 3 · 2030s outlook 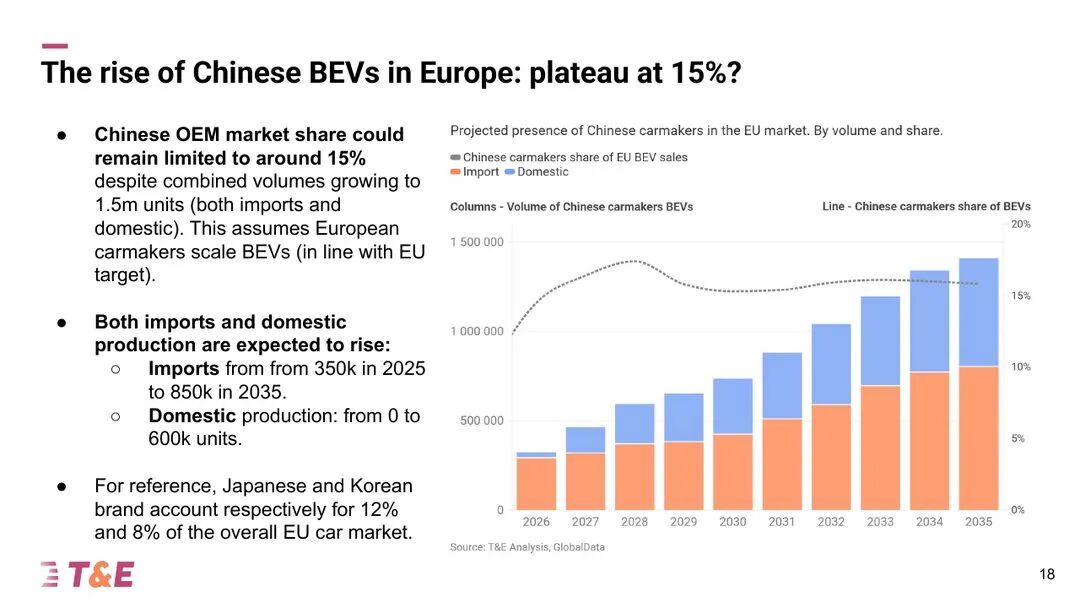
Report page 18 | Forecast of Chinese automakers' BEV sales (imports + local production) and share in the EU
Looking ahead ten years. T&E used GlobalData's forecast to draw a baseline chart.
Chinese brands' BEV sales in the EU are projected to rise from about 320,000 units in 2026 to about 1.5 million units in 2035 (the bar chart visually suggests about 1.41 million).
Of that, about 850,000 units are imported from China, and about 600,000 units are produced locally in Europe.
Volume grows more than fourfold, yet share stays around 15%.
The dashed line on the chart climbs to roughly 17.5% in 2028 before falling back to around 16% and then flattening out.
The premise appears in parentheses: European automakers must scale up their own BEVs in line with the EU's current targets.
T&E also offers a reference point: Japanese brands now hold 12% of the overall EU car market, while Korean brands account for 8%.
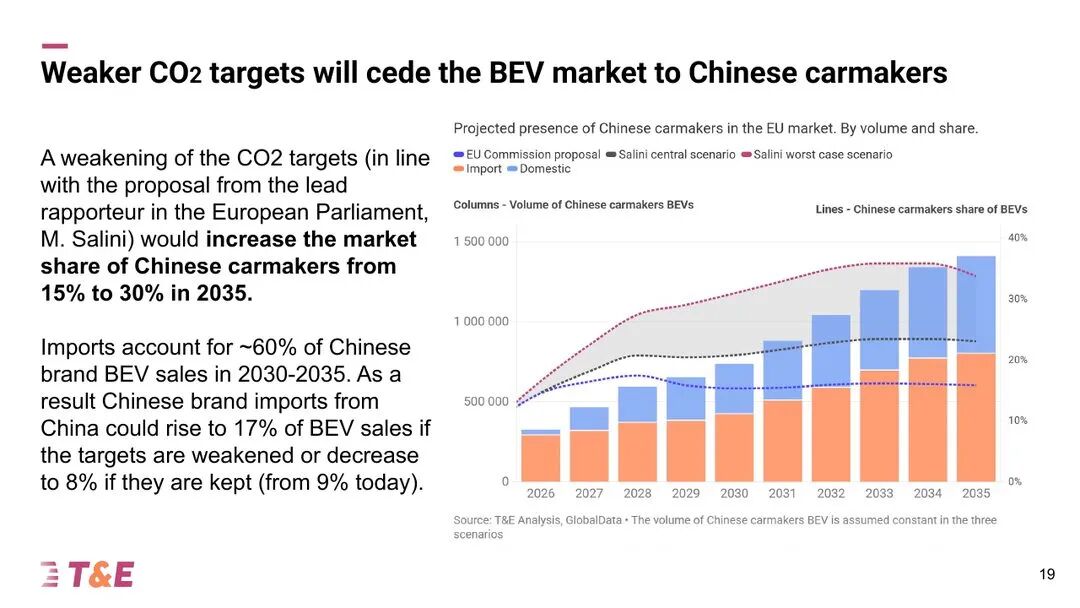
Report page 19 | Chinese automakers' BEV share under three carbon emission target scenarios
The next page is where the report's central argument lies.
At the time of publication, the European Parliament was discussing revisions to automotive carbon emission targets, and the lead rapporteur, M. Salini (provisional translation), had proposed a more lenient plan.
According to the methodology note in the appendix, the European Commission's plan corresponds to BEV penetration of 44% in 2030 and 83% in 2035.
The Salini plan calls for 22% in 2030 and 39% in 2035.
T&E overlays three lines on the same set of bars:
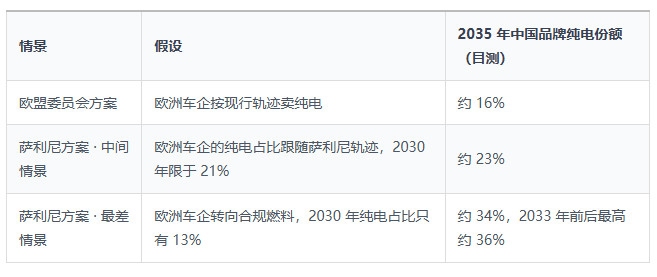
The main text states the conclusion as "rising from 15% to 30%."
To read this chart, one assumption must be made clear, and it is written in the caption: under all three scenarios, Chinese brands' BEV sales are the same set of numbers—not a single additional vehicle sold.
The share doubles entirely because the denominator shrinks. European automakers sell fewer BEVs, and the market naturally opens up.
T&E carried the calculation further. Imports account for about 60% of Chinese brands' BEV sales.
Therefore, the share of China-produced Chinese-brand BEVs in EU BEV sales would rise to 17% if targets are relaxed and fall to 8% if targets are maintained.
It currently stands at 9%.
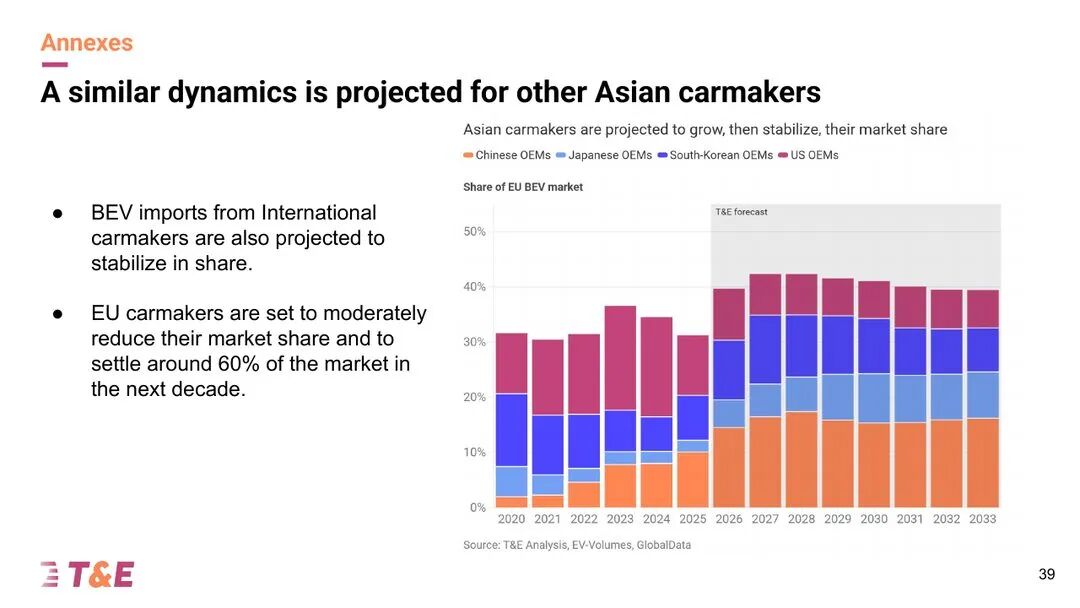
Report page 39 (appendix) | Forecast of Chinese, Japanese, Korean, and US automakers' share of the EU BEV market
Appendix page 39 also includes Japanese, Korean, and US brands. Their trajectories are similar: rise first, then flatten.
European automakers' BEV share will decline slightly and stabilize at around 60% over the next decade.
Putting this chapter together, what T&E wants to tell the European Parliament is this: relaxing targets cannot protect European automakers; it will only hand the BEV market to Chinese brands.
06 From 0 to 1 million units, the ships still have to keep sailing
Section 3 · Chinese production in the EU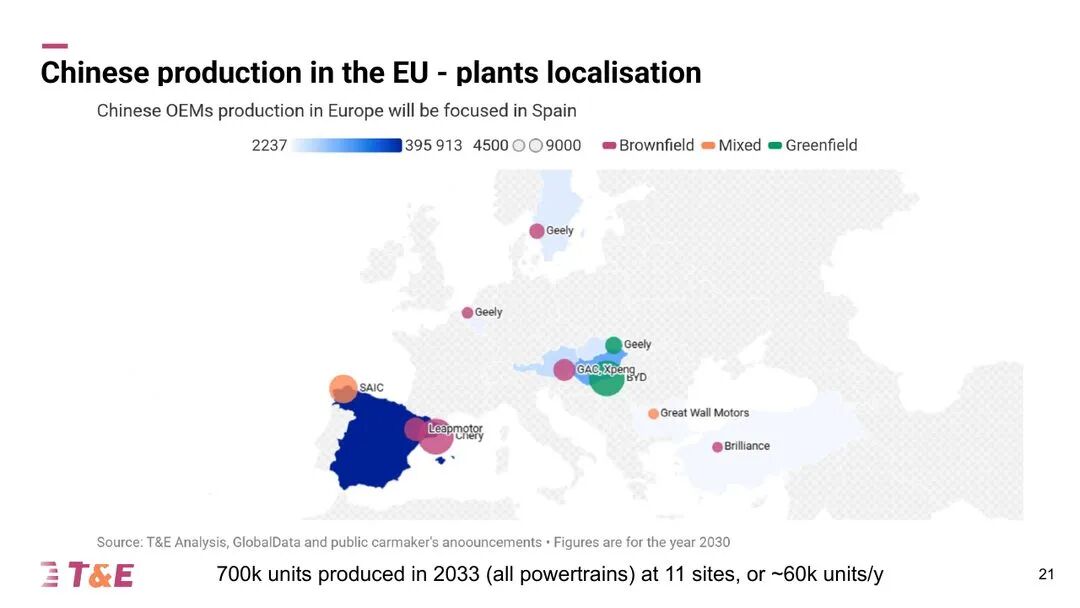
Report page 21 | Distribution of Chinese automakers' factories in Europe (2030 output)
Another result of tariffs is factory building.
The report counts that since the European Commission president announced the launch of the anti-subsidy investigation in September 2023, Chinese automakers have announced 10 new production projects in Europe.
The darkest color on the map is Spain.
Chery is in Barcelona, Leapmotor in Zaragoza, SAIC in Galicia, and Geely in Valencia—four projects in one country.
Hungary has BYD's Szeged plant, and Turkey has BYD and Brilliance.
The three clusters named in the summary are Turkey, Hungary, and Spain.
There is a line of small text in the footer: by 2033, 11 sites will total about 700,000 units (all powertrain types), averaging about 60,000 units per plant.
This scale is not large. Most projects are brownfield, using others' old factory buildings.
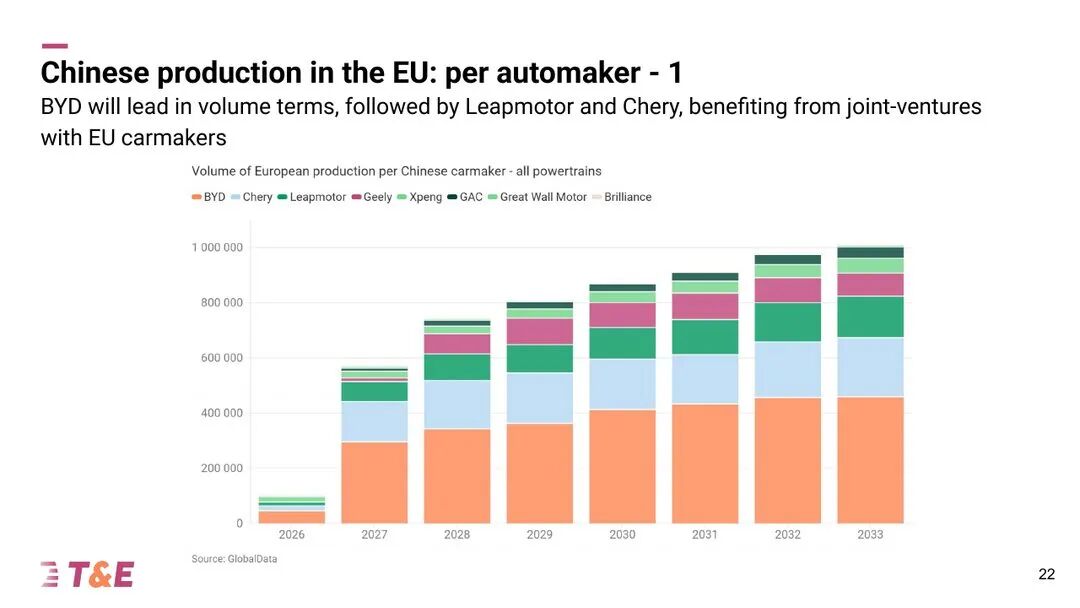
Report page 22 | Forecast of each Chinese automaker's European output (all powertrain types)
Broken down by automaker, European output is about 100,000 units in 2026, jumps to about 570,000 units in 2027, and reaches about 1 million units in 2033.
BYD ranks first, with about 460,000 units in 2033.
Chery about 210,000 units, Leapmotor about 150,000 units, Geely about 80,000 units, XPeng about 55,000 units, and GAC about 40,000 units.
All of the above are visual estimates from the bar chart.
The subtitle points out the path for Chery and Leapmotor: borrowing European automakers' joint ventures.
Chery relies on Spain's Ebro, and Leapmotor relies on Stellantis.
The steepest segment of this curve is from 2026 to 2027, with nearly 500,000 additional units in one year.
The appendix notes that BYD's Turkey plant was suspended as of June 2026.
The report does not say whether the forecast deducts it.
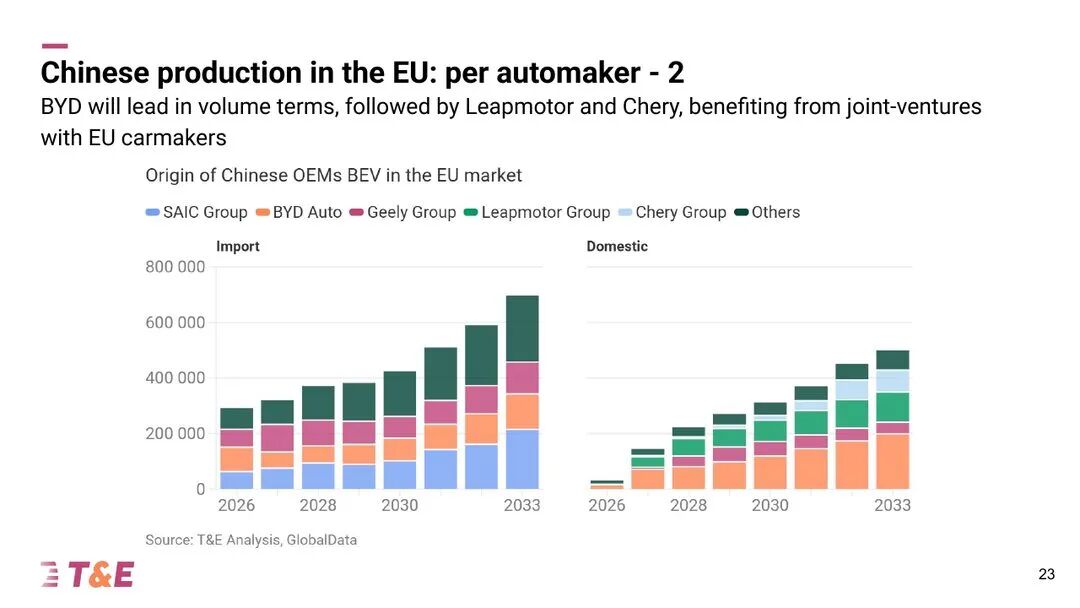
Report page 23 | BEVs sold by Chinese automakers in the EU: imports and local production
This page looks only at BEVs, split into imports and local production in Europe.
Imports: about 290,000 units in 2026 and about 700,000 units in 2033.
Local production: about 30,000 units in 2026 and about 500,000 units in 2033.
In other words, even after the factories are built, the number of vehicles shipped from China will more than double.
In the chart, the largest importer in 2033 is SAIC, with about 210,000 units.
The largest local producer is BYD, with about 200,000 units, followed by Leapmotor and Chery.
The summary states that even with localization, by 2035 China-produced vehicles will still account for 60% of Chinese brands' European BEV sales.
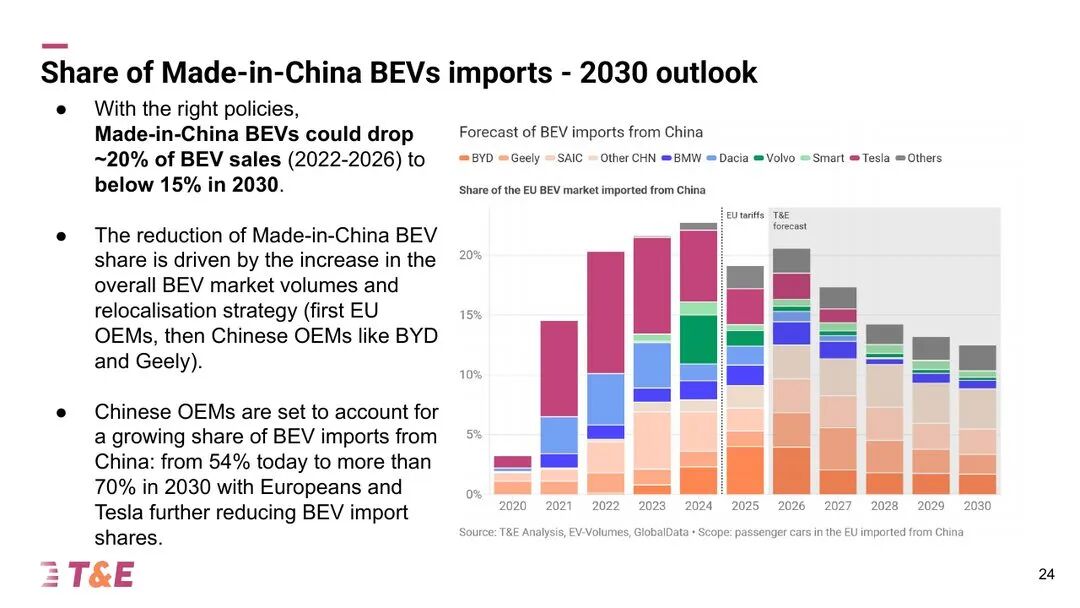
Report page 24 | China-produced BEVs as a share of EU BEV sales, forecast to 2030
Back to the metric of "China-produced BEVs as a share of EU BEV sales."
T&E forecasts that it will fall from around 20% in 2022–2026 to below 15% in 2030.
The chart shows about 12.5% in 2030.
The decline comes from two things: the overall BEV market growing larger, and production being brought back.
First European automakers, then Chinese automakers such as BYD and Geely.
At the same time, among BEVs shipped from China, the share of Chinese brands will rise from the current 54% to over 70% by 2030.
European brands and Tesla will continue to exit this route. The title also carries a premise: "with the right policies."
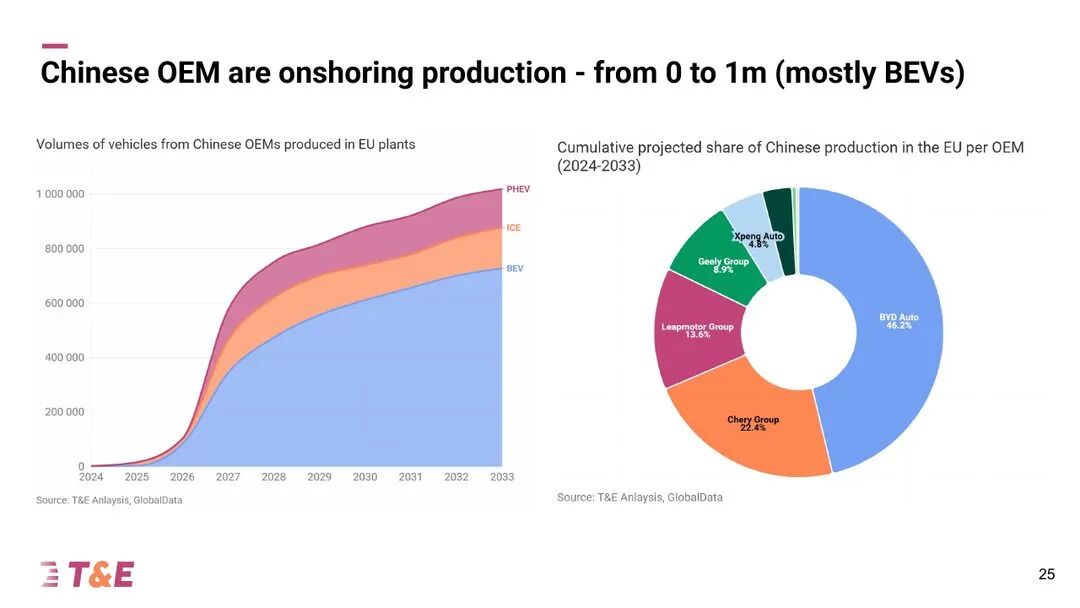
Report page 25 | Output of Chinese automakers' EU factories and each company's cumulative share (2024–2033)
The final page totals it up: output of Chinese automakers' EU factories goes from 0 to about 1 million units.
In 2033, about 730,000 units are BEVs, about 150,000 ICE, and about 140,000 PHEVs.
Cumulatively from 2024 to 2033, BYD accounts for 46.2%, Chery 22.4%, Leapmotor 13.6%, Geely 8.9%, and XPeng 4.8%.
The top three take more than 80%.
Appendix page 41 lists these plants in a table, which I have transcribed as follows:
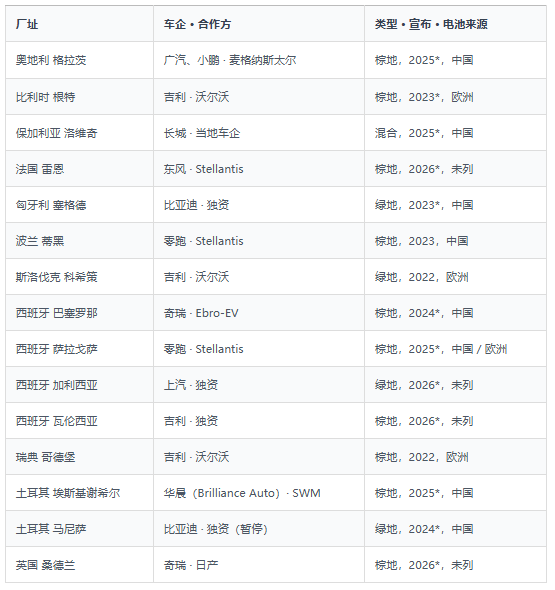
Items marked with * are projects announced after September 2023.
"Wholly owned" is my wording; the partner column in the original table is blank.
There are two details in the table.
In the battery source column, the only ones marked "Europe" are Geely's three plants borrowing Volvo's; all others with a specified source have Chinese supply.
In the type column, 10 of the 15 sites are brownfield, and only 4 are greenfield.
The summary also includes a line: Chinese brands' BEVs could squeeze out about 10 traditional car plants.
There is no corresponding chart or calculation process for this number.
Looking back at this chapter, localization is real, but according to T&E's methodology, it cannot replace imports; the two lines will rise together.
07 Batteries: a door that collects only 1% to 3% in tariffs
Section 4 · Batteries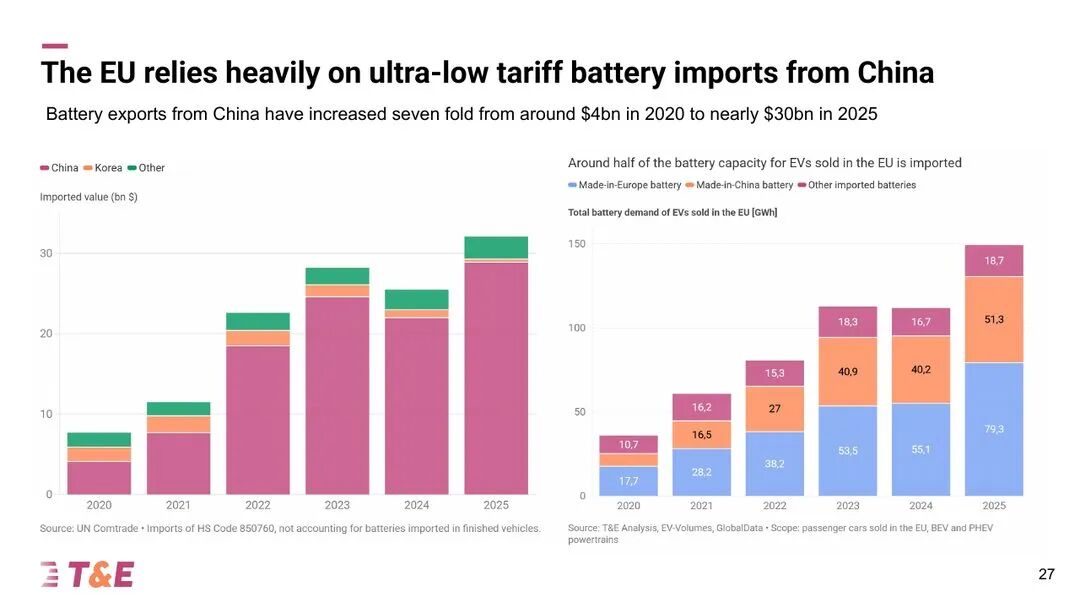
Report page 27 | EU lithium battery import value (left) and battery sources of EVs sold in the EU (right)
The final part of the report turns to batteries. This is the biggest gap T&E believes tariffs have left.
The left chart shows the EU's lithium battery import value.
The portion imported from China was about $4 billion in 2020 and nearly $30 billion in 2025, sevenfold in five years.
South Korea and other sources combined are about $3 billion.
The statistical basis is HS code 850760, excluding batteries that come in installed in complete vehicles.
The right chart switches to electricity volume.
In 2025, EVs sold in the EU (BEVs plus PHEVs) used a total of about 149 GWh of batteries.
Europe produced 79.3 GWh, China produced 51.3 GWh, and other imports accounted for 18.7 GWh.
Imports total 70 GWh, or 47%. China alone accounts for one-third.
For battery import tariffs, the conclusion page states 1% to 3%.
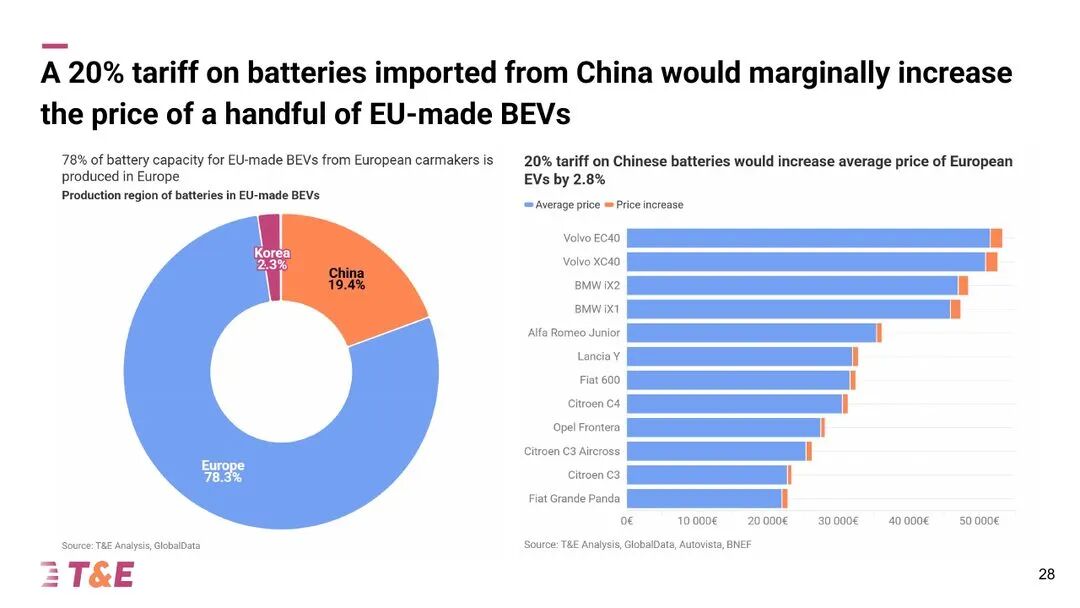
Page 28 of the report | Battery origins for EU-produced BEVs by European automakers (left) and the price impact of a 20% battery tariff (right)
T&E then did the math: if a 20% tariff is imposed on Chinese batteries, how much more expensive will European cars become.
First, look at the exposure.
For BEVs produced by European automakers in the EU, 78.3% of batteries are made in Europe, 19.4% come from China, and 2.3% come from South Korea.
T&E listed 12 affected models: Volvo EC40, XC40, BMW iX2, iX1, and the remaining 8 all come from Stellantis.
For example, the Fiat Grande Panda, Citroen C3, and Opel Frontera.
The average selling price of these cars would rise by 2.8%.
T&E's conclusion is that the impact is small, involving only a few models.
However, more than half of the list are entry-level EVs priced at 20,000 to 30,000 euros, exactly the batch European automakers use to compete on price with Chinese brands.
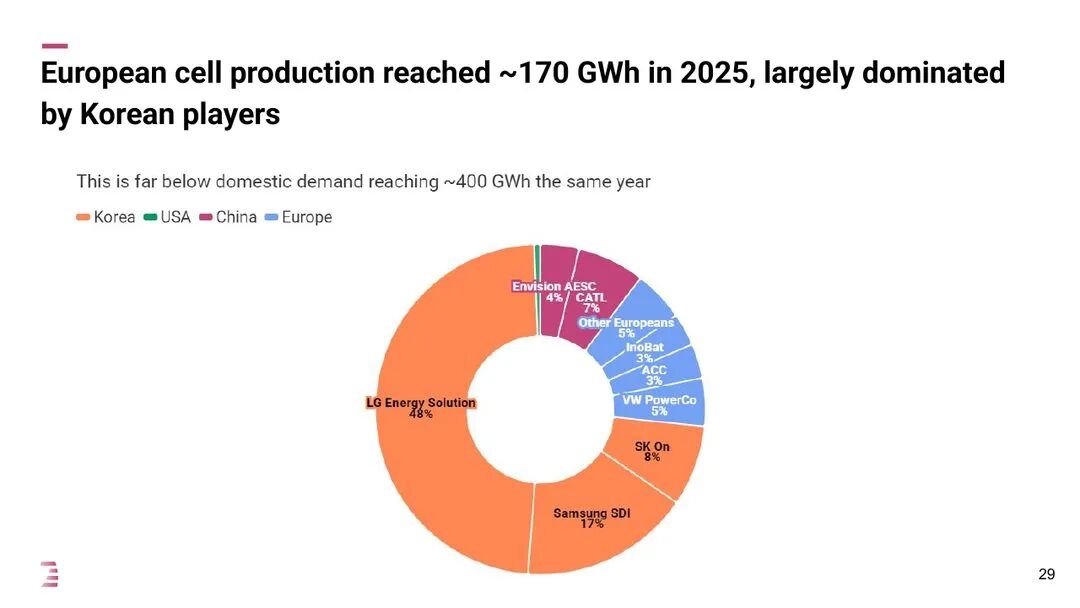
Page 29 of the report | 2025 European cell production, by company
Europe's own cell production in 2025 was about 170 GWh, while demand that year was about 400 GWh.
Of that 170 GWh, South Korean companies accounted for 73%: LG Energy Solution 48%, Samsung SDI 17%, SK On 8%.
Chinese companies accounted for 11%: CATL 7%, AESC 4%.
European local companies combined accounted for about 16%: Volkswagen PowerCo 5%, ACC 3%, InoBat 3%, others 5%.
Of every six cells made in Europe, only one comes from a European company.
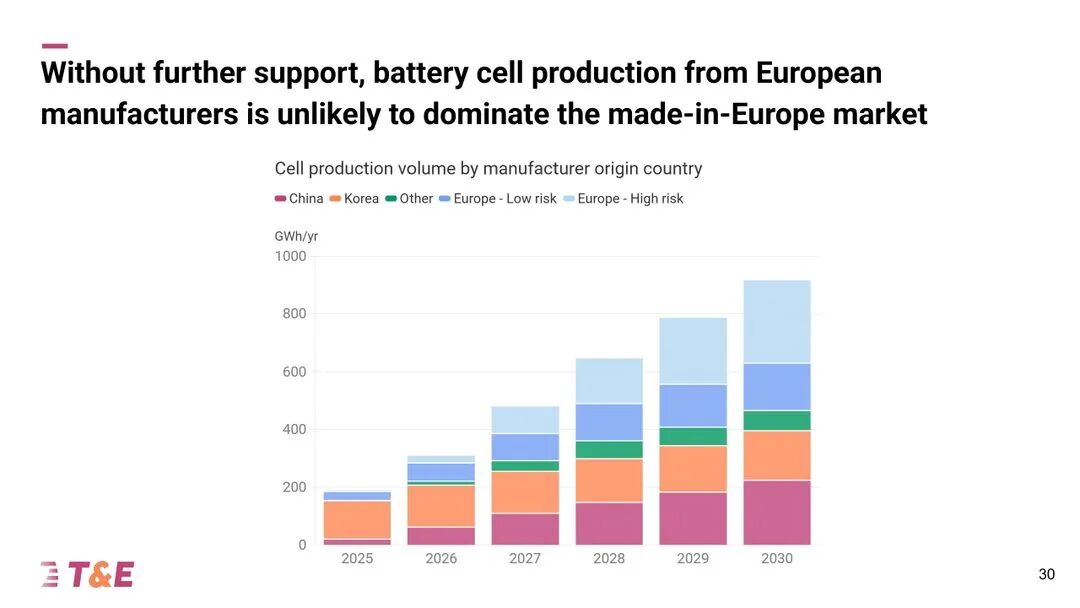
Page 30 of the report | Forecast of European cell production, by company nationality
Looking ahead to 2030, T&E ranked European cell production by company nationality and also divided European local projects into low-risk and high-risk tiers.
The 2030 total is about 920 GWh (roughly estimated).
Chinese companies about 225, South Korean companies about 170, others about 70, European low-risk about 165, European high-risk about 290.
Chinese companies had only about 20 GWh in 2025, and would need to grow tenfold in five years.
In other words, setting high-risk projects aside, by 2030 the largest producer of cells in Europe will be Chinese companies.
The title means: without more support, European local battery plants will find it hard to dominate "Made in Europe."
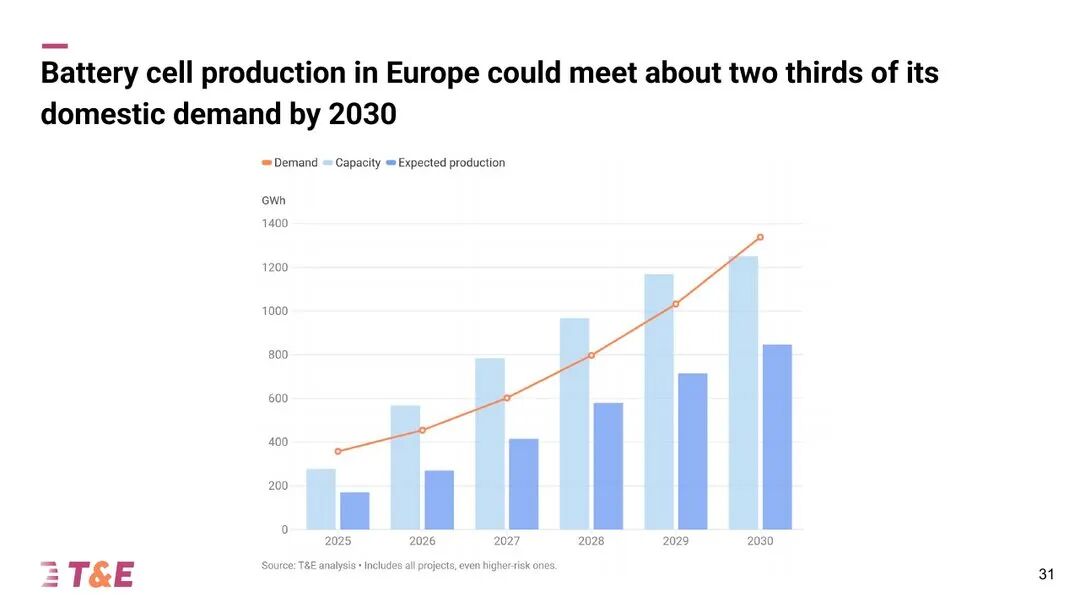
Page 31 of the report | European battery demand, nominal capacity, and expected output
The overall supply-demand balance: in 2030, European battery demand will be about 1340 GWh, nominal capacity about 1250 GWh, and expected output about 850 GWh.
Expected output can cover about two-thirds of demand. A footnote states that this already includes all high-risk projects.
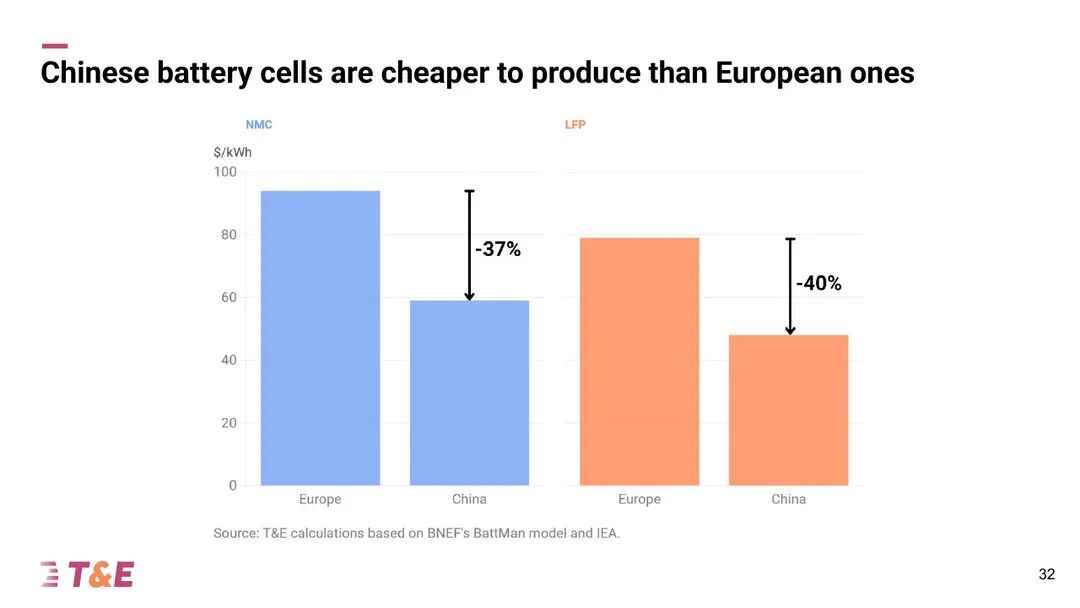
Page 32 of the report | Cell production costs: Europe and China
Why are European battery plants so struggling? The answer lies in cost.
T&E used BloombergNEF's BattMan model and International Energy Agency data to calculate two types of cells.
NMC cells cost about 94 USD/kWh in Europe, 37% lower in China.
LFP cells cost about 79 USD/kWh in Europe, 40% lower in China.
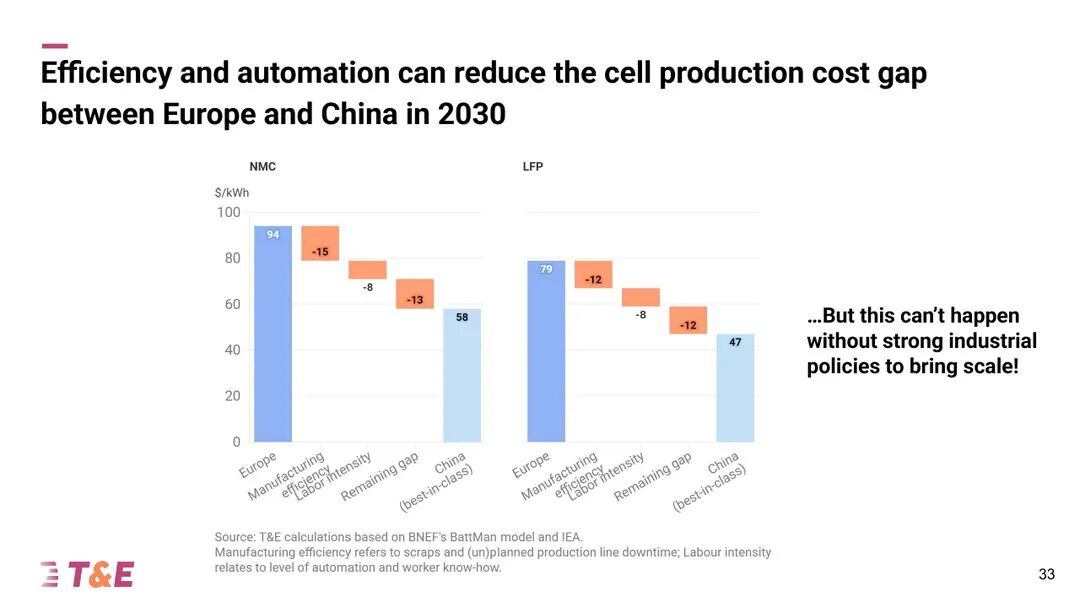
Page 33 of the report | How the European cell cost gap can be narrowed by 2030
Page 33 breaks the gap into three segments, in USD/kWh.
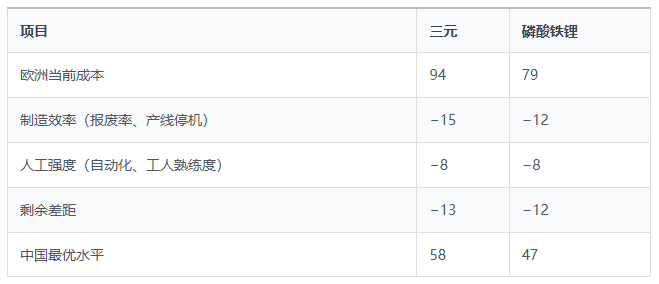
The first two items are what European factories can catch up on themselves, totaling 23 and 20 USD, accounting for more than 60% of the gap.
T&E did not elaborate on the remaining 12 to 13 USD.
Next to it was only one sentence: without strong industrial policy to bring scale, none of this will happen.
Looking at this chapter as a whole, T&E's logic is: vehicle tariffs have already been used, but batteries are still an open door.
08 The four prescriptions T&E offers
Conclusion · Policy recommendations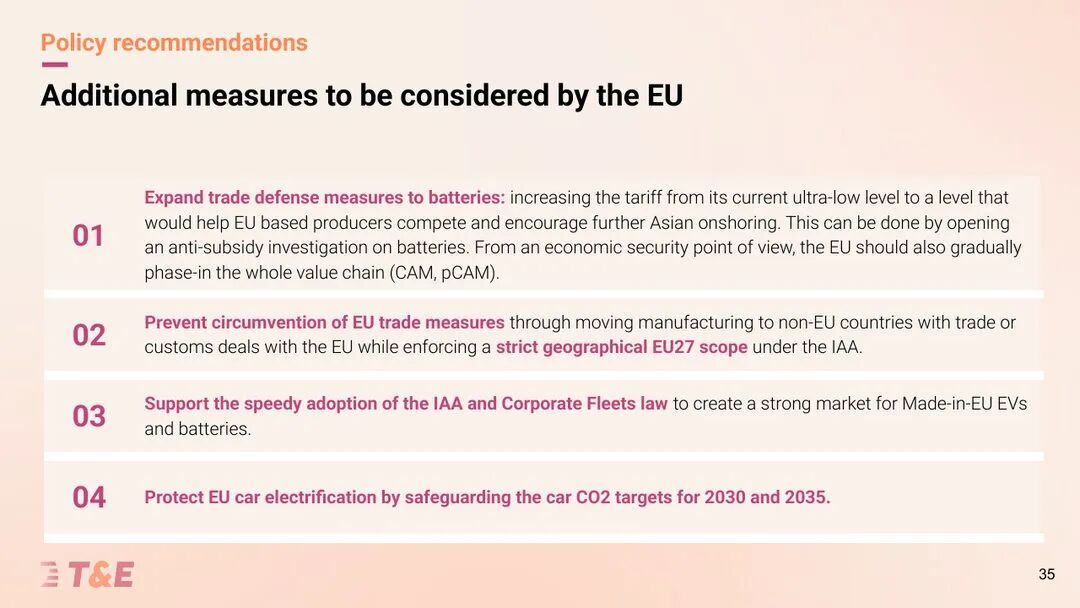
Page 35 of the report | Additional measures recommended for the EU to consider
The title of the conclusion page is: China's overcapacity requires the EU to come up with stronger regulation and trade defense.
The recommendations page lists four measures, which I transcribe according to their original meaning:
1. Extend trade defense measures to batteries. Initiate a countervailing investigation into batteries and raise tariffs from the current ultra-low level to a level that enables European local battery plants to compete and encourages Asian companies to continue building plants in Europe. Then gradually extend coverage to the entire value chain, including cathode active materials (CAM) and precursors (pCAM).
2. Prevent circumvention. Do not allow companies to relocate manufacturing to non-EU countries that have trade or customs agreements with the EU in order to evade these measures, and strictly enforce the EU-27 geographic scope under the Industrial Accelerator Act (IAA).
3. Pass the IAA and corporate fleet regulations as soon as possible to create a market for EU-made EVs and batteries.
4. Defend the 2030 and 2035 automotive carbon emission targets and safeguard the EU's automotive electrification.
The conclusion page has one more item than the recommendations page: under the IAA, establish strict foreign investment rules for Chinese automakers producing in Europe.
Item 2 is worth reading again. The conclusion page directly describes building plants in Turkey as "nearshoring."
In the earlier table, the two plants in Turkey and one plant in the UK are all outside the EU-27.
Literally, they could all fall under this item.
The wording on batteries is the strongest.
T&E wrote that the EU's countervailing investigation has confirmed that Chinese battery production receives substantial subsidies.
Its original words are: if action is not taken immediately, Europe's local battery industry may not survive.
09 Closing remarks
Solid data, clear stance — and the two should be read separately
After reading the 44 pages, my impression is: the data section of this report is very solid, and the conclusion section carries a clear stance.
T&E's main business is promoting transport electrification. It needs to persuade two groups at the same time.
To those who want to relax carbon emission targets, it says: relaxation will only benefit Chinese brands.
To those worried about Chinese cars, it says: what should be added are battery tariffs and localization rules.
Both arguments serve the same purpose: preserving the 2030 and 2035 targets.
Finally, there are three points the Chinese auto industry can learn from and remember:
1 Tax rates determine the curve: BYD at 17% went from about 13,000 vehicles to 76,000 vehicles in two years, while SAIC at 35.3% fell from 74,000 vehicles to 35,000 vehicles
2 Europe's next focus is batteries and circumvention: battery tariffs, the EU-27 scope, and foreign investment rules. Plant site selection must be calculated together with battery supply
3 The share of Chinese brands in Europe depends largely on how many BEVs European automakers themselves sell. The looseness or tightness of carbon emission targets is a bigger variable than tariffs
That is today's sharing. Feel free to leave a comment and share your views.
References and images: The presence of Chinese automakers in the EU car market pdf T&E Authors Lucien Mathieu, Ludovico Machet, contributor Los Miraux.
*Reproduction and excerpting without permission are strictly prohibited-
-
![]()
XPeng: Cash Generation from Vehicle Sales Picks Up — How Long Before the Chinese Tesla's AI Dream Comes True?
-
![]()
Is Chery Eyeing a British Brand Acquisition? Could Jaguar Land Rover Be the Target?
-
![]()
Dealerships' Plea: Survive, Make a Profit, Live with Dignity
-
![]()
GAC Group Sells 143,687 Vehicles in October: How Should Aion and the Joint Ventures Redistribute Roles?
-
![]()
2.5x More Light Intake: Why Mobile Phone Cameras Need to Retire the 1974 Filter
-
![]()
What Chinese Automakers Look Like in the Eyes of European Policy Circles
-
![]()
Huawei Doesn't Build Robots, Yet 80% of Robot Companies Run on Its Cloud
-
![]()
Breaking! Changan Automobile Sells 10% Avatr Stake for 3.2 Billion Yuan—What's the Real Reason?