Tesla: Rare Cash Influx from Car Manufacturing, AI Ambitions Delayed Again
 04/24 2026
 474
474
Tesla (TSLA.O) released its Q1 2026 earnings report after the U.S. market closed on the morning of April 22nd (Beijing Time). Despite widespread pessimism, the automotive segment delivered a notable earnings beat. Key highlights include:
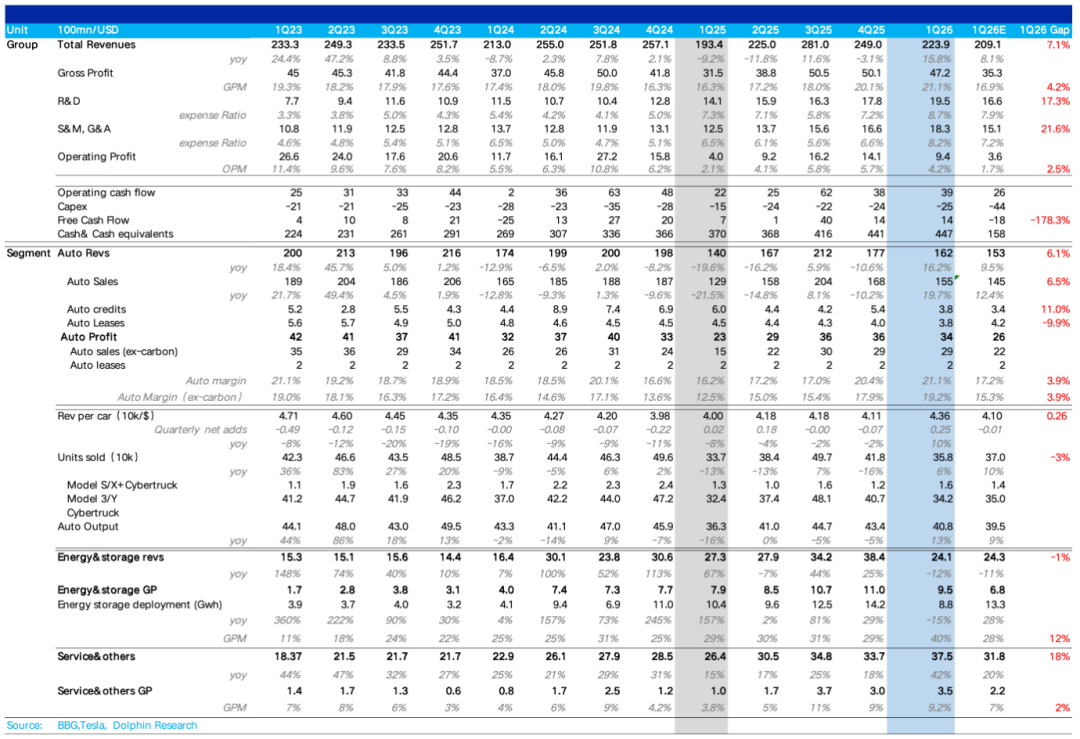
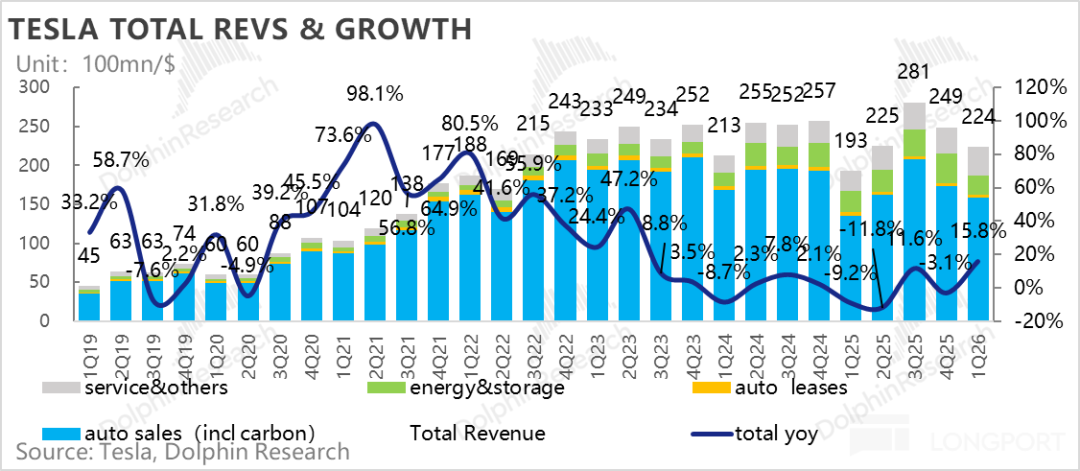
① Strong Total Revenue Performance: This quarter, total revenue reached $22.4 billion, up 16% YoY, significantly exceeding market expectations of $20.7-20.9 billion.
While this included a positive foreign exchange impact of approximately $900 million, even after adjusting for this factor, revenue of $21.5 billion remained above expectations. This was primarily due to a rebound in average selling prices (ASP) for vehicles, which effectively offset a short-term decline in energy storage revenue (at $2.41 billion, down 12% YoY) caused by front-loaded demand in the previous period.
② Automotive Revenue Also Surpassed Expectations: Total automotive revenue for the quarter was $16.2 billion, exceeding market expectations of $15.3 billion. Core automotive sales revenue (excluding regulatory credits and leasing) reached $15.5 billion, surpassing the expected $14.5 billion and serving as the primary driver of the beat.
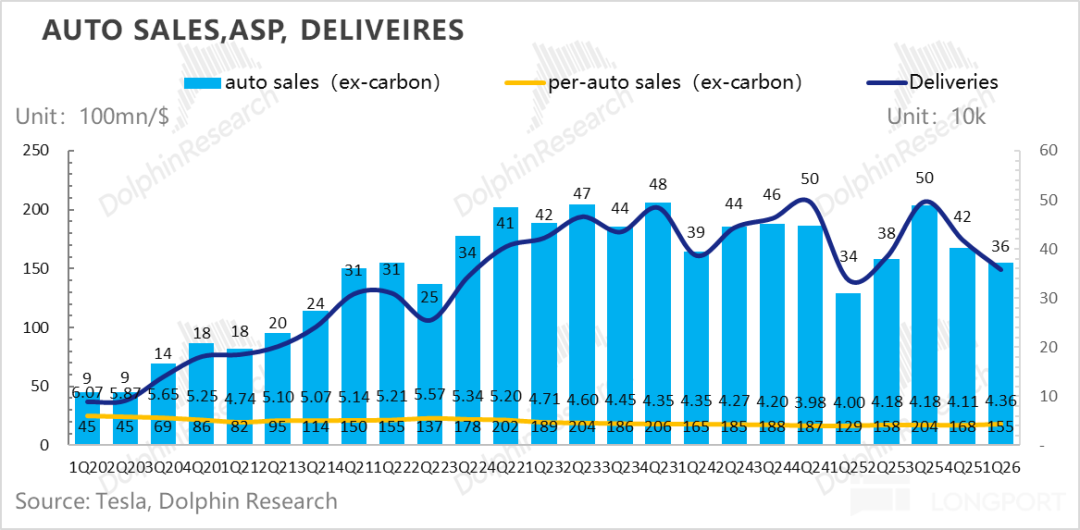
Despite Q1 being impacted by policy rollbacks in the Chinese and U.S. markets, leading to lower-than-expected deliveries (358,000 units) and a sequential decline, the ASP rebounded sharply by $2,500 QoQ to $43,600. This was due to an improved product mix (higher share of premium Model S/X and Cybertruck models at 5%), reduced promotional discounts in markets like the U.S., and record-high new FSD subscriptions following its full transition to a subscription model, which confirmed high-margin software revenue.
③ Core Automotive Gross Margin (Excluding Regulatory Credits) Showed Resilience: Overall automotive gross margin for the quarter hit 21.1%, significantly exceeding market expectations of 16.9%. After excluding one-time factors such as warranty reserve reversals ($230 million) and tariff-related exchange gains ($200 million), the core automotive gross margin (excluding regulatory credits) stood at approximately 17.5%.
Despite dual pressures from higher per-unit depreciation costs due to lower production volumes (up $500 QoQ) and rising raw material prices (up $1,000 QoQ), the core gross margin dipped slightly by 0.4 percentage points QoQ from 17.9%. However, benefiting from the ASP rebound, the final 17.5% performance significantly outperformed market expectations of 14.7%-15.3%.
④ Heavy R&D and Capex Investments Continue to Fund AI Ambitions: Tesla's R&D expenses reached $1.95 billion this quarter, continuing to rise sequentially, with major investments in FSD training iterations, AI5 chip design, and new product lines such as Cybercab and Optimus.
While both selling expenses and R&D expenses increased sequentially, the strong revenue and gross margin performance, coupled with no surge in capital expenditures this quarter, resulted in free cash flow of $1.4 billion for Q1, marking a net inflow and far exceeding market expectations of a net outflow.
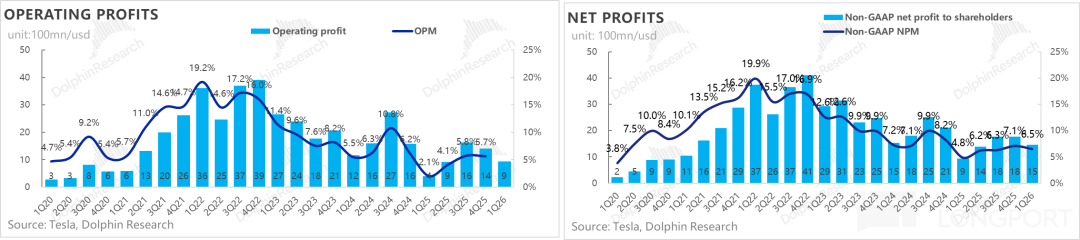
⑤ Operating Profit Exceeded Expectations: Finally, despite higher R&D expenses due to AI investments and increased SG&A expenses ($1.83 billion) driven by SBC costs (primarily CEO performance awards), operating profit reached $940 million this quarter, significantly surpassing market expectations of $360 million. The operating profit margin stood at 8.2%, improving by 1.6 percentage points QoQ despite headwinds.
Dolphin Research's Overall View:
In summary, Tesla delivered a Q1 2026 report that appeared strong and demonstrated underlying resilience. While the comprehensive beat in core revenue, gross margin, and net profit was partly influenced by one-time financial factors, stripping away these distortions reveals that the automotive segment still outperformed expectations amid widespread pessimism.
Specifically, the sequential rebound in ASP ended consecutive declines, and the stabilization of core automotive gross margins dispelled market fears that weak deliveries would collapse profitability.
More notably, despite unwavering investments in cutting-edge AI fields (self-designed chips, Optimus, FSD) and elevated overall R&D and selling expenses due to SBC costs, Tesla still generated $1.4 billion in positive free cash flow this quarter, far exceeding market expectations of a net outflow. This indicates that the automotive segment continued to serve as a stable "anchor" for Tesla in Q1.
However, the automotive business's weight in Tesla's valuation narrative is diminishing, with its role now reduced to a "cash cow." The market's true anxieties lie elsewhere: Will the timeline for realizing grand AI ambitions be repeatedly pushed back? Can the financial model remain sustainable under massive capital expenditures?
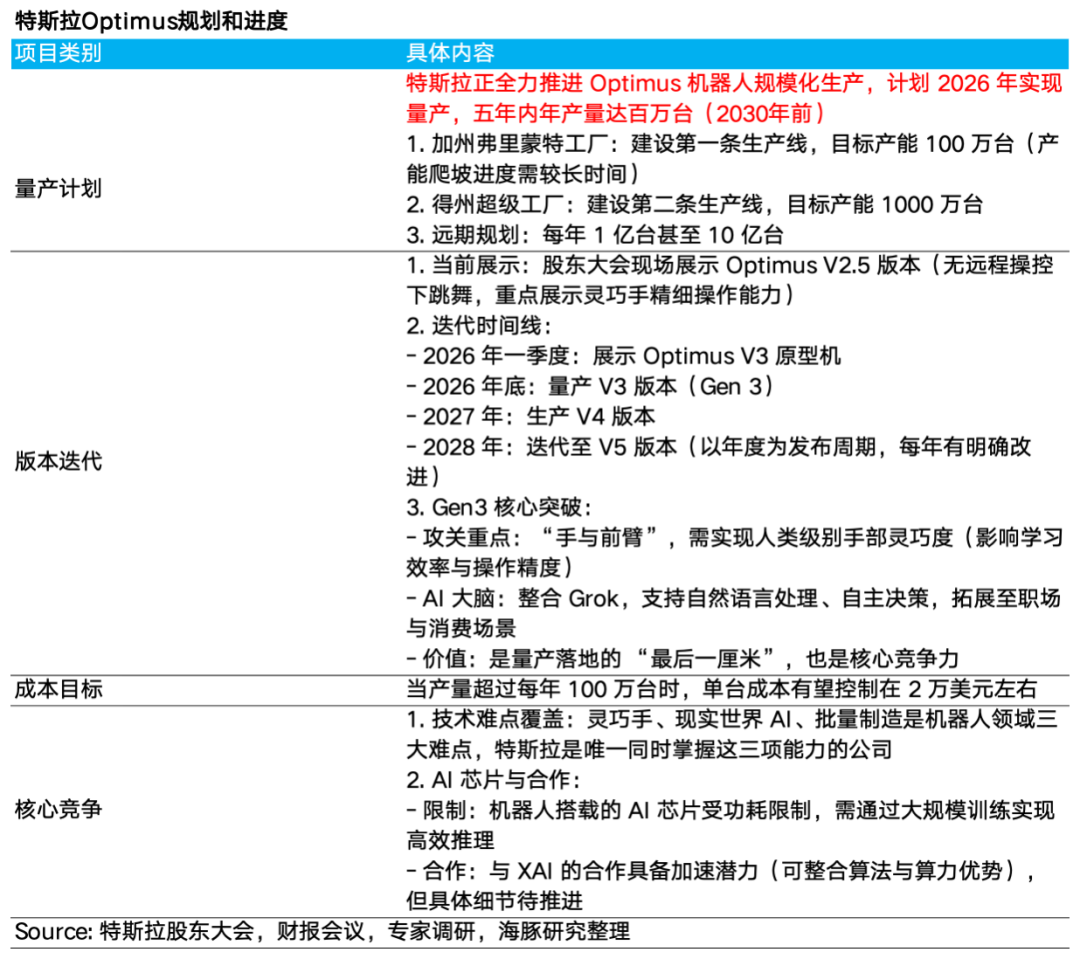
① Optimus: V3 Launch Delayed to Mid-Year, 2027 Marks Start of Mass Production
a. V3 Launch Postponed with Strict Confidentiality: Musk stated that the V3 version's system design is nearly ready, with aesthetic details currently being refined. A reveal is planned for mid-year (Middle of this year). The delay aims to prevent competitors from frame-by-frame analysis and technology theft, favoring a public unveiling closer to mass production.
b. Initial Production Timeline and Ramp-Up: The Fremont factory is preparing to start production. Management expects production to begin in late July or August.
As this is a brand-new product with over 10,000 unique components and a new supply chain, initial production speeds will be very slow. Capacity is expected to reach significant levels only next year.
c. Deep Production Line Reconfiguration: To accommodate Optimus production, Tesla is dismantling the Model S/X production line (final production scheduled for early May). Removing the old line and installing/testing a new Optimus line will take approximately four months, described as a challenging but remarkably fast engineering feat.
d. Tesla is building a second Optimus factory at Giga Texas, expected to start production next summer. In terms of applications, Optimus will initially perform simple tasks within factories before potentially expanding outside Tesla next year. The newly taped-out AI5 chip will also be equipped on Optimus.
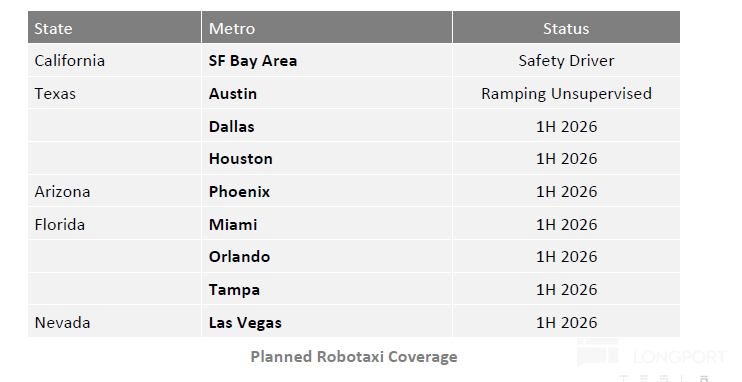
② Robotaxi: Safety-First Approach Leads to Controlled Expansion, Financial Contributions Delayed to 2027
a. Steady Regional Expansion: Robotaxi has expanded to Dallas and Houston, targeting unsupervised operations in over a dozen states by year-end.
b. Prolonged Validation Cycles: Constrained by stringent safety baselines, the company is accelerating testing by expanding its QA (Quality Assurance) fleet. Musk explicitly stated that neither Robotaxi nor unsupervised FSD will make significant contributions to financial statements in 2026, with the financial inflection point pegged to 2027.
c. Bottlenecks in Underlying Architecture: The current test fleet still operates on the v14.3 variant. Management deems large-scale Robotaxi deployment unreasonable until the V15 refactor version, which significantly raises safety ceilings, is released.
③ FSD: Unsupervised Functionality to Roll Out to Customer Fleets Starting Q4 2026
a. Unsupervised FSD Rollout Plan: Unsupervised functionality is expected to begin rolling out to customer fleets in Q4 2026. The rollout will proceed geographically, contingent on confirming absolute safety in specific regions (without complex intersections or severe road/weather conditions).
b. Musk confirmed that Hardware 3 (HW3) has only one-eighth the memory bandwidth of HW4 and cannot support unsupervised FSD. Tesla will offer replacement discounts for HW3 owners who purchased FSD or provide upgrades to replace the computing platform and cameras.
To efficiently complete these upgrades, Tesla plans to establish "micro-factories" in major cities. Meanwhile, for HW3 owners, Tesla plans to roll out a streamlined digital version based on v14 by late June.
c. Evolution of Underlying Architecture V15: The current v14.3 is considered the final piece of the current architecture. V15, expected by year-end or early next year, will overhaul the software architecture to run entirely on AI, aiming to elevate safety far beyond human levels.
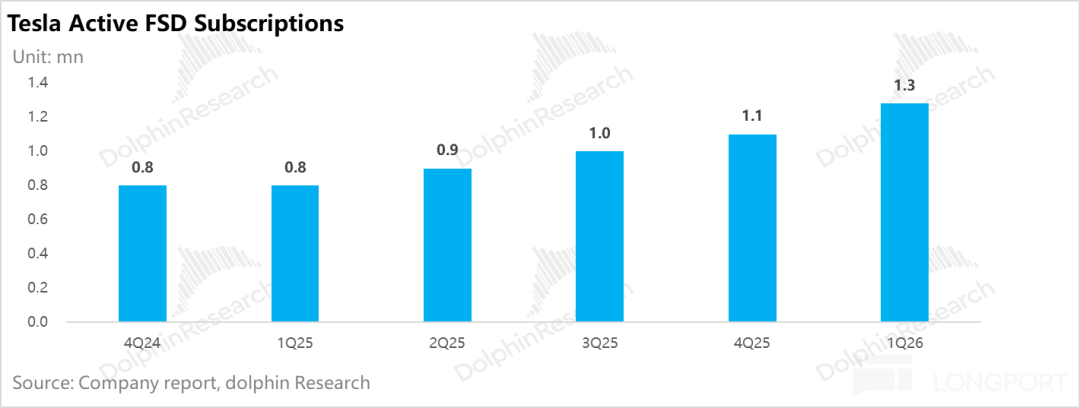
d. FSD Subscriptions: FSD now has nearly 1.3 million global paying customers. Since February 15, 2026, Tesla has eliminated one-time FSD purchase options worldwide, fully transitioning to a monthly subscription model (currently priced at $99/month). This policy drove subscription users to become the primary growth driver.
The ratio of new FSD users to new vehicle sales rose from 24% last quarter to 50% this quarter, with FSD paying users accounting for approximately 14% of Tesla's global installed fleet. As high-margin software revenue, it also contributed to the sequential rebound in ASP and the better-than-expected core automotive gross margin.
e. Overseas Expansion: In Europe, approval has been granted in the Netherlands, with submission to Brussels for EU review expected in May, aiming for broader approval in Q2. In China, partial approvals have been obtained, and collaboration with regulators is ongoing to secure broader approvals in Q3. With these advances, the company's sales strategy has evolved to emphasize FSD as the core product, with vehicles serving merely as delivery vehicles.
Overall, while Tesla's automotive performance in this earnings report was respectable, and expectations for main business demand are reviving amid rising oil prices and stimulus for entry-level Model 3/Y variants, helping stabilize the company's fundamentals, the most valuation-sensitive AI segment faces delays: Optimus V3's launch postponement, Robotaxi's commercial contribution pushed to 2027, and the need to await FSD V15 to overcome technical hurdles undoubtedly prolong the market's expected timeline for realization.
A more severe test lies in funding: Tesla raised its 2026 capital expenditure guidance from "over $20 billion" to "over $25 billion," fully initiating construction of six new factories (including lithium refining, Cybercab, and Optimus plants) and AI computing clusters (Cortex training clusters, Terrafab).
While Tesla holds over $44 billion in cash and investments on its balance sheet, under an annual "burn rate" of $25 billion, its reliance on operating cash flow from the automotive segment has surged—the AI ambitions must swiftly achieve commercial viability and self-sufficiency, or the company may face realistic financing pressures within the next one to two years.
Dolphin Research believes that delays in AI progress, compounded by pressure from massive capital expenditures, may create short-term volatility for Tesla's stock price. However, from a long-term perspective, Tesla's AI narrative is genuinely transitioning from "conceptual PPTs" to the "eve of profit realization," with immense long-term potential still intact.
Below is a detailed analysis of the earnings content
1. Tesla: A Report That Appears Strong and Demonstrates Underlying Resilience
1.1 Automotive Segment Rarely "Exceeds Expectations," with ASP Finally Rebounding Sequentially
Total revenue for the quarter was $22.4 billion, up 16% YoY, significantly surpassing market expectations of $20.7-20.9 billion. While total revenue included a positive foreign exchange impact of approximately $900 million, even after adjusting for this one-time factor, revenue of $21.5 billion remained above expectations.
The primary drivers of the beat were: ① A sequential rebound in automotive ASP after multiple quarters of decline; ② Growth in service and other business revenue.
Details:
① Automotive Business: Core Vehicle Sales Revenue as the Largest Source of the Beat
Total automotive revenue for the quarter was $16.2 billion, up 16% YoY, exceeding market expectations of $15.3 billion, including:
- Regulatory credit revenue of $380 million in gross profit, down $160 million sequentially, as expected, primarily due to prior adjustments in carbon emission regulations.
However, core automotive sales revenue (excluding regulatory credits and leasing income) was $15.5 billion, surpassing market expectations of $14.5 billion and serving as the core driver of the beat. This was mainly due to a sequential rebound in ASP by $2,500 to $43,600, ending the previous consecutive declines.
Even under extreme assumptions—attributing all $900 million in exchange gains to automotive sales—adjusted per-unit revenue would remain flat QoQ (approximately $41,100). In reality, exchange gains are allocated across businesses, so the true per-unit revenue rebound would be higher after excluding exchange impacts.
Dolphin Research believes the ASP rebound may stem from: a) An improved product mix with a higher share of premium models (e.g., Model S/X and Cybertruck); b) Reduced promotional discounts; c) Increased deferred revenue recognition from FSD full self-driving software (with record-high new FSD subscriptions this quarter).
② Energy Business: Short-Term Pressures from Demand Front-Loading and Recognition Cycles, But Long-Term Certainty Remains High
Energy revenue for the quarter was $2.41 billion (down 12% YoY), with energy storage shipments declining to 8.8 GWh (down 15% YoY, 38% QoQ). The Periodic pressure (temporary pressure) stemmed from:
a. Demand Front-Loading Effect: To avoid higher 2026 tariffs and meet IRA bill (Inflation Reduction Act) local supply chain subsidy thresholds, significant energy storage projects were front-loaded in the previous period, leading to short-term demand exhaustion this quarter.
b. Fluctuations in project-based revenue recognition: Energy storage projects (especially large-scale Megapacks) involve lengthy cycles for sales, production, transportation, and installation, which can easily lead to quarterly fluctuations in revenue recognition.
v. Disruptions from low-price competition: The U.S. domestic market faces low-price competition from Chinese manufacturers with cost advantages. However, as the IRA Act progressively tightens localization requirements each year, Tesla's moat as a domestic giant is further solidifying.
With the explosion in demand for green power to support highly volatile AI workloads from AI Data Centers (AIDC), along with the rigid peak-shaving demand driven by new energy installations (photovoltaic + wind power) on the U.S. energy supply side, the energy storage sector exhibits extremely high certainty. Tesla is currently doubling down on “ground-mounted photovoltaic + energy storage” and space-based solar power combination solutions, precisely positioning itself to supply electricity to both power grids and AI computing.
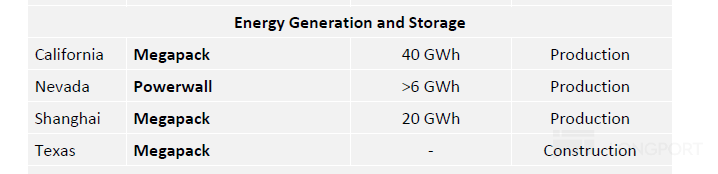
At the same time, production capacity is poised for takeoff. The Houston plant will manufacture next-generation Megapack 3 and Megablock products, driving progress toward a total annual capacity target of 66 GWh (existing capacity of 60 GWh, including 40 GWh in California, 20 GWh in Shanghai, and 6 GWh of Powerwalls), sufficient to support soaring demand and drive volume growth in shipments.
③ Service business performed well
Revenue for the quarter reached $3.75 billion, up 42% year-over-year, surpassing market expectations of $3.18 billion. In addition to the previously mentioned foreign exchange gains, the increase was primarily driven by:
a. Tesla's continued investment in and expansion of its Supercharger network. As of Q1-2026, the number of global Supercharger stations reached 8,463, a 19% year-over-year increase.
b. Natural growth in aftermarket parts sales and service center operations as the global vehicle fleet continues to expand, generating stable revenue.
c. Expansion of the company’s robotaxi fleet, which also contributed additional revenue.
c. The company continued to roll out its insurance products in more states (such as Florida). In some states, using FSD (Supervised) can help customers obtain premium discounts or even fully offset the monthly subscription cost of FSD, enhancing the synergy between FSD and insurance products and potentially driving growth in service revenue.
1.2 Automotive gross margin: Core profitability exceeded expectations, but one-time factors need to be excluded
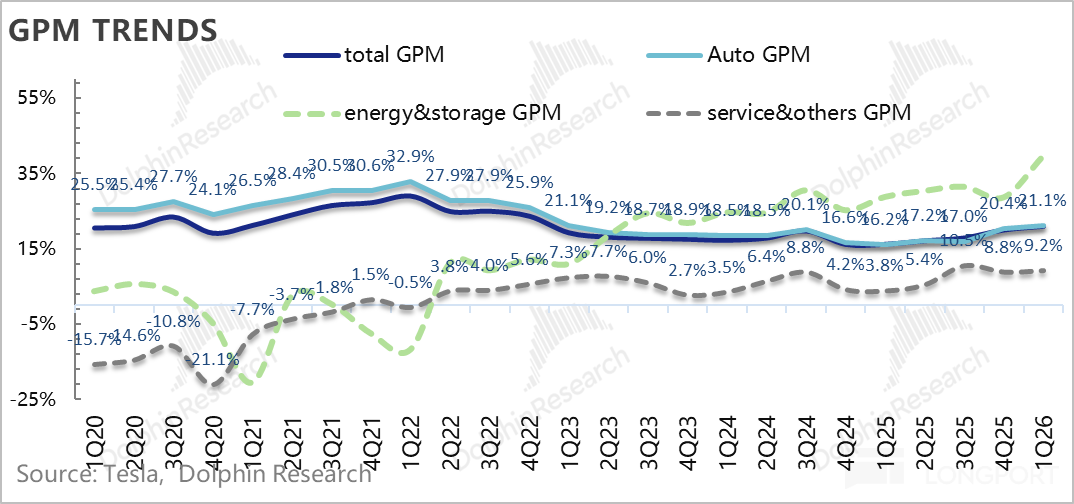
The Q4 gross margin was 21.1%, significantly higher than market expectations of 16.9%, primarily due to better-than-expected margins in vehicle sales and energy storage. However, after removing one-time effects, the actual gross margin for the quarter was 18.7%, down 1.4 percentage points from the previous quarter's high of 20.1%, but still above market expectations.
In quarterly financial reports, automotive gross margin often provides more insight than revenue alone. This quarter, Tesla’s overall automotive gross margin reached 21.1%, up a further 0.7 percentage points from the previous quarter's high of 20.4%. Notably, this improvement was achieved despite a decline in the contribution from regulatory credit revenue, which is purely profit-based.
However, this quarter's profits included two significant one-time positive impacts: a. Warranty reserve reversal: Approximately $230 million in warranty reserves were reversed; b. Foreign exchange gains: Approximately $200 million in tariff-related foreign exchange gains (fully recognized in the automotive business under extreme assumptions).
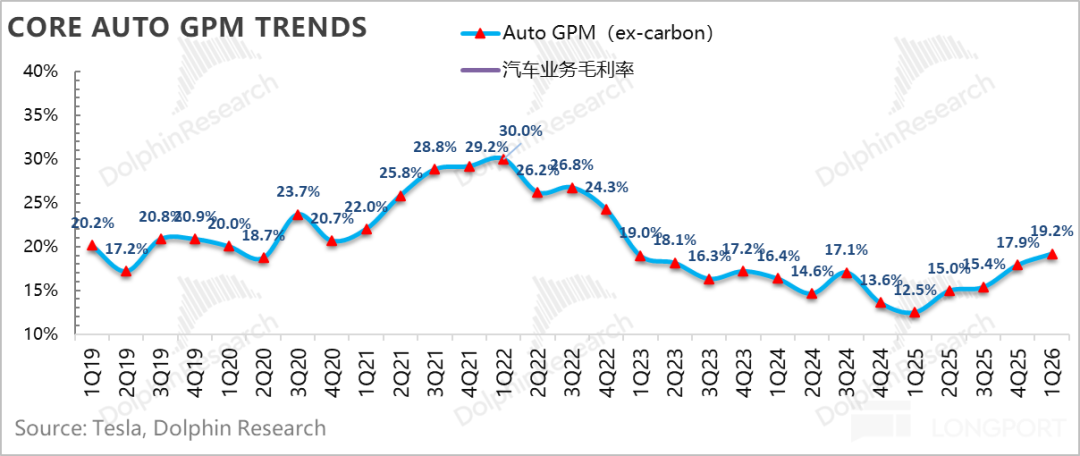
After excluding the aforementioned one-time factors, the actual core automotive gross margin for the quarter was approximately 17.5%. Although this was slightly down from the previous quarter's 17.9%, it was still significantly higher than market expectations. Dolphin Research believes this was primarily driven by a sequential rebound in average selling prices (ASPs) and increased recognition of high-margin FSD revenue, offsetting the rise in per-unit amortized costs due to lower sales volumes and the adverse impact of rising upstream raw material costs.
Among other businesses, the energy storage gross margin reached 40%, a significant sequential increase of 11 percentage points, far exceeding market expectations of 28%. However, this included approximately $250 million in tariff subsidy benefits. After excluding this one-time effect, the energy storage gross margin was approximately 29.2%, roughly in line with the previous quarter.
Despite strong demand for energy storage, the business is expected to face margin pressure in the future due to continued negative tariff impacts (as most battery cells are still procured from China) and intensifying industry competition.
Services and other businesses: The gross margin for the quarter was 9.2%, up 0.4 percentage points sequentially. Growth was primarily driven by improved utilization and margins in the Supercharger network, as well as the early expansion of the Robotaxi business.
II. Real vehicle sales business exceeded low market expectations
As the most critical metric each quarter, automotive gross margin is more important than ever, especially given the aging of Tesla's current models and intensifying competition. To clarify the true picture of automotive gross margin, Dolphin Research has broken it down into automotive sales gross margin (excluding regulatory credits), automotive leasing gross margin, and overall automotive business gross margin.
Q1 automotive sales gross margin (excluding regulatory credits and leasing) was 19.2%, significantly exceeding market expectations of 15.3% and up 1.3 percentage points sequentially. However, as mentioned earlier, this quarter was affected by two one-time factors ($230 million in warranty reserve reversals and $200 million in tariff-related foreign exchange gains). After adjusting for these, the actual core automotive gross margin was approximately 17.5%, still above market expectations of 14.7%-15.3%, with the rebound in per-unit ASP being the primary driver.
Breaking down the per-unit economics:
2.1 Vehicle ASP finally rebounded
From a per-unit pricing perspective, Tesla's revenue per vehicle sold (excluding regulatory credits and automotive leasing sales) in Q1 was $43,600, up a significant $2,500 sequentially and higher than market expectations of $41,000.
However, $900 million in foreign exchange gains were recognized in revenue this quarter. Even under extreme assumptions—where all $900 million in foreign exchange gains are attributed to automotive sales—the adjusted revenue per vehicle would still be flat sequentially (approximately $41,100, likely higher in reality), primarily due to product mix optimization, the rollback of U.S. promotional discounts, and the positive contribution from FSD revenue.
Details:
① Q1 U.S. subsidies declined, while Chinese subsidies increased
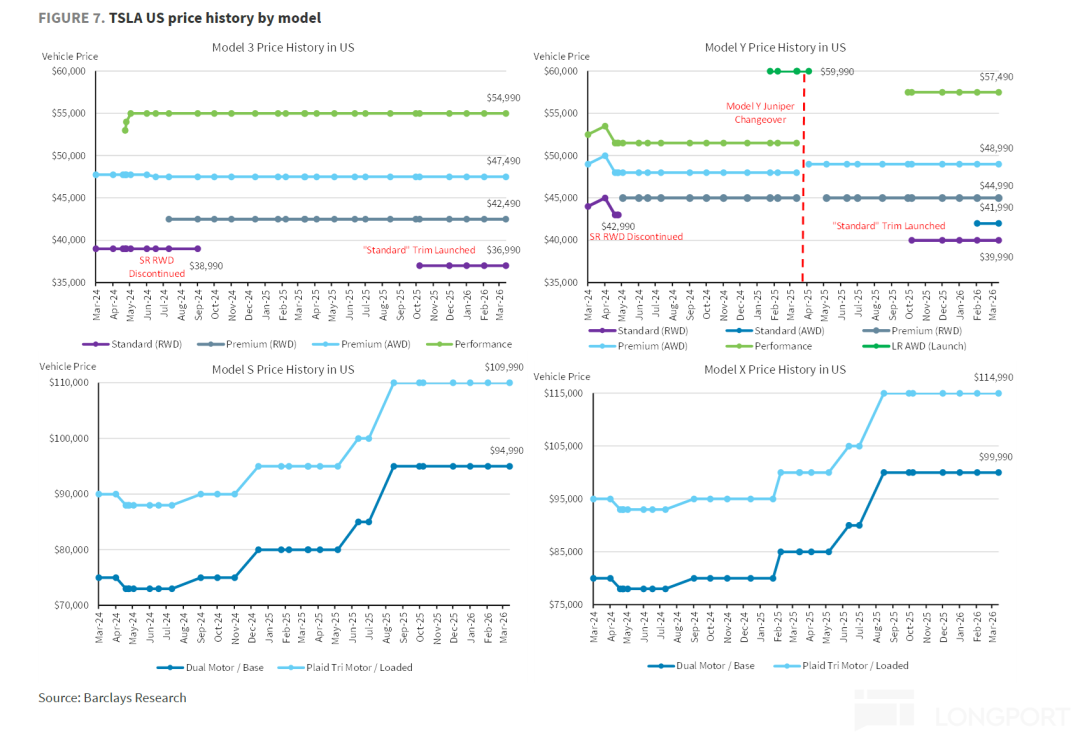
a. U.S.: Pricing unchanged, but subsidy support declined
Although the official MSRP for the Model 3/Y remained stable (a more price-competitive base version was pre-launched in Q4 2025 to hedge against subsidy reductions), the company significantly rolled back promotional discounts from Q4 2025. For example, the highly attractive “0% down payment leasing program” introduced in Q4 2025 was discontinued in Q1 2026, and leasing rates rose sharply sequentially.
Despite the higher effective purchase cost, Tesla's market share was not severely impacted during the rollback of promotions, thanks to a less competitive overall U.S. EV market—traditional automakers generally reduced discounts in Q1 2026 after aggressive Q4 2025 inventory clearance.
However, directly affected by the IRA subsidy reductions, overall U.S. demand for new energy vehicles came under pressure in Q1, and industry growth slowed. As a result, Tesla's absolute delivery volumes in the U.S. declined both year-over-year and sequentially.
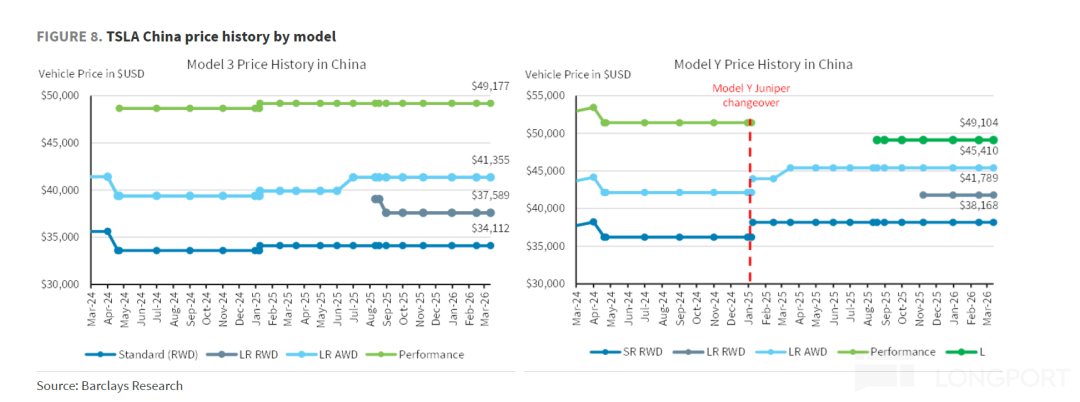
b. China: Subsidy support increased sequentially, offsetting the impact of reduced new energy vehicle purchase tax incentives
The sequential increase in subsidies in China was largely to offset the impact of rising vehicle costs following the reduction of new energy vehicle purchase subsidies. Tesla introduced a new 7-year ultra-low-interest loan program for the Model 3/Y for nearly the entire quarter, continued the 5-year 0% interest financing scheme launched in Q4 2025, and offered additional subsidies such as paint discounts and inventory vehicle discounts.
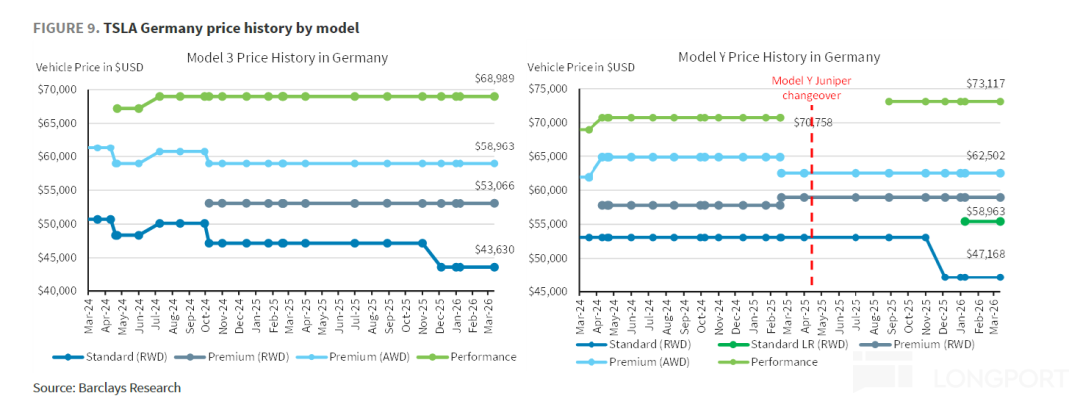
c. Europe: Promotional discounts continued
In Q1, Tesla maintained the price reductions for the standard versions of the Model 3/Y in Europe that were implemented in Q4 2025 and offered 0% interest loans for up to 5 years in some markets. Given Europe's current high-interest-rate environment, the interest-free policy effectively reduced purchase costs for consumers.
② Vehicle mix: Higher-priced Model S/X + Cybertruck accounted for a larger share
From a vehicle mix perspective, the share of Tesla's higher-priced Model S/X + Cybertruck in Q1 increased by 2 percentage points sequentially to 5% (from 3% in Q4). Additionally, the company continued to introduce relatively higher-priced long-range rear-wheel-drive versions as more entry-level options in global markets, improving the vehicle mix.
③ FSD business: New paid subscribers reached a record high this quarter
In Q1, the number of global paid FSD users approached 1.28 million (a net increase of 180,000 sequentially), up 49% year-over-year, setting a new record for quarterly net new users.
Starting February 15, 2026, Tesla globally eliminated the one-time purchase option for FSD and fully transitioned to a monthly subscription model (currently priced at $99/month). This move drove subscription users to become the absolute main driver of growth.
The ratio of new FSD users to new vehicle sales increased from 24% in Q4 to 50% in Q1, with FSD paid users accounting for approximately 14% of Tesla's global installed fleet. As high-margin software revenue, FSD also contributed to the sequential rebound in average vehicle ASPs and the better-than-expected core automotive gross margin.
2.3 Per-unit costs continued to rise
After discussing per-unit pricing, let’s examine per-unit costs. Typically, Tesla achieves cost reductions through four dimensions: 1) economies of scale from higher sales volumes and full capacity utilization; 2) technological cost reductions; 3) natural cost reductions in battery raw materials; and 4) government subsidies. Details are as follows:
Dolphin Research breaks down per-unit costs into depreciation and variable costs. Here’s the per-unit economic breakdown for Q1:
1) Depreciation per vehicle: Scale effects hindered, per-unit depreciation costs continued to rise sequentially
Per-unit depreciation in Q1 was $0.44, up $500 sequentially in absolute terms. The per-unit depreciation rate also rose by 0.6 percentage points sequentially to 10.2% (from 9.6% in Q4), primarily due to the sequential decline in production and sales volumes in Q1 (vehicle sales fell 14.4% sequentially to 358,000 units), hindering the release of scale effects.
2) Variable costs per vehicle: Variable costs also rose
The company's variable cost per vehicle in Q1 was $36,000, up $1,000 sequentially, primarily due to broad-based price increases in core automotive metals (steel, aluminum, copper) and storage costs, creating cost pressure.
However, starting November 2025, the U.S. expanded a 3.75% manufacturer's suggested retail price (MSRP) offset for domestically produced models, allowing Tesla to receive tariff rebates from the government, which is expected to continue benefiting the company in Q1 and partially offset the impact of rising raw material costs.
3) Automotive gross margin exceeded expectations
Ultimately, despite hindered scale effects and rising per-unit costs due to raw material price increases, the sequential rebound in per-unit vehicle ASPs drove the Q1 automotive gross margin (excluding one-time factors and regulatory credits) to 17.5%, still above market expectations of 14.7%-15.3%.
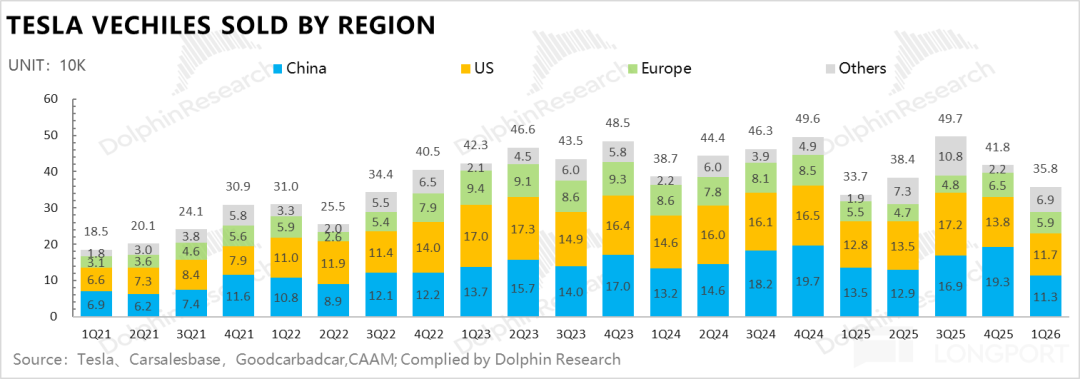
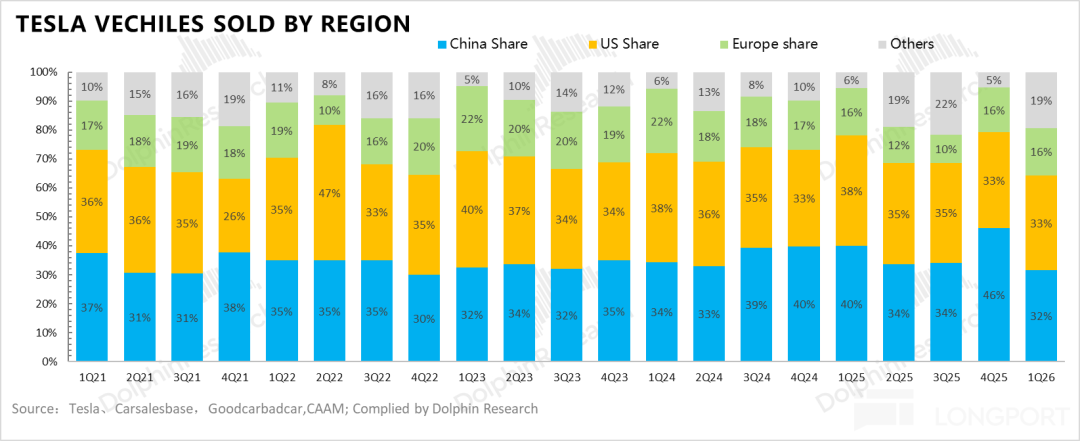
III. Q1 deliveries underperformed due to policy headwinds in the U.S. and Chinese markets
Tesla delivered 358,000 vehicles in Q1, below market expectations of 370,000 units, primarily due to the reduction of new energy vehicle purchase tax incentives in China and the $7,500 IRA subsidy reduction in the U.S., which weighed on sales in both markets.
In contrast, policy subsidies in Europe (where several countries, including Italy, Spain, and France, reinstated or introduced new EV subsidies starting Q4 2025) directly stimulated consumer demand, and Tesla's continued promotional discounts in Europe partially offset the pressure in the U.S. and Chinese markets.
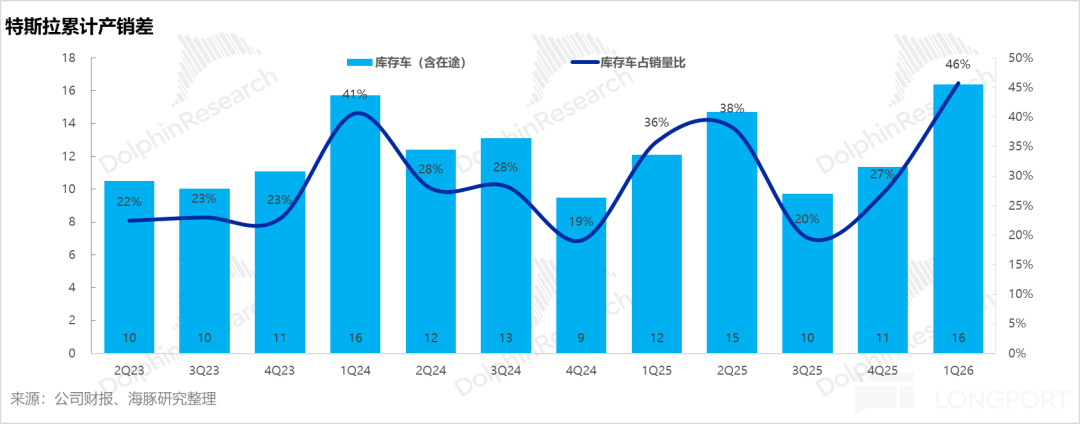
In terms of production and sales gaps, Tesla produced 408,000 vehicles in the first quarter, 50,000 more than its deliveries, leading to continued inventory buildup. Tesla's inventory turnover days increased from 15 days in the previous quarter to 27 days this quarter. However, despite the significant rise in inventory eroding cash flow, the operating cash flow for this quarter increased by RMB 120 million to RMB 3.9 billion compared to the previous quarter, thanks to an increase in deferred revenue and a decrease in accounts receivable.
IV. Expenditure Side: Continued Increased Investment in AI Business
Tesla's R&D expenses and selling costs continued to rise this quarter. R&D expenses reached RMB 1.95 billion, up by USD 160 million from the previous quarter, primarily due to increased investment in AI intelligence and new product R&D. The R&D expenses were mainly invested in the training and iteration of FSD, the design of the AI5 chip, and the R&D of new product lines such as Cybercab and Optimus.
Selling and administrative expenses reached RMB 1.83 billion this quarter, up by USD 180 million from the previous quarter and exceeding market expectations of RMB 1.51 billion. This increase was mainly due to an approximately USD 120 million rise in SBC expenses (primarily due to increased CEO performance incentives), leading to higher selling and administrative costs.
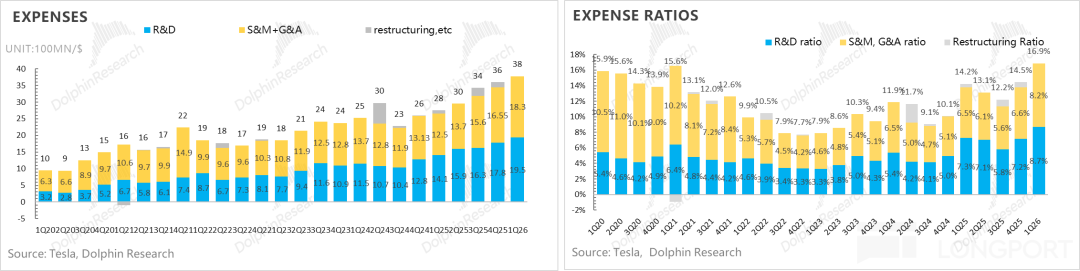
Finally, despite increased investments in the three expense categories, revenue and gross margin exceeded expectations across the board. Operating profit reached RMB 940 million, significantly higher than market expectations of RMB 360 million, with an operating profit margin of 8.2%, up by 1.6 percentage points from the previous quarter.
In terms of net profit, due to losses caused by Bitcoin fluctuations this quarter, net profit was only RMB 490 million, with the net profit margin declining by 1.3 percentage points to 2.1% from the previous quarter.
Regarding free cash flow, despite significant ongoing investments in AI-related areas (self-developed AI chips, Optimus, FSD R&D) and a quarter-over-quarter increase in SBC expenses, leading to rises in selling and R&D costs, Tesla's free cash flow for the first quarter was USD 1.4 billion, achieving a net inflow, far better than market expectations of a net outflow, driven by revenue and gross margin both exceeding expectations, coupled with no surge in capital expenditures this quarter.
The company has significantly raised its capital expenditure guidance for 2026 from the previous "over USD 20 billion" to "over USD 25 billion," primarily to support the construction of six new factories (including lithium refineries, Cybercab, Optimus, etc.) and AI computing infrastructure.
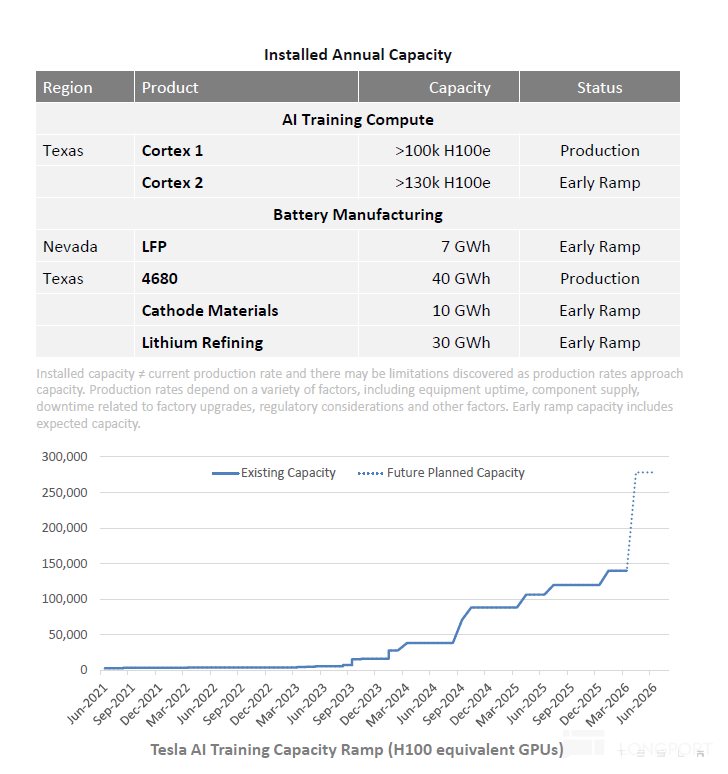
In terms of AI computing power construction, the Cortex 2 training cluster is now online and operating workloads. According to the company's plans, to support the training of Optimus and autonomous driving models, computing power investments will continue to increase significantly. According to Tesla's plans, the cortex training cluster is expected to reach a computing power level of over 250,000 equivalent H100s in the second quarter, doubling from nearly 150,000 in the first quarter.
Although cash and investments on hand remain abundant (over USD 44 billion), at the current capital expenditure intensity of over USD 25 billion per year, existing cash can only sustain high-intensity investments for less than two years. The ambitious long-term AI blueprint urgently needs to be translated into substantial revenue and cash flow; otherwise, the company will face potential financing pressures.
- END -
// Reprint Authorization
This article is an original piece by Dolphin Research. Reprinting requires authorization.
// Disclaimer and General Disclosure Notice
This report is for general comprehensive data purposes only, intended for general reading and data reference by users of Dolphin Research and its affiliated institutions. It does not consider the specific investment objectives, investment product preferences, risk tolerance, financial situation, or special needs of any person receiving this report. Investors must consult with independent professional advisors before making investment decisions based on this report. Any person making investment decisions using or referring to the content or information mentioned in this report bears their own risk. Dolphin Research shall not be liable for any direct or indirect responsibilities or losses that may arise from using the data contained in this report. The information and data in this report are based on publicly available materials and are for reference purposes only. Dolphin Research strives to ensure but does not guarantee the reliability, accuracy, and completeness of the relevant information and data.
The information or views mentioned in this report shall not, under any jurisdiction, be regarded or considered as an offer to sell securities or an invitation to buy or sell securities, nor shall they constitute recommendations, inquiries, or endorsements of relevant securities or related financial instruments. The information, tools, and materials in this report are not intended for or proposed to be distributed to jurisdictions where distribution, publication, provision, or use of such information, tools, and materials conflicts with applicable laws or regulations, or to citizens or residents of jurisdictions where Dolphin Research and/or its subsidiaries or affiliated companies are required to comply with any registration or licensing requirements in that jurisdiction.
This report only reflects the personal views, insights, and analytical methods of the relevant creators and does not represent the stance of Dolphin Research and/or its affiliated institutions.
This report is produced by Dolphin Research, and the copyright is solely owned by Dolphin Research. Without the prior written consent of Dolphin Research, no institution or individual shall (i) make, copy, reproduce, duplicate, forward, or create any form of copies or replicas in any way, and/or (ii) directly or indirectly redistribute or transfer to other unauthorized persons. Dolphin Research reserves all related rights.
-
![]()
Apple’s New CEO: The Perfect Blend of ‘Jobs + Cook’
-
![]()
Behind Oracle's Global Layoff of 30,000: AI Bubble or AI Replacement?
-
![]()
No One Wants to Miss Out on DeepSeek
-
![]()
Menglong PLUS 7-Seater Edition Makes Debut at 2026 Beijing Auto Show, Starting at 193,800 Yuan. Full Hi4 Electric 4WD System Redefines Family Travel Standards
-
![]()
A Premier Optical Module Company’s Dual Odyssey: Seeking Fortune Abroad, Crafting a Legend at Home
-
![]()
Farewell to Price Wars: Large AI Models Usher in the Inflation Era
-
![]()
Alternative Deduction of the AI Bubble Theory: Sustainability of High Valuations from the Perspective of Capital Allocation Trends
-
![]()
From iQIYI to AI Qiyi: A 'Cost-Saving Marvel' or a 'Crisis of Trust'?