"AI" Google: No Ghost Stories, Just a Bumper Harvest
 04/30 2026
 429
429
Google's Q1 results were once again explosive, with 40% of revenue growth coming from AI-related cloud income. Perhaps it's time to remove Google's advertising label and replace it with an AI company badge.
Key takeaways:
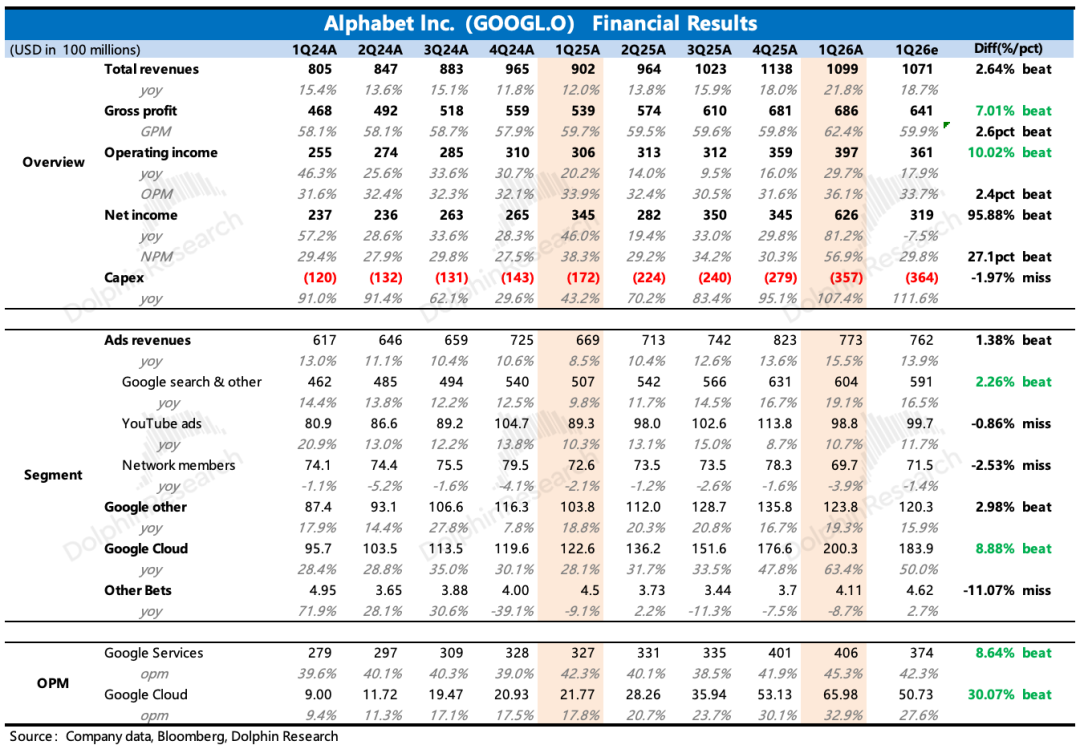
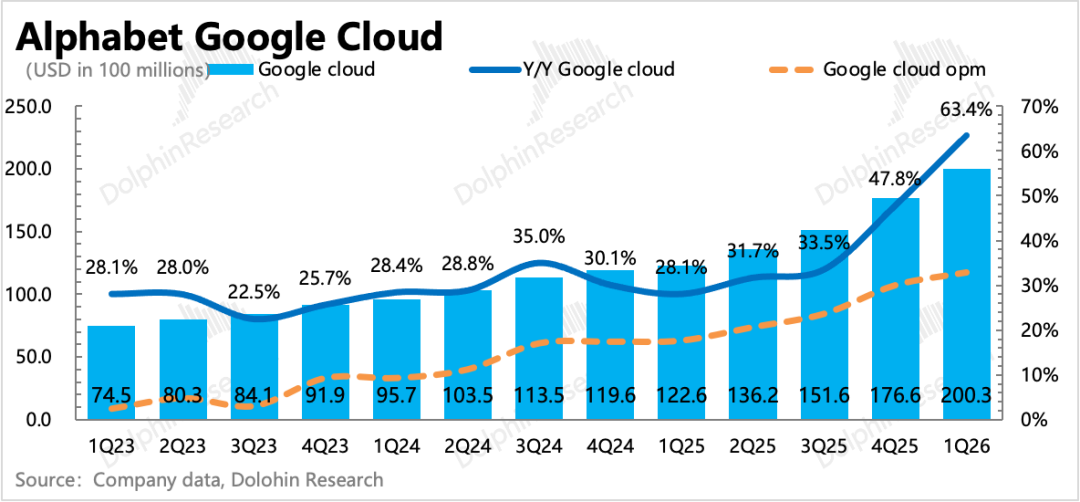
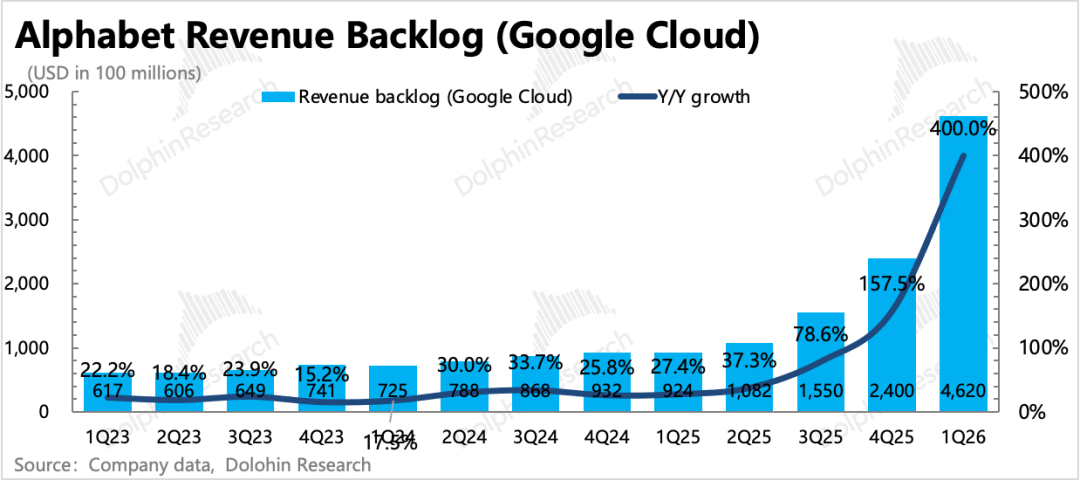
1. Explosive cloud business solidifies valuation confidence: With $20 billion in revenue and 63% growth, the performance was a pleasant surprise even from a more optimistic buyer's perspective (+60%), far outperforming peers. Critically, the current backlog stands at $462 billion, nearly doubling from $240 billion at the end of last year. The majority consists of cloud contracts, with a smaller portion from direct TPU hardware sales (for customer-built data centers).
Of the $220 billion net increase, Anthropic and Meta are likely the main contributors, but there are also numerous newly signed billion-dollar deals among other clients, as well as additional new demands from existing customers.
The substantial backlog, combined with the recently released eighth-generation TPU, brings more comprehensive AI infrastructure solutions, ensuring high revenue growth for at least 1-2 years (half of the orders will be recognized as revenue within two years).
The company also highlighted that Gemini Enterprise, launched in Q4 last year, showed strong momentum in Q1, with monthly active paying users increasing by 40% sequentially, and Token processing volume via direct client API calls surging from 10 billion at the end of last year to 16 billion per minute.
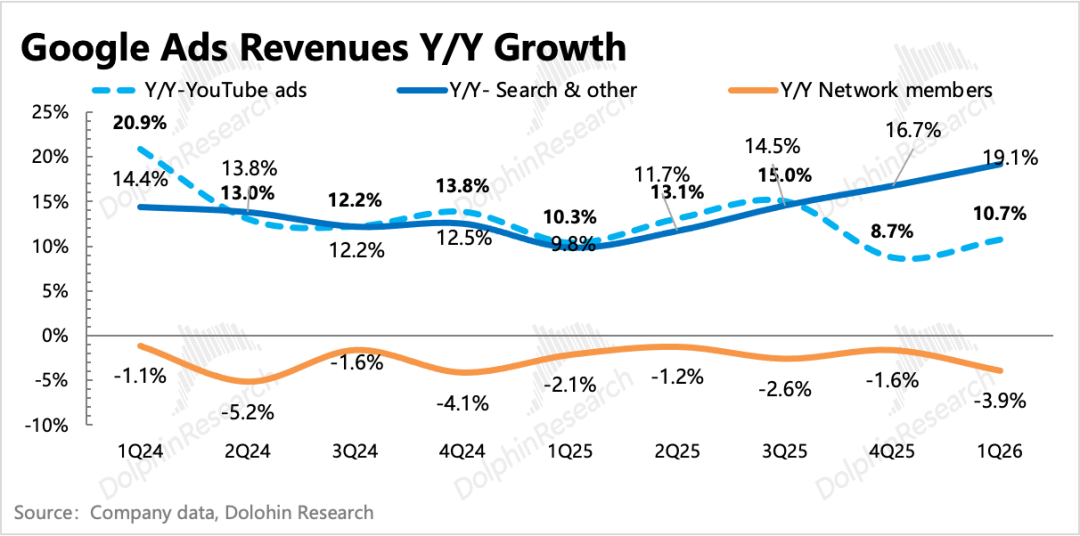
2. No ghost stories—search remains strong: Revenue grew by 19%, and even accounting for a potential less-than-2 percentage point tailwind from exchange rates, there was no sequential slowdown from last quarter. This reflects two aspects: first, the impact of internal and external AI erosion is still limited, and the company is still enjoying the dividend (dividends) of increased user search volume and improved conversion effects driven by AI in the short term; second, it confirms the strong U.S. macroeconomic environment in Q1 and the industry's brand marketing boost from the Winter Olympics.
3. Slow recovery in YouTube advertising: YouTube's ad revenue grew by 10%, again missing consensus expectations. While there was slight sequential improvement, growth remains burdened, representing an inevitable adjustment period as long-form video integrates short-form content to adapt to industry transformation.
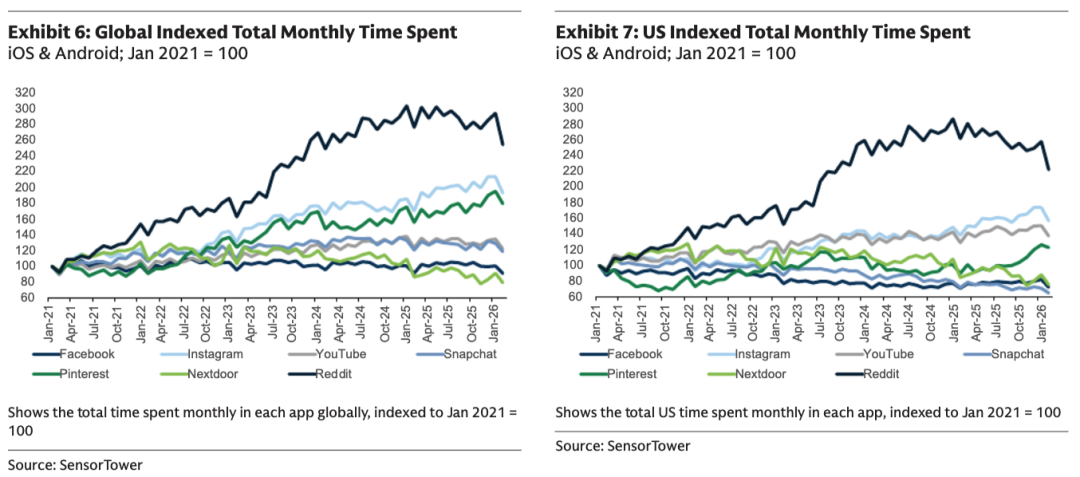
Competition in the traditional long-form video pre-roll ad market has also intensified, with Netflix, Disney, and Amazon Prime all ramping up ad-supported packages in recent years. Meanwhile, Shorts faces stronger competition from rivals like Reels and TikTok, making it difficult to compensate for the long-form video growth gap in the short term.
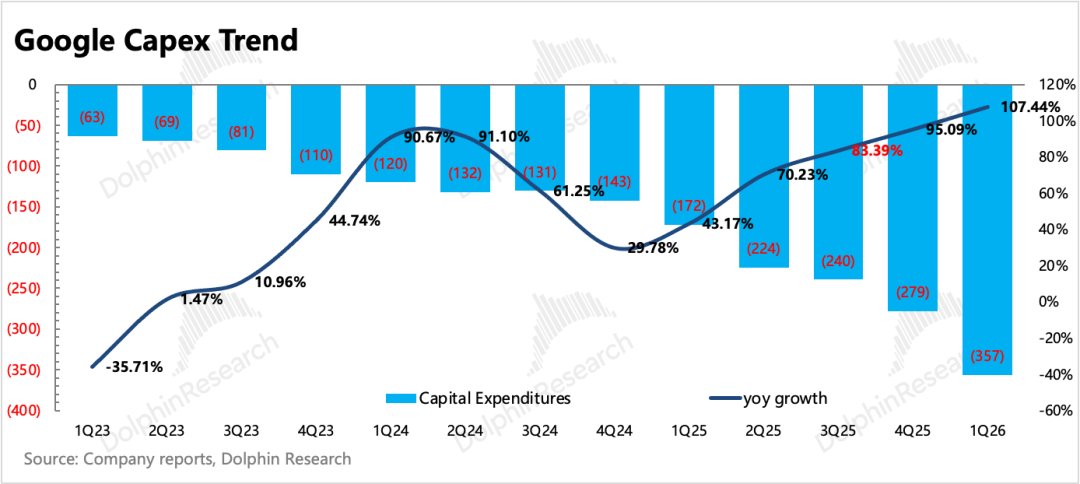
4. Slight increase in Capex: This year's Capex guidance was raised slightly from $175-$185 billion to $180-$190 billion, representing a year-on-year doubling. Q1 confirmed $35.7 billion, up 107% year-on-year, slightly below consensus expectations of $36.4 billion. However, strong demand makes it difficult to curb Capex expansion, with management expecting significant growth to continue through 2027.
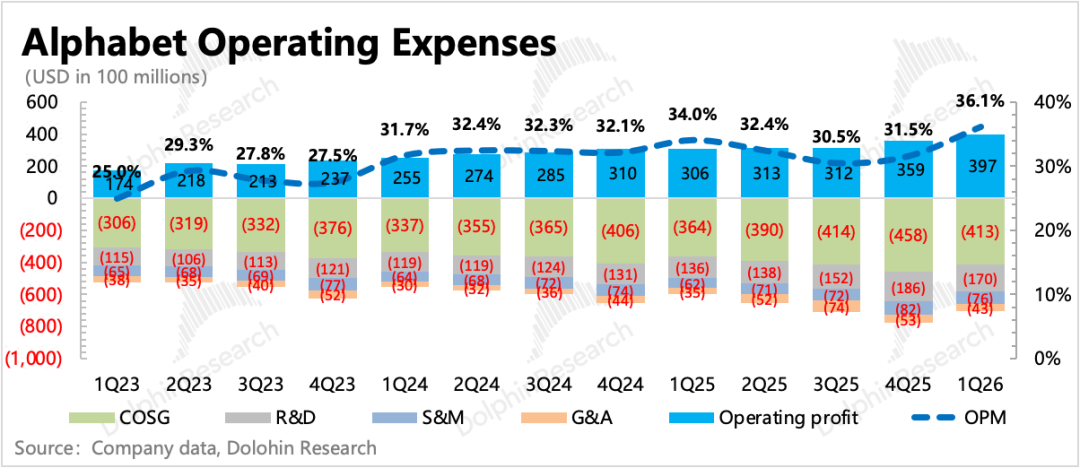
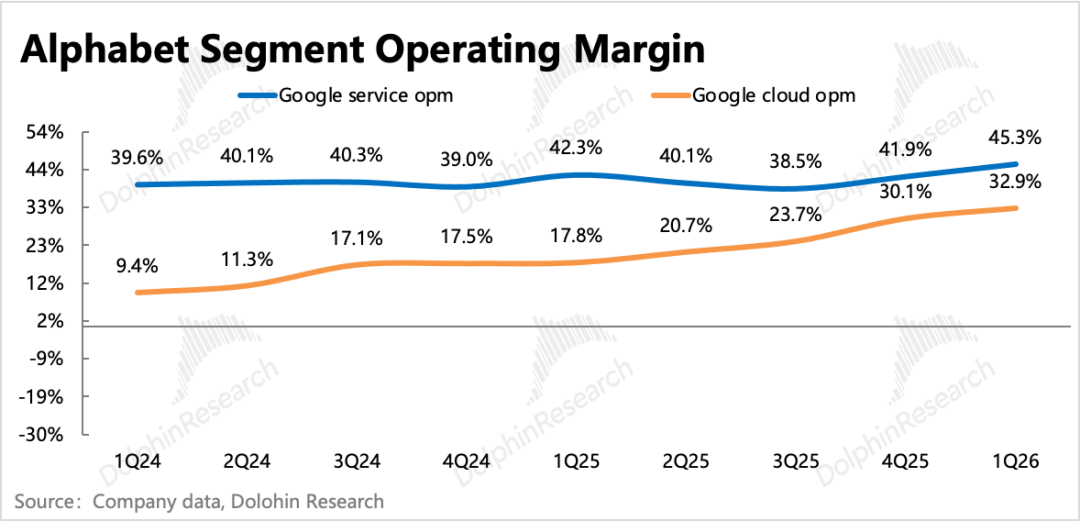
5. Profit margin dividend (window) period: Q1 operating profit margin climbed to 36%, up 2 percentage points year-on-year, primarily driven by gross margin improvements, while operating expenses increased slightly by 0.5% year-on-year. The phenomenon of significant investment coinciding with margin expansion is interesting.
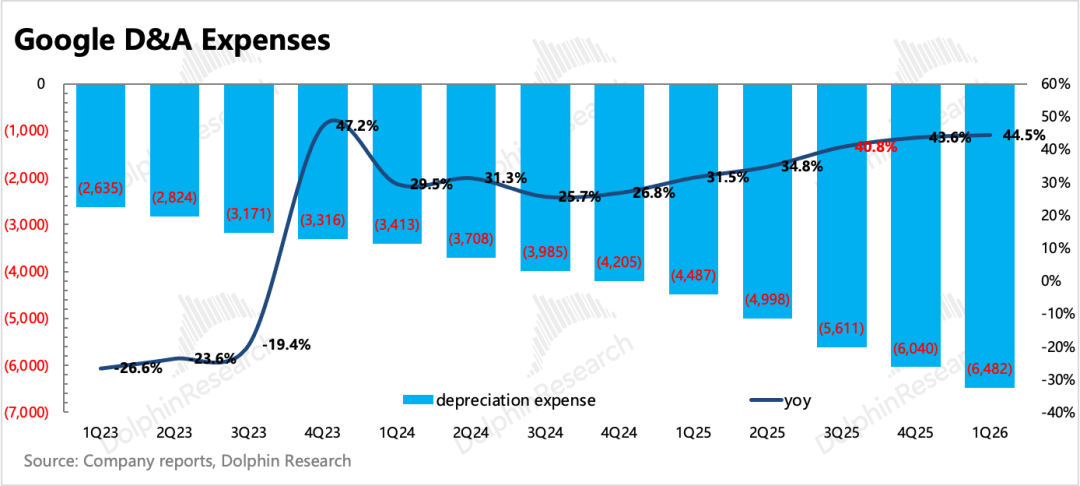
In the short term, AI demand has Continuously fulfilling (continuously materialized) and rapidly become an important growth driver (with cloud business contributing 40% of total revenue growth). However, Capex investment, which has been accelerating since the second half of last year and is expected to double this year, is still being depreciated quarterly, with a gradual impact on costs. Therefore, a short-term window for margin expansion exists due to extreme supply-demand imbalance.
Conversely, starting in the second half of the year, the suppressive impact of high investment on profit improvement is expected to emerge unless current market Prosperity level (prosperity) and supply-demand gaps continue to widen, allowing cloud providers to raise prices further.
6. Share buybacks paused, dividends increased slightly: Due to high investment needs, to ensure sufficient cash flow for flexible deployment (including internal and external investments), share buybacks were paused in Q1, and debt financing was issued. Dividends increased by 5% year-on-year starting this year, but the scale remains too small to be meaningful.
7. Key metrics vs. expectations
Dolphin Research's View
Similar to last quarter, Google once again demonstrated explosive growth, validating the imagination behind its AI narrative. Meanwhile, the consistently reliable management team showed firm commitment to investment through significantly increased Capex, indicating a promising future.
AI has moved beyond the stage where mere promises and valuations could drive explosive growth. Delivering results while investing is the most convincing development model for capital. Thus, the current Google—activated by AI to accelerate revenue growth, possessing growth imagination, and ensuring no deterioration in profit margins—is exactly what capital prefers to see.
However, we also note that profit margins are enjoying a temporary dividend period. Whether they can continue to improve steadily requires further tracking based on market changes in AI supply-demand gaps. From our estimates, some pressure from high investment conversion may emerge in the second half of the year. Potential mitigation strategies could include workforce optimization and developing more high-value products or services.
As long as the "investment-for-growth" logic chain remains intact, capital will continue to offer a premium. However, after-hours trading saw Google rise 7% to a $4.5 trillion valuation, reaching 28x/25x P/EBIT for this year and next year's expectations—above its historical valuation range and justified by current growth rates.
While we are optimistic about Google's prospects and recognize (endorse) the medium-term logic, given potential margin pressures in the second half of the year and high-valuation listings of OpenAI and Anthropic this year (which could intensify competition due to their own monetization needs or face higher financial requirements after disclosing operating data), any disappointment could trigger sentiment contagion across the industry.
Thus, from a risk-reward perspective, we prefer to seek more comfortable entry points during industry sentiment divergences.
Detailed Financial Results Analysis Below
1. Google Overview
Google's parent company, Alphabet, has a diverse business portfolio, and its financial reporting structure has undergone multiple changes. For those unfamiliar with Alphabet, here's an overview of its business architecture.
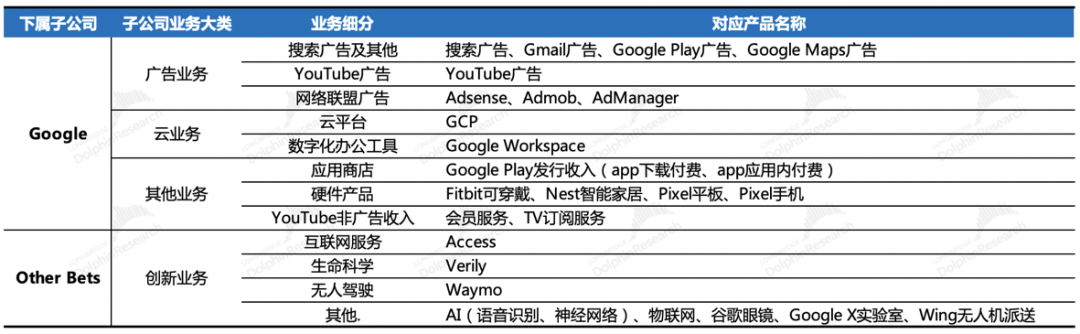
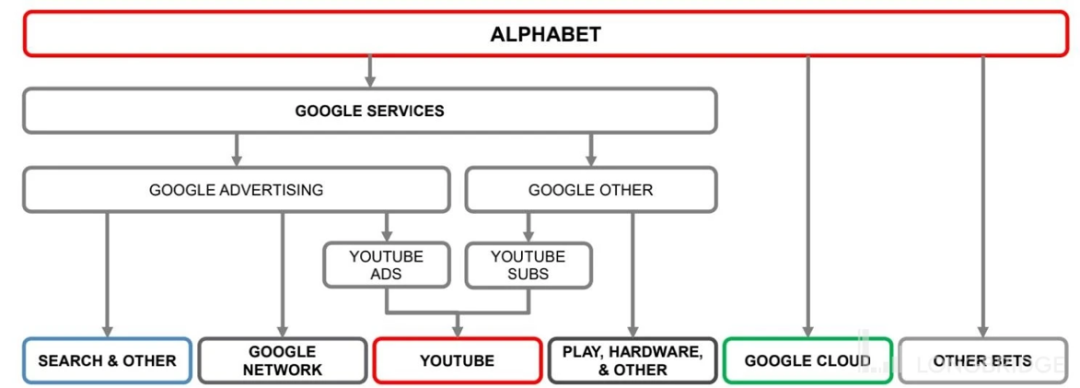
Briefly outlining Google's fundamental long-term logic:
a. Advertising remains the primary revenue contributor and profit driver. Search advertising faces medium- to long-term erosion risks from feed-based ads, with high-growth streaming platform YouTube serving as a complement.
b. Cloud business has become the company's main growth driver and narrative, as well as the most direct beneficiary of AI.
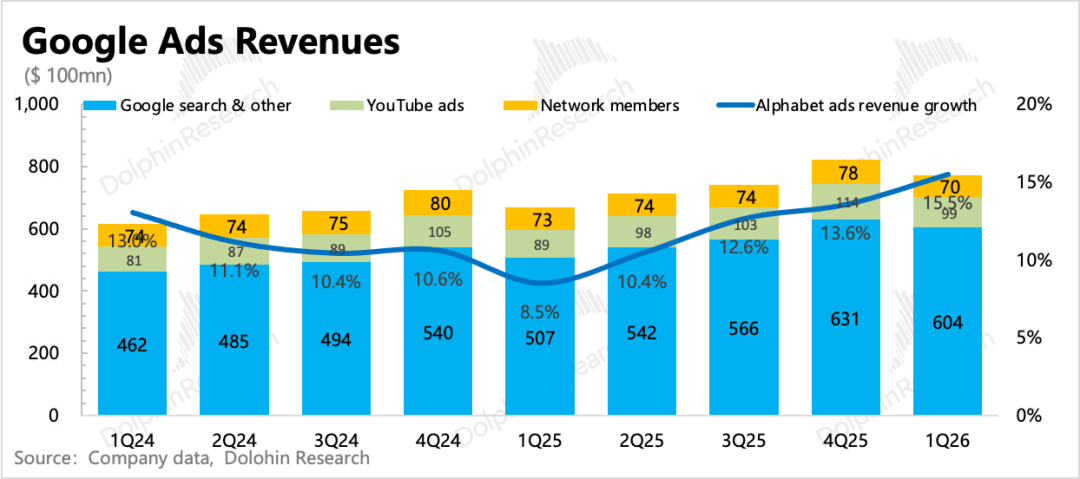
2. Overall strong advertising performance, with search outperforming YouTube
Q1 advertising revenue reached $77.3 billion, up 15.5% overall. The industry performed well during the period, driven by macroeconomic resilience and brand marketing budgets/spending will (willingness) from the Winter Olympics, especially for travel-related ads. Leading companies benefited from AI technology enhancements, maintaining solid growth.
Google's core search business accelerated with 19% growth in Q1, indicating continued positive penetration of Gemini 3. However, YouTube advertising showed no clear recovery, which we attribute to the inevitable transition pains of balancing short-form and long-form content ecosystems amid shifting consumption trends, despite YouTube having Shorts.
Meanwhile, Shorts alone faces competitive gaps with Instagram Reels and TikTok, leading to greater internal cannibalization from lower-priced CPMs in the short term.
Q2 may face short- to medium-term macro impacts from U.S.-Iran friction, potentially affecting performance-based search ads less severely. However, the World Cup starting in June and midterm elections in Q3 could partially offset these effects.
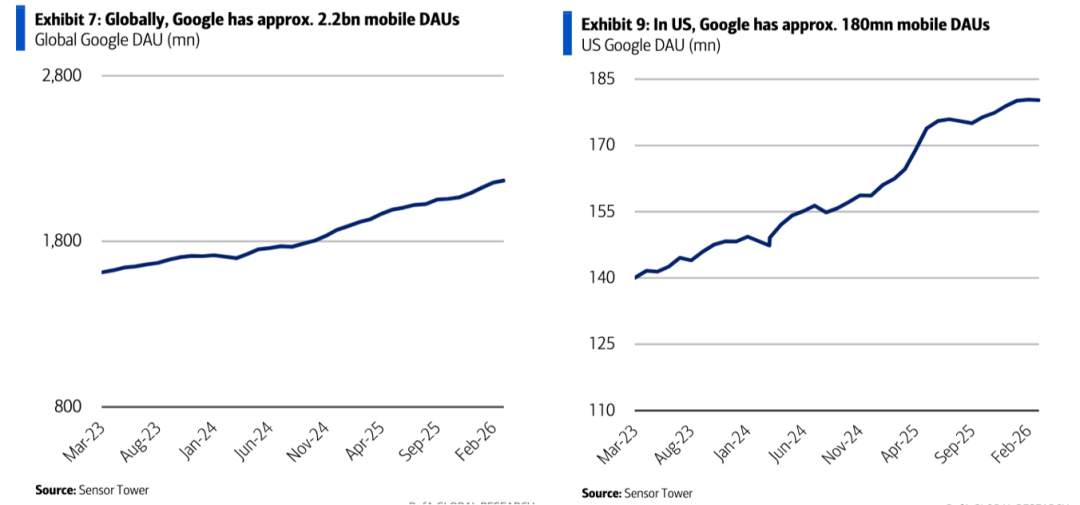
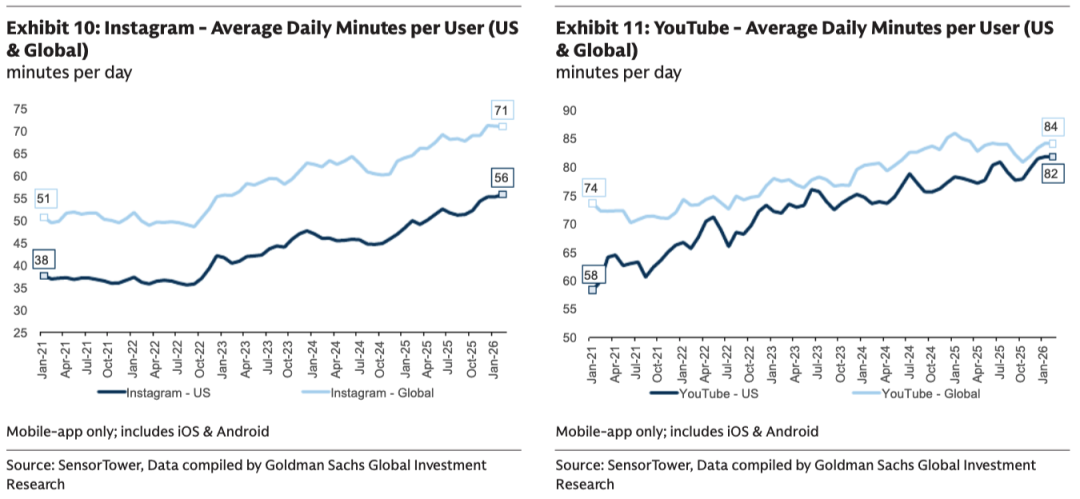
Currently, YouTube's user ecosystem, while not matching Instagram and Facebook at the top, remains solid: user numbers grew slightly, and daily average usage time increased steadily.
3. Cloud: Doubled backlog + firm high investment confirm popular (explosive) demand
Cloud business is a critical pillar in Google's AI revaluation, with market attention focused on backlog growth from a forward-looking perspective.
Q1 cloud performance again exceeded expectations, with key sentiment indicator—remaining backlog—reaching $462 billion, a net increase of $220 billion sequentially (implying $240 billion in new contracts). Over half of the backlog will be recognized as revenue within two years, providing ample "inventory" to sustain high cloud growth for 1-2 years.
Enterprise demand for AI is rising sharply. Google disclosed at its Next conference that its proprietary models now process 16 billion Tokens per minute via direct API calls, up significantly from 10 billion at the end of Q4 last year.
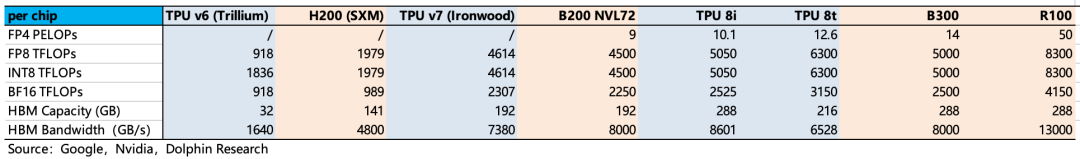
Cloud growth aligns with AI era development, augmented by Google's "full-stack technical advantages" in enterprise solutions (TPUs, Gemini foundation models, Gemini Enterprise agents, etc.). The recent eighth-generation TPU release doubled performance compared to v7 (higher throughput, larger storage, better bandwidth), further enhancing cloud offerings in complete AI infrastructure platforms. Key features:
(1) Dedicated chips for different scenarios: The eighth-generation TPU introduces specialized chips for training vs. inference scenarios (high computational throughput vs. low latency + high concurrency + Agentic workload optimization), with TPU 8t for large-scale training and TPU 8i for inference.
Similar scenario-specific divisions existed in v5 (v5p for ultra-large-scale training, v5e for cost-effective medium-scale inference), but this iteration offers clearer categorization and distinct performance characteristics.
From single-chip performance comparisons, TPU v8 supports FP4 computation precision for the first time, maintaining energy efficiency while improving throughput, and expands memory and bandwidth to reduce latency.
(2) Enhanced interconnectivity: Unlike GPUs' standalone capabilities, TPUs excel in "teamwork," relying on system interconnect technology.
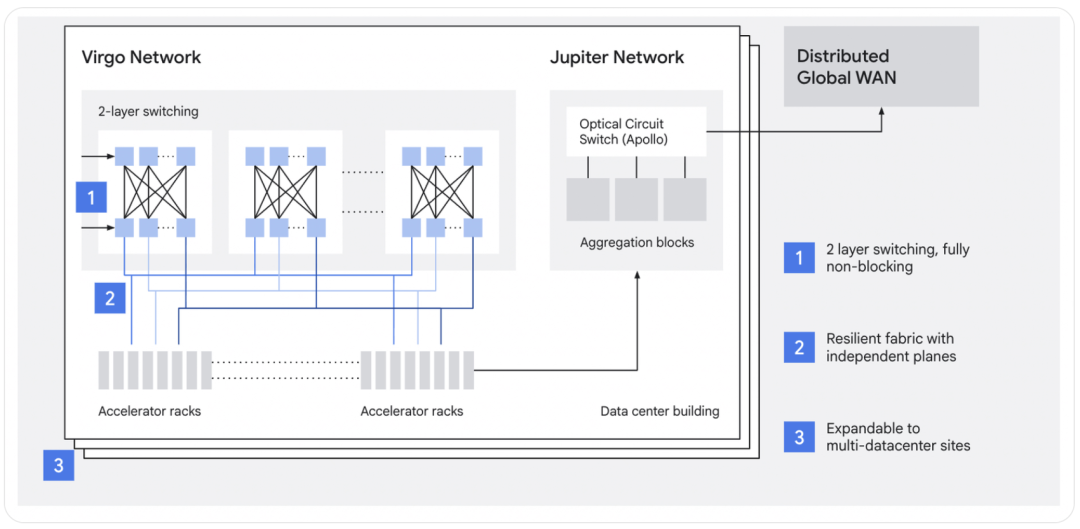
TPU v8 further pushes interconnectivity limits—increasing chips per Pod (from 9,216 in v7 to 9,600 in 8t) while innovating beyond Pod-level connections to rack-level ICI/SPOCS, then to Virgo within the same data center, Jupiter for wider expansion, and ultimately to distributed wide-area networks, enabling clusters of up to 134,000 or even millions of TPUs.
After refining the overall AI infrastructure solution (including GPU, Jupiter/OCS networking, Hyperdisk/Cloud Storage, Cluster Director, DWS, Pathways, and other scheduling and software layer capabilities), TPU, as a competitor to GPU, can then be officially sold on a large scale in the future.
Most of the direct sales portion of TPU chips in current orders will recognize revenue in 2027, corresponding to the 1P data centers that Anthropic and Meta are set to establish one after another (Chinese term meaning "successively" or "one after another") in 2027.
In April, Google announced a $40 billion strategic investment in Anthropic, with an initial investment of $10 billion and a commitment to provide 5GW of computing power over five years. Additionally, some medium-sized contracts ranging from $100 million to $1 billion also made significant contributions.
In addition to basic computing power, most of the orders in hand are cloud contracts, with demands including Gemini's API, Workspace, Vertex AI, and network security.
IV. Other Businesses: CTV & Google One Continue to Drive 25 Million New Subscribers
This revenue is primarily composed of YouTube subscriptions (ad-free membership, TV, music, etc.), Google Play, Google One, hardware (Pixel phones and Nest smart home devices), etc.
In the first quarter, other revenues reached $12.4 billion, a 19% year-over-year increase, with accelerated growth. This indicates a recovery from the disruption in the Pixel sales cycle last quarter. Management disclosed that YouTube and Google One drove the increase in subscription members to 350 million, a net increase of 25 million quarter-over-quarter.
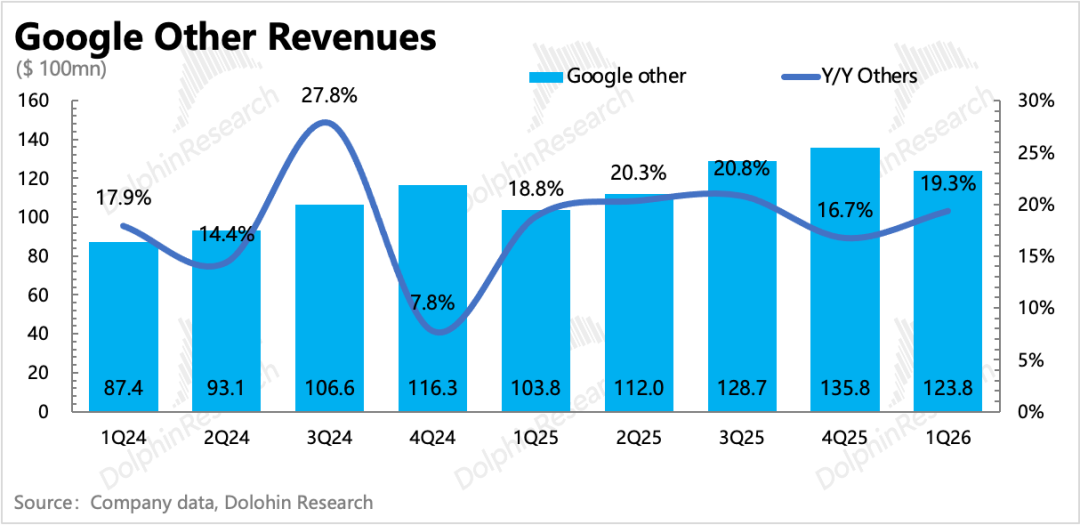
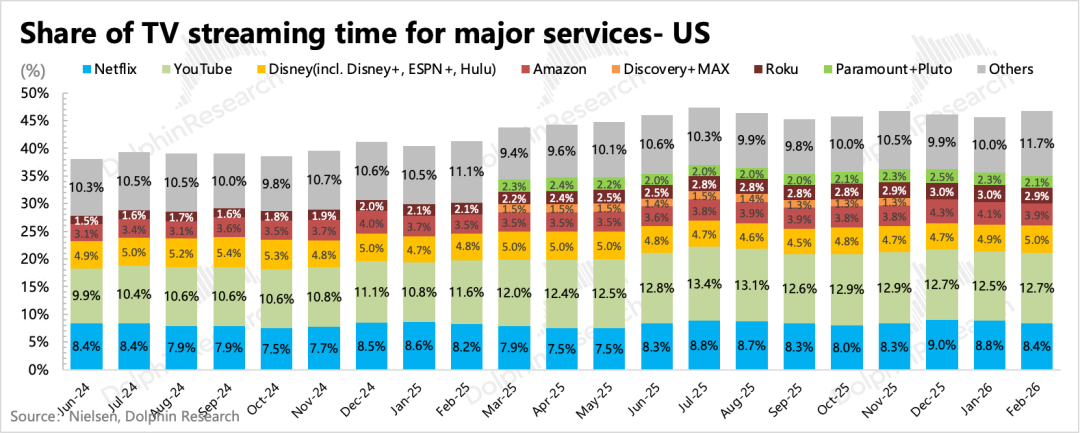
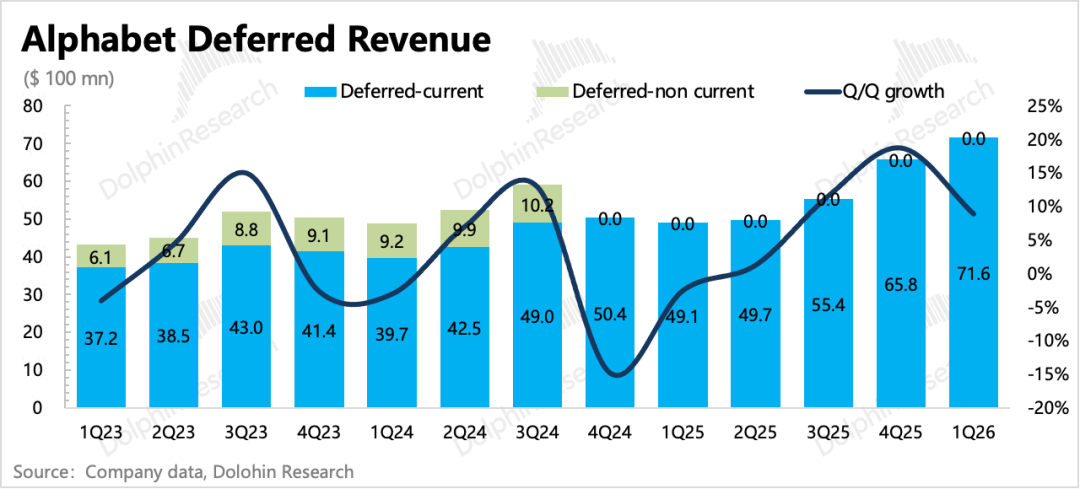
According to Nielsen's data, the growth in subscription revenue from YouTube CTV and Google One appears to be the main driving force. The deferred revenue situation also shows a significant increase in advance subscription-based revenue.
V. Profitability Enjoys a Bonus Window
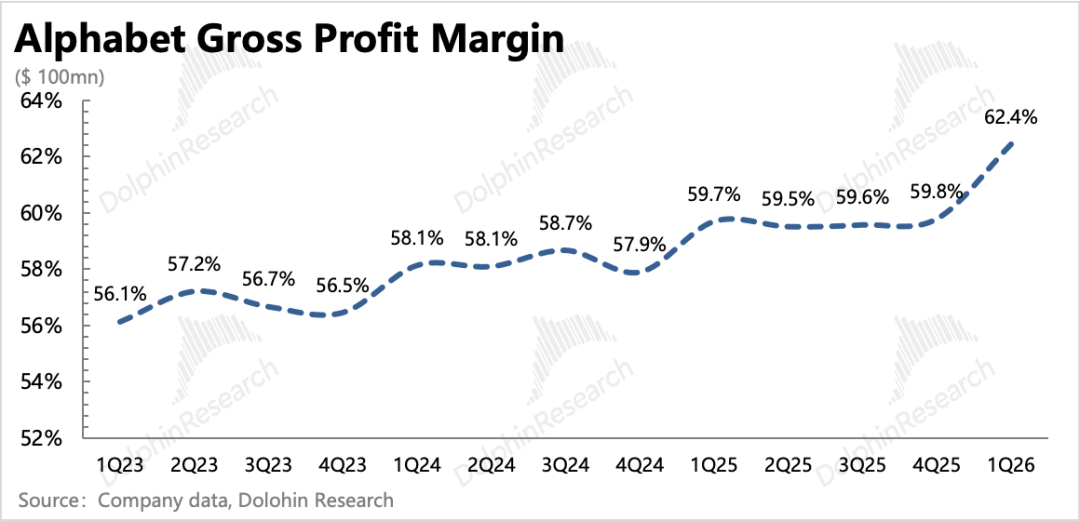
In the first quarter, the operating profit of the core business reached $39.7 billion, with the profit margin increasing to 36%. At first glance, how can Google simultaneously invest in expansion while achieving profit growth?
The exceed expectations (Chinese term meaning "exceeding expectations") profit margin primarily stems from the gross profit margin, and further, the main difference in expectations lies in depreciation and amortization. There exists an alternative "mismatch" period here. On one hand, the surge in demand on the revenue side is rapid, especially after the popularity of Agents/Skills. On the other hand, the high investments in the past two years have gradually increased depreciation costs quarter by quarter.
During this window, cloud services are transitioning from pure computing power to comprehensive solution services to meet the rapid access needs of more users. As a result, the amount per cooperation and per capita revenue are increasing, leading to a significant optimization of the economic model.
Conversely, it is expected that starting in the second half of the year, the suppressive impact of high investments on profit improvement will become evident. The company has also expressed expectations for a significant increase in Capex in 2027. Unless the current prosperity and supply-demand gap continue to widen, providing cloud vendors with more room for price increases.
In terms of business segments, not only did Google Services see a quarter-over-quarter increase, but the profit margin of the cloud business also further improved to 33%, while the market originally expected the profit margin to decline quarter-over-quarter under investment pressure.
In the first quarter, capital expenditures reached $35.7 billion, slightly lower than market expectations. However, the company expects capital expenditures for the year to be in the range of $180 billion to $190 billion, representing a doubling in growth. Management's firm commitment to investment for two to three consecutive years indicates that the current growth trend in AI demand has not shown signs of cooling down.
- END -
// Republication Permission
This article is an original work by Dolphin Research. Republication requires authorization.
// Disclaimer and General Disclosure
This report is for general comprehensive data purposes only, intended for general reading and data reference by users of Dolphin Research and its affiliated institutions. It does not take into account the specific investment objectives, investment product preferences, risk tolerance, financial situation, or special needs of any person receiving this report. Investors must consult with independent professional advisors before making investment decisions based on this report. Any person making investment decisions using or referring to the content or information mentioned in this report must bear their own risks. Dolphin Research shall not be liable for any direct or indirect responsibilities or losses that may arise from the use of the data contained in this report. The information and data contained in this report are based on publicly available materials and are for reference purposes only. Dolphin Research strives to ensure but does not guarantee the reliability, accuracy, and completeness of the relevant information and data.
The information or opinions mentioned in this report shall not, under any jurisdiction, be regarded or construed as an offer to sell securities or an invitation to buy or sell securities, nor shall they constitute advice, inquiries, or recommendations regarding relevant securities or related financial instruments. The information, tools, and materials contained in this report are not intended for or intended to be distributed to jurisdictions where the distribution, publication, provision, or use of such information, tools, and materials conflicts with applicable laws or regulations, or to citizens or residents of jurisdictions where Dolphin Research and/or its subsidiaries or affiliated companies are required to comply with any registration or licensing requirements in that jurisdiction.
This report only reflects the personal views, insights, and analytical methods of the relevant creators and does not represent the stance of Dolphin Research and/or its affiliated institutions.
This report is produced by Dolphin Research, and the copyright is solely owned by Dolphin Research. Without the prior written consent of Dolphin Research, no institution or individual shall (i) make, copy, reproduce, duplicate, forward, or any other form of copies or replicas in any way, and/or (ii) directly or indirectly redistribute or transfer to other unauthorized persons. Dolphin Research reserves all relevant rights.
-
![]()
Tesla Restructures Its Balance Sheet
-
![]()
Accelerating the High-Speed Interconnection Upgrade of AI Computing Clusters! JONHON Releases ELSFP External Light Source Optical Connectors
-
![]()
Breaking the overseas blockade of volumetric holographic materials, this optical enterprise secures nearly 100 million yuan in financing!
-
![]()
Why Does Jensen Huang So Openly Praise China’s AI?
-
![]()
"Wudang" Unveiled: Arm China's Next-Gen AI VPU Redefines Video Encoding
-
![]()
From Energy Conservation and Carbon Reduction to AI Decision-Making: GECON East Intelligence and Chery Group Explore a New Green and Smart Paradigm for Automobile Manufacturing
-
![]()
WAIC 2026 Observation | AI Accelerates Towards the Core of Industries, Industrial AI Enters a Critical Phase
-
![]()
Volkswagen China Fires the First Shot in Foreign-Funded 'White Box Delivery'!