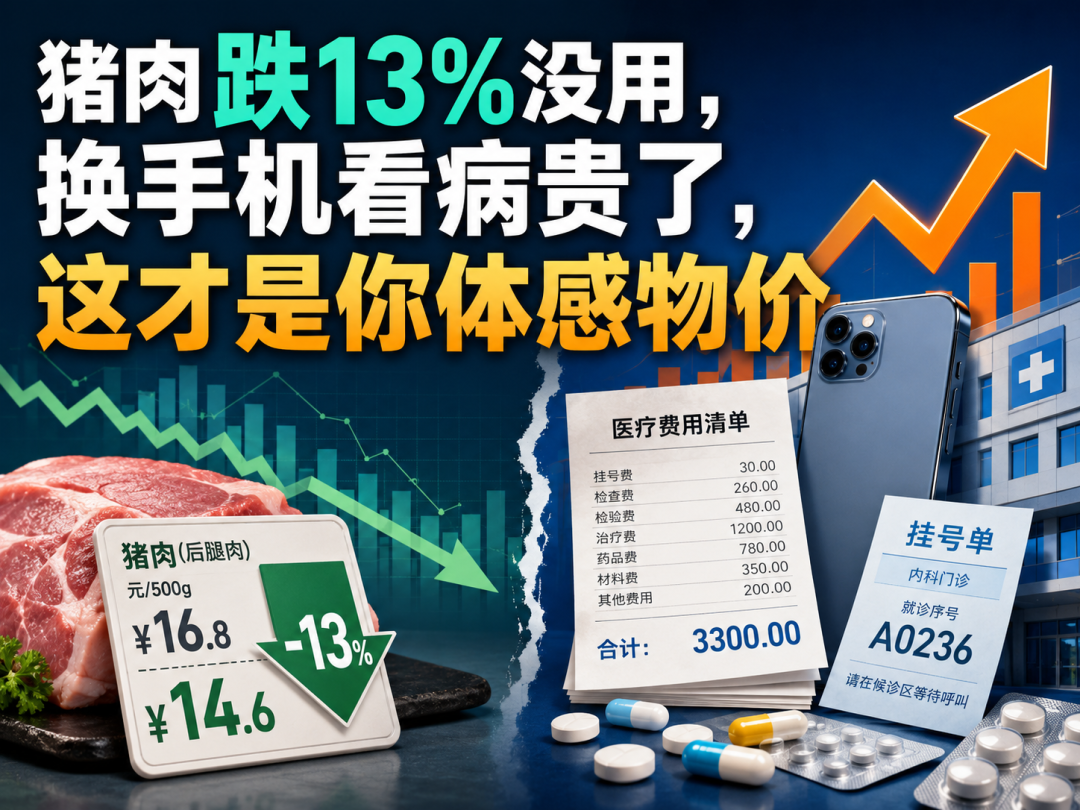
Pork Prices Plummet by 13%, Yet Smartphones and Healthcare Costs Soar: Here's Why Your Wallet Feels the Pinch
 08/10 2026
 345
345
Author | Jiang Xu. For more financial insights, visit BT Finance Data Pass. This article spans 2495 words and is estimated to take 9 minutes to read.
On August 9, 2026, the National Bureau of Statistics unveiled the price data for July: The national Consumer Price Index (CPI) saw a 0.5% year-on-year increase, with the core CPI rising by 0.9% (Source: National Bureau of Statistics, August 9, 2026).
However, the same report highlighted that prices for computers, tablets, and mobile phones surged by 17.4%, 17.2%, and 8.5% year-on-year, respectively, while medical services climbed by 4.3%. Conversely, food prices dipped by 1.5%, with pork prices plummeting by 13.3% (Source: National Bureau of Statistics, August 9, 2026).
Many individuals' initial reaction is: If the CPI is only 0.5%, why does my personal spending feel nothing like a mere 0.5% increase? The answer doesn't hinge on whether the statistics or personal experience is "more real." Instead, they are addressing entirely different queries. The CPI measures the weighted average of a nationwide basket of goods and services, whereas your personal experience is contingent on where you actually allocate your funds.
1
The 0.5% Masks Competing Forces

Delving into July's data reveals how this "average" is constructed. The National Bureau of Statistics elucidated that the price hikes for computers, tablets, and mobile phones collectively contributed approximately 0.14 percentage points to the year-on-year CPI increase. Medical services, up by 4.3%, added roughly 0.28 percentage points. Meanwhile, the decline in food prices (down 1.5%) reduced the CPI by about 0.25 percentage points, with pork (down 13.3%) accounting for roughly 0.25 percentage points of that decrease (Source: National Bureau of Statistics, August 9, 2026).
In essence, certain items are propelling the index upward, while others are dragging it downward. The overall CPI of 0.5% is the culmination of these opposing forces. It doesn't imply that every item rose by 0.5%, nor that every household's cost of living altered by just 0.5%.
Key Data: July CPI year-on-year +0.5%, core CPI +0.9%; computers +17.4%, tablets +17.2%, mobile phones +8.5% (combined impact ~0.14 percentage points); medical services +4.3% (~0.28 percentage points); food -1.5%, with pork -13.3% (~0.25 percentage points) (Source: National Bureau of Statistics, August 9, 2026).
2
High Growth Doesn't Equate to High Impact
Here's a counterintuitive notion: The items with the steepest price hikes don't necessarily exert the most significant influence on the overall CPI. The rationale lies in "weighting." A household might only replace computers and phones every few years, but expenditures on food, housing, transportation, and medical services occur continuously.
Thus, while computer prices soared by 17.4%—far exceeding medical services' 4.3%—the latter contributed roughly 0.28 percentage points to July's CPI increase, compared to just 0.14 percentage points from computers, tablets, and phones combined. The growth rate is merely one facet; spending weight dictates how much an item can sway the overall index.
This is where "perceived inflation" diverges most starkly. Households that recently upgraded their electronics or frequently utilize medical services will encounter more pronounced price increases, while those with higher meat spending and no major durable goods purchases may experience entirely different price trends.
3
Your Prices Have Three Strata
To translate macro data into personal life, categorize prices into three strata: First, examine the national CPI for the economy's average price trend. Second, scrutinize subcategory prices for your high-frequency spending to discern which items are rising or falling. Third, consider your household's spending structure to ascertain if price increases align with your recent expenditures.
A Portable Framework · Three-Tier Personal Price Index: National CPI for the big picture → Subcategory prices for winners and losers → Household spending weights for what truly affects you. Averages address macro questions; spending structures address personal ones.
This approach is more efficacious than debating "CPI accuracy." A national index necessitates standardization, but personal lives are inherently diverse. Households with elderly members, children, or those undergoing renovations, car purchases, or phone upgrades will witness significant spending shifts.
4
Grasp the Statistical Methodologies
Commencing January 2026, China's CPI adopted 2025 as the new base year, adjusting survey categories, representative products, survey outlets, and classification weights to mirror changes in consumer spending. The National Bureau of Statistics estimates that the base year update affects monthly CPI year-on-year indices by an average of 0.06 percentage points (Source: National Bureau of Statistics, August 9, 2026).
This detail is often overlooked. The CPI isn't a static basket; it evolves with societal consumption patterns. However, regardless of how weights are updated, it must represent a national average and cannot be tailored for every household. A family with a newborn, retirees, or frequent business travelers will inherently face different spending structures.
Additionally, distinguish between year-on-year and month-on-month changes. Mobile phone prices rose by 8.5% year-on-year in July but by 1.0% month-on-month; tablets increased by 17.2% year-on-year and by 11.3% month-on-month. Year-on-year answers "how much more expensive than a year ago," while month-on-month answers "how much it changed since last month." Mixing these frameworks can amplify misinterpretations of price trends.
5
Smartphone Price Hikes Have an Additional Dimension
The National Bureau of Statistics explicitly noted in its July data interpretation that AI-driven upgrades in consumer electronics have bolstered demand and prices. Month-on-month, tablets, computers, and mobile phones rose by 11.3%, 5.5%, and 1.0%, respectively (Source: National Bureau of Statistics, August 9, 2026).
This indicates that July's consumer electronics price changes aren't merely a tale of "general inflation" but also reflect product upgrades, shifting demand structures, and supply chain cost dynamics. In other words, within the same CPI, macro price trends coexist with industry-specific cycles.
The following is speculative for readers' reference. In the future, focusing solely on a single aggregate figure will increasingly miss the mark. As consumption patterns diversify and product iterations accelerate, "personal price gaps" between households will widen. While the overall CPI remains crucial, it resembles a national average temperature; what truly determines whether you need a jacket is the weather in your specific locale.
6
Why This Matters to You
Those planning to purchase new phones or computers should concentrate on consumer electronics subcategories rather than inferring prices from the 0.5% aggregate CPI. Households with ongoing medical expenses should prioritize medical services data. Those with high food spending will more directly perceive changes in pork and other food prices.
Thus, the 0.5% doesn't invalidate anyone's personal experience. Instead, it reminds us that beneath a single average, multiple price realities can coexist. Next time you encounter the CPI, don't ask "Why don't I feel it?" First, scrutinize where your money has actually been allocated lately.
Reference Data Sources: National Bureau of Statistics’ “Resident Consumer Prices Rose 0.5% Year-on-Year in July 2026” and “Chief Statistician Dong Lijuan’s Interpretation of July 2026 CPI and PPI Data,” both released August 9, 2026.
What are your thoughts? Share your views in the comments.
This article provides interpretations of public statistical data and consumption structure analysis only and does not constitute consumer advice or investment recommendations. The CPI is a composite indicator of national resident consumption prices and does not equate to actual cost-of-living changes for any single household. "Personal prices" herein serve as an analytical framework for understanding spending structures, not an official statistic. Content marked "speculative" represents logical analysis based on public information.
This article is original to BT Finance and may not be used, reproduced, disseminated, or adapted without permission. Infringement will result in legal action.
-
![]()
Proposed to Raise 955 Million Yuan through Private Placement! Huicheng Vacuum Boosts Localization of Ultra-Precision Optical Coating Equipment
-
![]()
Cash Flow Soars 13-Fold! What Major Strategic Move is Wuhan Five Square Optoelectronics Planning?
-
![]()
Leaked Design of vivo X500: Reverts to Circular Camera Module in Top-Left Corner, Pays Homage to Classic X90 Aesthetic
-
![]()
DeepSeek Shows Signs of Foraying into Code Agents, Launches WeChat Official Account Focused on Harness
-
![]()
Auto Companies Deny Claims That ‘Cooperation with Huawei Is Non-Essential’, as Huawei Transforms into a ‘Public Platform’
-
![]()
Starship to Independently 'Return to the Launch Tower': SpaceX's Ambitions Extend Beyond Rocket Building to Dominating Space Transportation
-
![]()
Starship Set to Independently 'Return to the Launch Tower': SpaceX is Revolutionizing Space Transportation, Not Just Building Rockets
-
![]()
Anthropic and OpenAI Face Off Against Deepseek