
Cadence Achieves Record Revenue of $1.584 Billion in Q2 2026, with China Driving 37% of Growth: Fines Recouped Within a Single Quarter
 08/18 2026
 418
418
Produced by Zhineng Zhixin
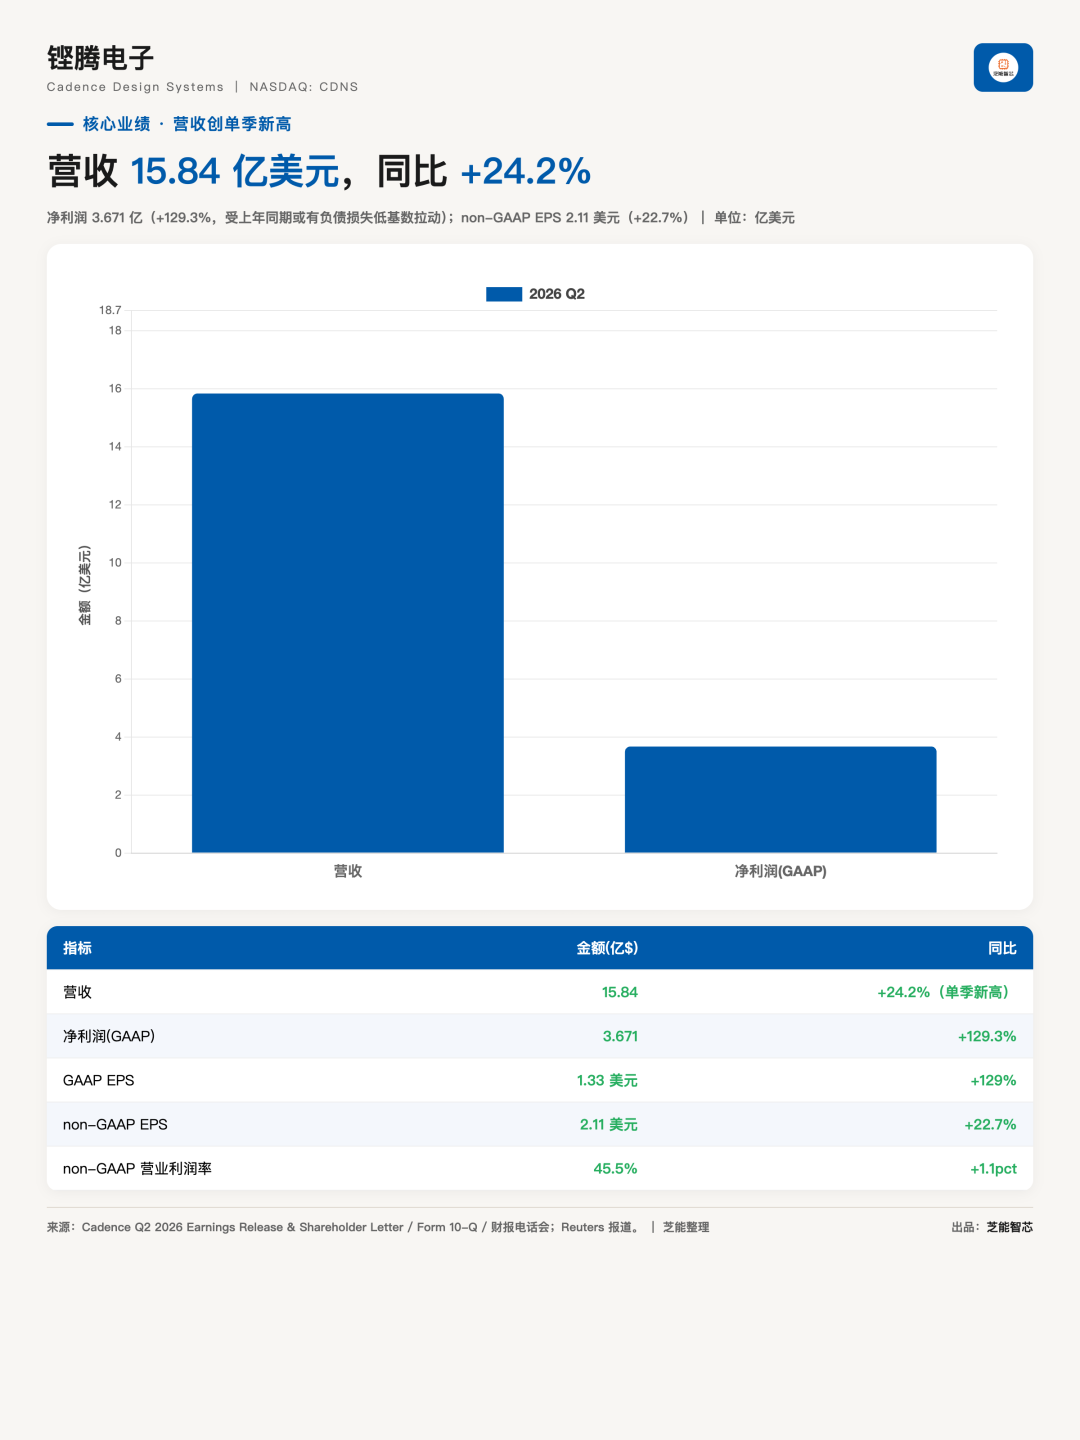
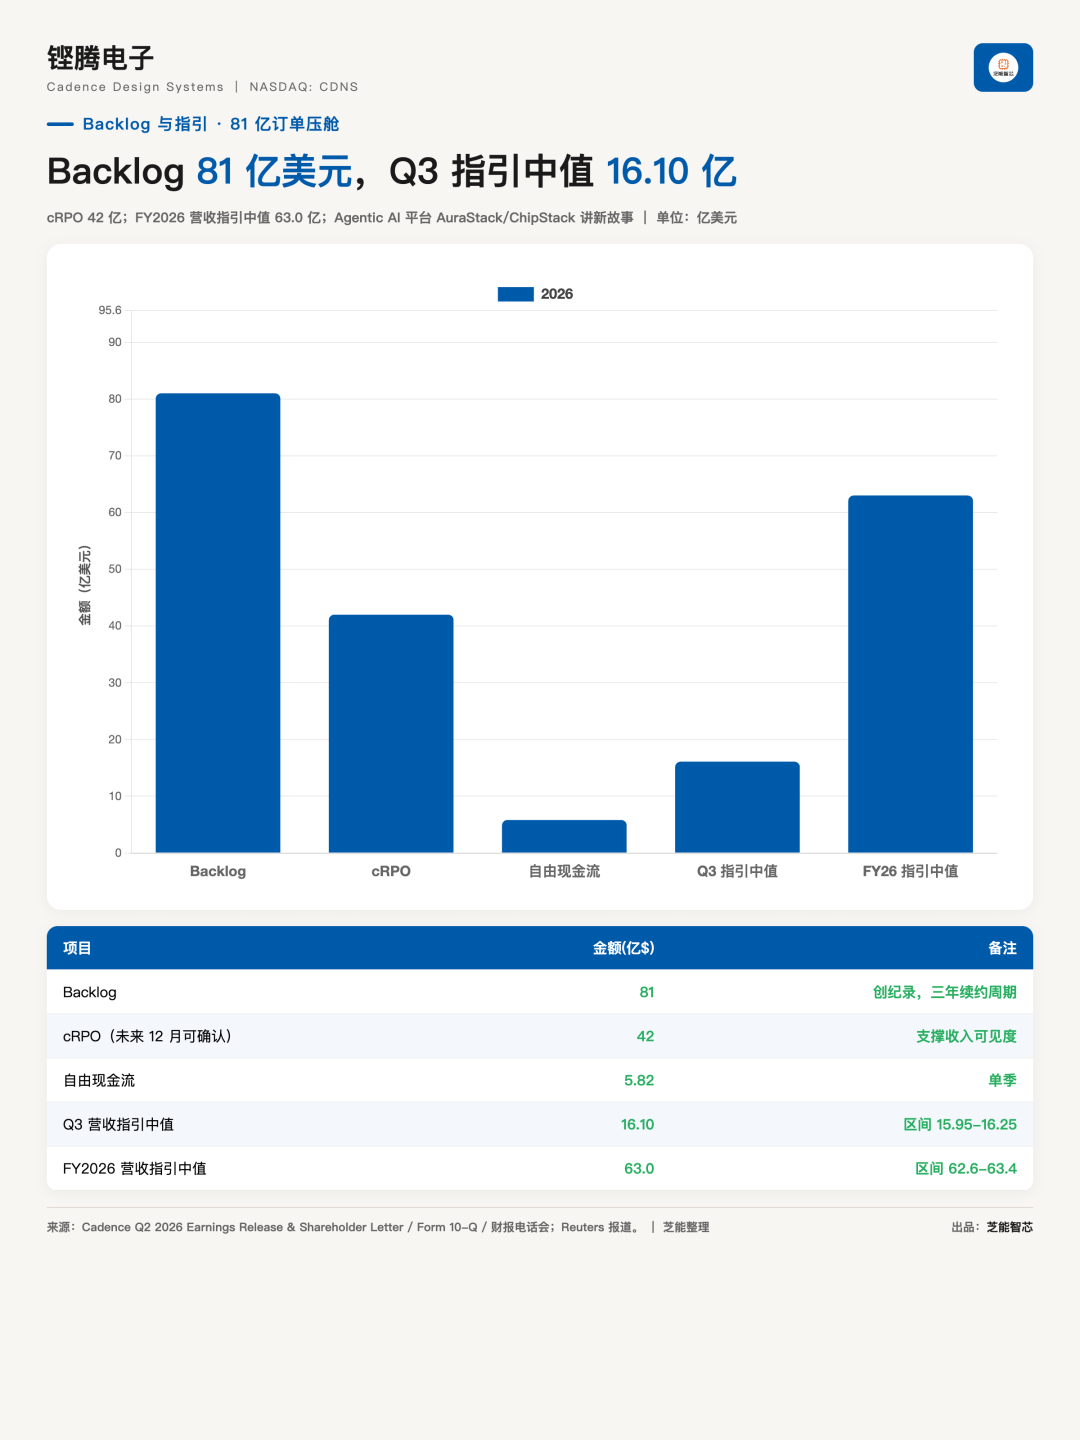
Cadence has just released its quarterly financial report, showcasing a revenue of $1.584 billion, marking a 24% year-over-year (YoY) increase. This represents the fastest growth rate in recent years for Q2 2026. Simultaneously, the company's backlog (order reserve) soared to a record $8.1 billion.
Part 1: AI Shines in This Financial Report. How Is the Chinese Market Faring?
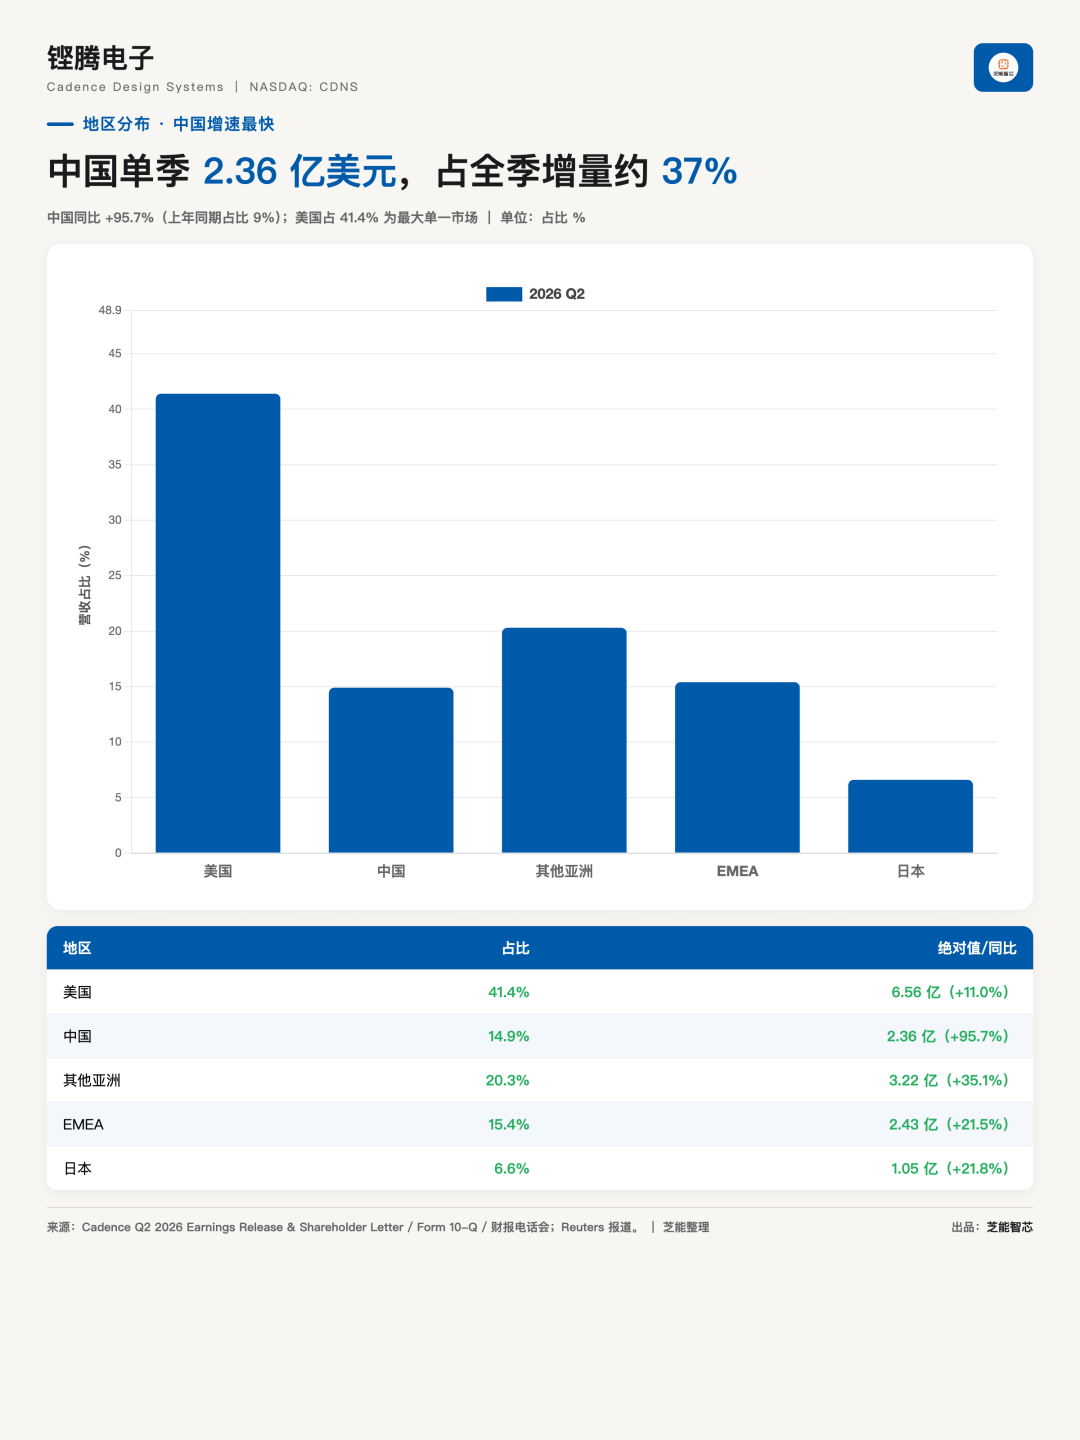
China's business segment generated $236 million in a single quarter, nearly doubling YoY. Its share in Cadence's total revenue rose from 9% to 15%.
Just a year ago during the same period, Cadence completed the payment of a $140.6 million fine for illegal exports to China. This fine was 3.1 times the value of the goods involved. Yet, a year later, China's quarterly revenue reached $236 million, with the fine amounting to just 60% of that figure.
On July 28, 2025, the U.S. Department of Commerce imposed a $95 million administrative fine on Cadence. Simultaneously, the Department of Justice seized $45 million in forfeited funds, as the company pleaded guilty to a conspiracy to violate export controls.
The case centered on Cadence's Chinese subsidiary selling EDA hardware and software to a university on the Entity List between 2015 and 2021. The value of the goods involved was $45.305 million.
◎ The GAAP gross margin stood at 84.9%, a 0.7 percentage point decrease YoY.
◎ The Non-GAAP gross margin increased from 87.2% to 88.2%, with the two metrics moving in opposite directions during the same quarter.
The reason for this divergence lies in costs: product and maintenance costs rose by 25.8%, while service costs surged by 42.9%, both outpacing revenue growth. Hardware and services carry more weight than pure software.
◎ The GAAP operating margin was 28.4%, seemingly jumping by 9.4 percentage points. However, last year's quarter included a $128.5 million contingent liability loss from a settlement. Adjusting for this, last year's comparable GAAP operating margin was 29.0%, indicating a 0.6 percentage point decrease this year under the same metric.
The widening gap was driven by acquisition amortization: the added-back amount rose from $23.7 million to $79.92 million, accounting for 5.04% of revenue.
Segment disclosures only show proportions: Core EDA accounted for 68%, IP for 15%, and SDA for 17%. IP experienced the most striking YoY growth of over 40%, driven by PCIe, UCIe, HBM, LPDDR6 interface, and storage IP. Hardware sales hit a single-quarter record, adding 12 new clients, with inventory rising by 28.6% in six months to fulfill backlog orders.
Part 2: How Does the Regional Distribution Look?
◎ United States: $656 million, an 11% YoY increase.
◎ China: $236 million, a 95.7% YoY increase.
◎ Other Asia: $322 million, a 35.1% YoY increase.
◎ Europe, Middle East, and Africa: $243 million, a 21.5% YoY increase.
◎ Japan: $105 million, a 21.8% YoY increase.
Total quarterly growth amounted to $309 million.
◎ China contributed $115.5 million, accounting for 37%.
◎ United States: 21%.
◎ Other Asia: 27%.
China has emerged as the largest single-country market outside the United States, with a scale 2.3 times that of Japan. Asia's three segments combined reached $663 million, accounting for 41.8%, while the Americas totaled 42.8%, a difference of just 1 percentage point. Next quarter, Asia is set to surpass the Americas—a milestone never before achieved in Cadence's history.
Throughout the earnings call, management never proactively mentioned China. The only related comment came from the CEO just before providing guidance: "This outlook assumes existing export control regulations remain largely unchanged this year." The region contributing 37% of growth was only mentioned in four words: "assuming no change." This silence itself conveys information.
In comparison, the gap with Synopsys becomes apparent.
Synopsys reported quarterly revenue of $2.276 billion, a 41.9% YoY increase, with a non-GAAP operating margin of 39.5%, 6 percentage points lower than Cadence's.
In China, Synopsys generated $240 million, accounting for 10%, while Cadence generated $236 million, accounting for 15%, with nearly equal absolute amounts. Cadence's absolute revenue in China has caught up to the industry leader.
China serves as a growth engine but also as a looming threat.
Ranking Cadence's China share by quarter: 2025 Q1 11%, Q2 9%, Q3 18%, Q4 12%, 2026 Q1 13%, Q2 15%. This curve was shaped by policy, not the market.
In May 2025, the U.S. required three EDA firms to halt sales to China, only to revoke the order in July. Q2's 9% reflected the low point under restrictions, while Q3's 18% represented a high point from pent-up orders after the ban lifted. Only by Q2 this year did the figure return to a natural slope.
Statically, China accounts for 15% of revenue; dynamically, it contributes 37% of growth. If restrictions return, the loss would exceed just 15%—it would erase the entire growth trajectory.
Domestic EDA is catching up but hasn't reached the sign-off level.
◎ Empyrean generated revenue of RMB 1.325 billion in 2025, less than what Cadence earned in a single quarter in China.
◎ Cadence's quarterly R&D spending reached $531 million, 4.2 times Empyrean's annual R&D expenditure.
The gap lies in sign-off credibility, which is built over decades and tens of thousands of tape-outs—it cannot be bought, only earned through time.
Summary
I believe Cadence's strongest asset this quarter isn't the $8.1 billion backlog but the fact that it doubled China's revenue in a year of fluctuating regulations. The fine amount equaled just 60% of China's quarterly revenue—this math is more compelling than any AI narrative.
Throughout the earnings call, management never mentioned China, only brushing past it with "assuming no change" in the guidance—this growth trajectory was shaped by policy, not the market, leaving it precarious.
-
![]()
Can the Robot Phone Propel Honor to New Valuation Heights?
-
![]()
Dealer Service Operation Capability | Constructing Four "Consciousness Firewalls" for Proactive Negative Public Opinion Management
-
![]()
Lenovo is Back in the Spotlight, This Time with Its 'AI for All' Story
-
![]()
Two Rising Cloud Service Providers Abruptly Adjust Strategies in Computing Power Market
-
【Insight】High-Pressure Plastic Fuel Tanks Fit for Plug-in Hybrid Electric Vehicles See Expanding Market Space
-
![]()
Satellite Earth Observation Radar: From SAR to Intelligent Sensing with FPGA
-
![]()
SpaceX Releases First Financial Report: Revenue Doubles to $7.8 Billion, Musk Aims to Build a Computing Power Empire Rather Than Just a 'Rocket Company'
-
![]()
Token Economy in Global Expansion: Data Governance Must Be Robust