Interpretation of China's Auto Market in May: A Fig Leaf, Two Fault Zones, and Three Surprises
 06/22 2026
 455
455
The China Association of Automobile Manufacturers (CAAM) released data for May 2026 on June 10.
Many readers of our previous article, 'The Truth About China's Auto Market in April: Sales Dip 2.5%, Exports Surge 74%, Profit Margins Fall Below 3.5%,' messaged us privately, noting that the CAAM's official statement mentioned 'month-on-month growth and a slight year-on-year decline,' accompanied by a steady line graph that seemed positive.
They hoped we would analyze China's auto market in May based on CAAM data. So, what did the market look like in May?
01 / The 'Fig Leaf' Called 'Month-on-Month'
Let's start with the numbers:
Total auto sales in May: 2.629 million units, +4.1% MoM, -2.1% YoY.
Sounds good, right? But the +4.1% MoM growth is compared to April 2026—a low base month suppressed by the May Day holiday and restocking season. This is a seasonal pattern in the auto industry and not something to celebrate.
The real signal lies elsewhere: Domestic sales were 1.7 million units, -20.4% YoY.
Last month (April), this figure was -21.6%; this month, it improved by 1.2 percentage points. But the improvement wasn't due to a rebound in domestic demand—it was because exports continued to prop up the total. Subtracting 930,000 exported units from the total sales of 2.629 million leaves only about 1.7 million units for domestic consumption—a year-on-year decline that has remained in double digits for five consecutive months. 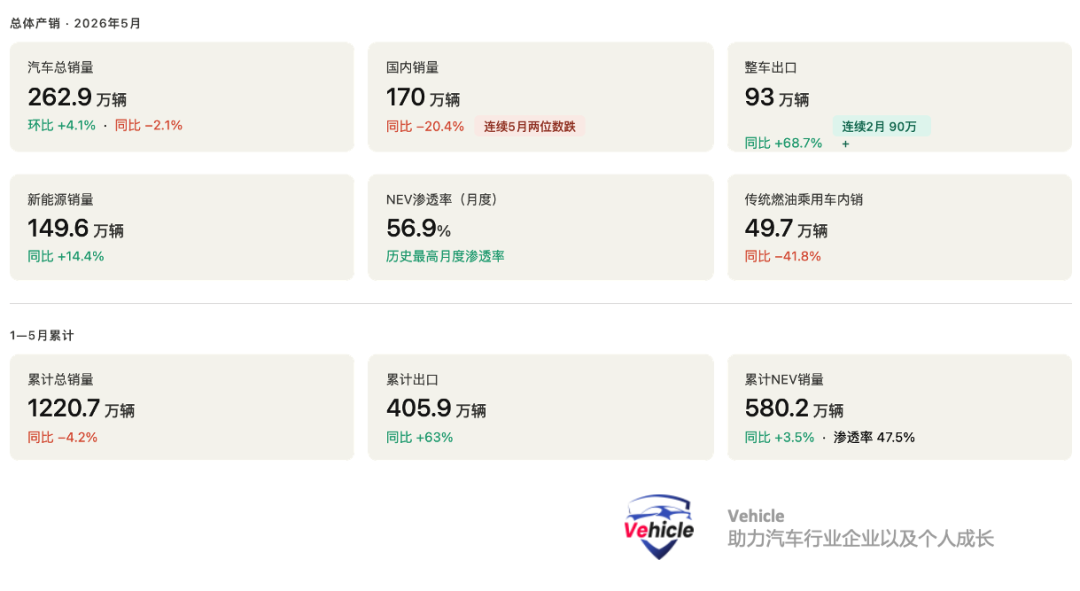
Jan-May cumulative: Production and sales were 12.235/12.207 million units, -4.6%/ -4.2% YoY. The decline 'narrowed' compared to the first four months but remained negative.
One number left a deeper impression: Domestic sales of traditional fuel passenger vehicles fell 41.8% YoY in May.
Not 4%, not 14%, but 41.8%. This means that for every 10 fuel-powered passenger vehicles sold last year, fewer than 6 were sold this year. This isn't a 'decline'—it's a 'collapse of fuel vehicles.' Cumulative Jan-May sales fell 28%, nearly halving in a year.
02 / 930,000 Exports: Two Consecutive Months Above 900,000, but Don't Applaud Too Soon
Auto exports in May: 930,000 units, +68.7% YoY, +3.1% MoM, marking a second consecutive month above 900,000 units. Jan-May cumulative exports: 4.059 million units, +63% YoY.
This is an unprecedented export volume for China's auto industry. Exporting 8 million units this year should be feasible.
But let's pause and do the math:
Total sales of 2.629 million units - 930,000 exports = 1.7 million domestic units. Exports now account for 35.4% of total sales. In other words, for every three vehicles sold in China's auto industry today, more than one is exported. This isn't globalization—it's a strategic hedge against shrinking domestic demand.
The record-high export dependency also means that any policy tightening in target markets (e.g., Europe's tax hikes and industrial bills, as discussed in previous articles, and now the UK considering similar measures) will hit domestic capacity utilization and factory cash flow more directly than before. 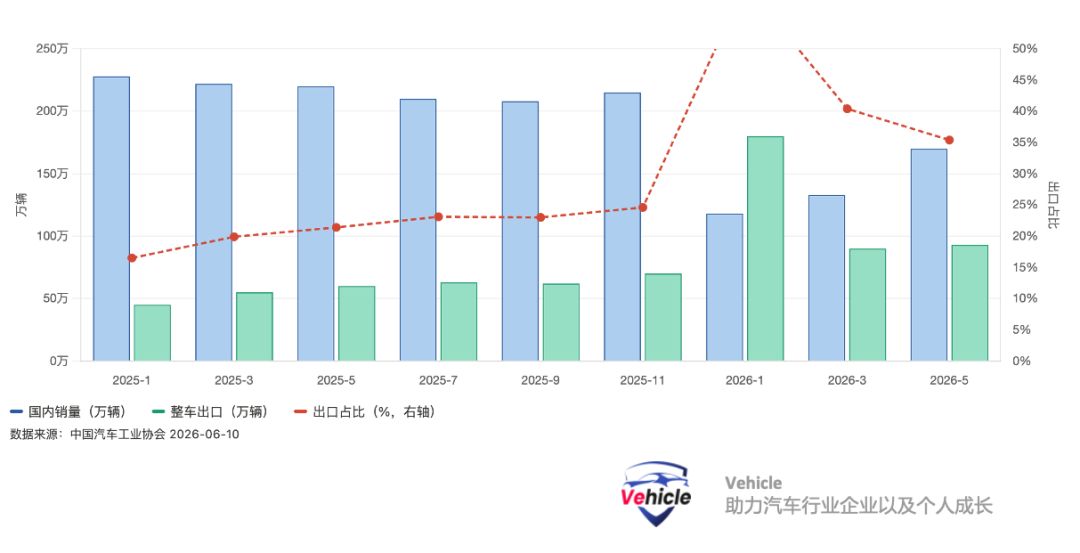
The export structure is also worth exploring:
NEV exports: 446,000 units, +110% YoY, accounting for 47.9% of total exports. Nearly half of all exported vehicles are now NEVs—unthinkable three years ago.
Plug-in hybrid export growth (+139.6%) has surpassed battery electric export growth (+94.3%). While BEVs were once the export mainstay, PHEVs are catching up—a reflection of inadequate charging infrastructure in target countries, a replication of Chinese automakers' strategy to 'solve range anxiety with extended-range/plug-in hybrids,' and loopholes in target markets' tax and policy frameworks.
Commercial vehicle exports: 120,000 units, +44% YoY. Often overlooked, this segment is becoming the second leg of export growth, with truck exports up 49% YoY.
03 / 56.9% Penetration Rate: A Record High, But Half 'Propped Up by Exports'
NEV sales in May: 1.496 million units, with an NEV penetration rate of 56.9%—the highest monthly figure on record.
But behind the 56.9% lies a troubling breakdown: Domestic NEV sales were 1.049 million units, -4.1% YoY.
You read that right. The NEV penetration rate hit a record high, but domestic NEV sales declined year-on-year. This means the rise in penetration wasn't driven by accelerated domestic consumption but by a faster collapse in domestic sales of traditional fuel vehicles—the denominator is shrinking.
Jan-May domestic NEV sales: 3.97 million units, -16.5% YoY. Domestic NEV consumption is shrinking.
The real growth is in NEV exports: Jan-May exports: 1.833 million units, +114.4% YoY. Exports are propping up overall NEV sales growth. 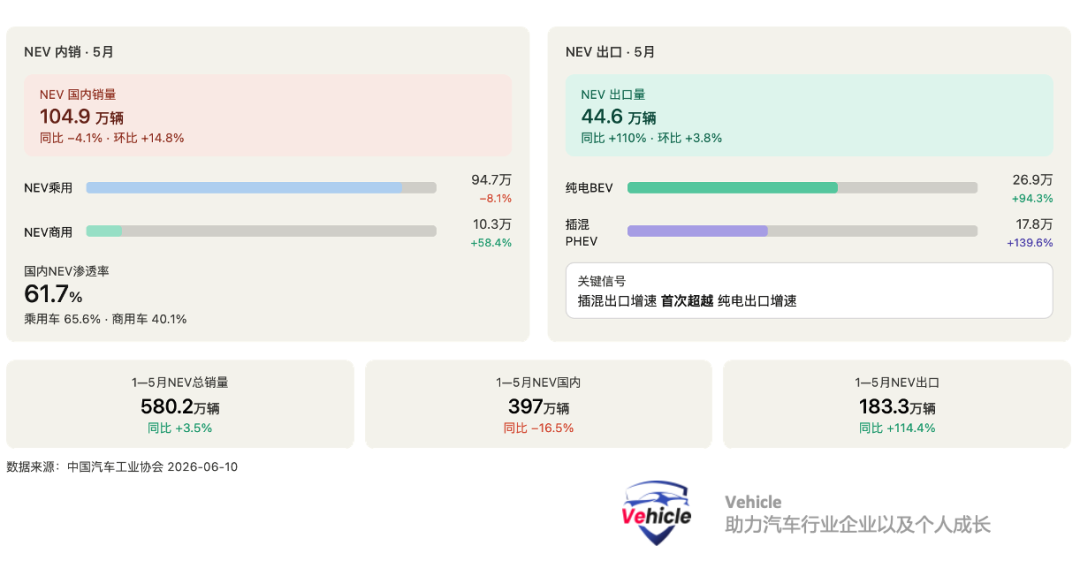
Another detail worth noting: Domestic sales of plug-in hybrids (PHEVs, including extended-range models) fell 4.6% YoY in Jan-May, while battery electric vehicles (BEVs) rose 8.1% YoY. This contradicts the narrative of an 'extended-range boom.' The likely reasons: Extended-range/plug-in hybrids have penetrated markets previously dominated by traditional fuel vehicles, but high-end extended-range consumers (300,000+ yuan) remain hesitant, while BEV competitiveness is improving in the mid-size market (100,000–250,000 yuan).
04 / What Has BYD 'Lost'?
In the Jan-May automaker sales rankings, one number sparked industry-wide discussion:
BYD's Jan-May sales: 1.405 million units, -20.3% YoY.
Against a backdrop of 3.5% overall NEV growth, the industry leader in NEVs saw a 20% decline.
The reasons are multifaceted: High base effects from BYD's first-quarter sales push last year; this year's price war hitting its lower-priced segments; and some consumers waiting for 2026 models. Regardless of the reasons, the fact remains: BYD's absolute sales volume is contracting.
Meanwhile:
Geely: 1.395 million units, +3.1% YoY—closing in on BYD, just 10,000 units behind.
Chery: 1.1 million units, +7.4% YoY—exports were the biggest contributor (749,000 units exported in Jan-May, 68% of total sales). Nearly 7 out of every 10 Chery vehicles are sold abroad.
Leapmotor: 263,000 units, +51.5% YoY—the largest growth among new forces, now included in FAW Group's data.
NIO: 151,000 units, +68.7% YoY—a significant recovery, with the Leapdao series gaining traction in the 150,000–200,000 yuan segment. 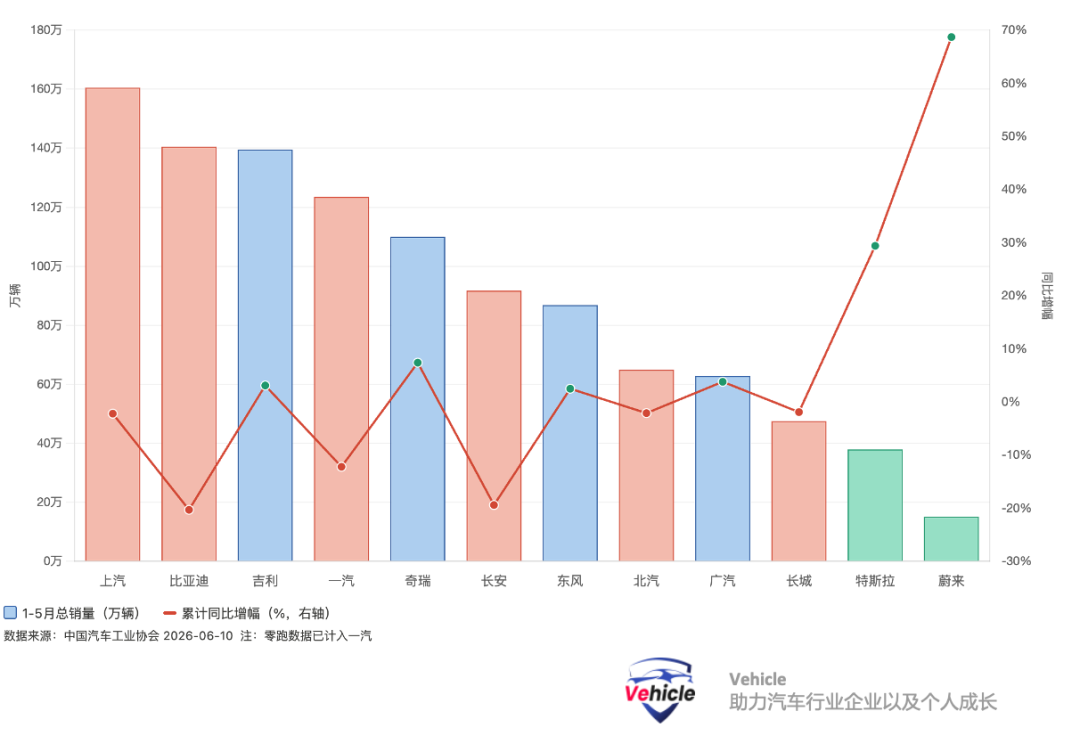
The NEV enterprise rankings also reveal a new landscape unseen before 2025:
GAC NEV: +62.6% YoY—Aion series relaunching.
Dongfeng NEV: +35.9% YoY—breakthroughs in Voyah and Mengshi lines.
SAIC NEV: +13% YoY—IM and Feifan stabilizing.
Among the former 'NIO-XPeng-Li Auto' trio: NIO (+68.7% YoY) is recovering, Li Auto (-3% YoY) is stagnating, and XPeng (-22.6% YoY) is declining. The pattern (competitive landscape) has been completely reshuffled.
05 / Commercial Vehicles: The Only True 'Domestic Bright Spot' in This Industry
While passenger vehicle domestic sales collapse, commercial vehicles are a rare positive.
Domestic commercial vehicle sales in May: 256,000 units, +2% YoY. Jan-May: 1.357 million units, +1.1% YoY.
Not huge, but positive.
More noteworthy is the structural breakdown:
Heavy-duty trucks: +23.3% YoY in Jan-May; medium-duty trucks: +24.2% YoY. These categories are barometers for infrastructure and logistics, and their sustained growth suggests manufacturing and infrastructure investment are still providing support.
Natural gas commercial vehicles: 123,000 units in Jan-May, +21.2% YoY. Energy substitution is no longer a topic of debate in the commercial vehicle sector—it's a done deal.
Commercial vehicle exports: 532,000 units in Jan-May, +29.5% YoY—slower growth than passenger vehicle exports (+69.6% YoY) but still accumulating in absolute terms. Truck exports rose 31.4% YoY, driven by sustained infrastructure demand in countries along the 'Belt and Road.'
06 / The 75% Figure Matters More Than You Think
In May, Chinese brand passenger vehicles accounted for 75% of sales—up 6 percentage points YoY, a record high.
Jan-May cumulative share: 71%, up 2.2 percentage points YoY.
Correspondingly, foreign brands are collapsing: German brands: 10.4%; Japanese: 8.7%; U.S.: 7%; Korean: 1.6%.
But a sober (sobering) point: Domestic consumption isn't that strong within this 75%—Chinese brand passenger vehicle sales totaled 7.326 million units in Jan-May, -3.1% YoY, also negative. The 75% share is largely due to joint-venture brands collapsing faster, not explosive growth in domestic brands. 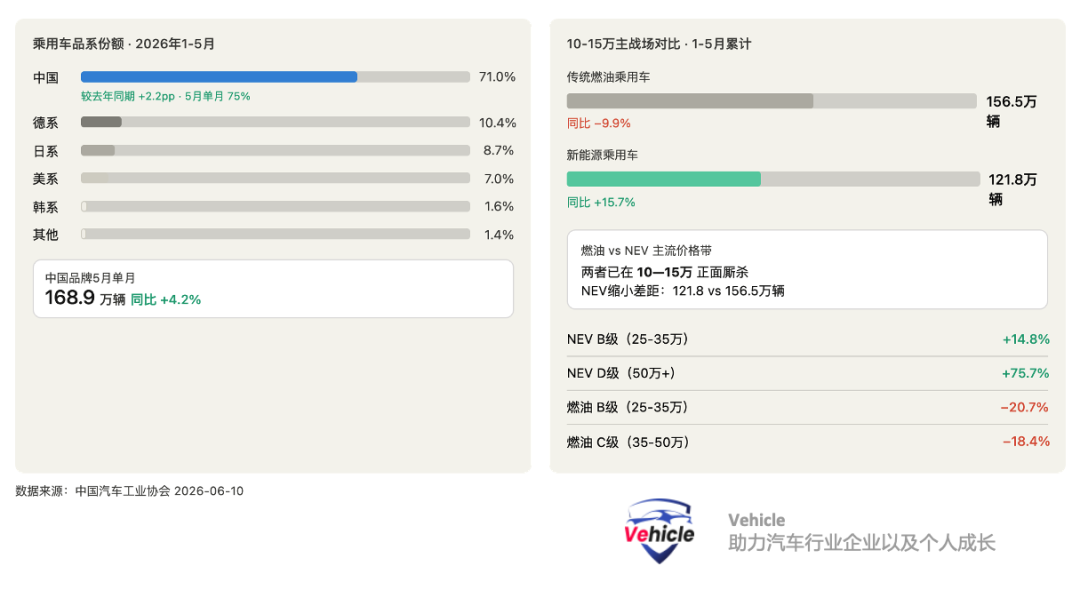
Market share ≠ absolute growth. This is easily confused.
Price bands offer another layer of insight: The most concentrated sales segment for traditional fuel passenger vehicles is 100,000–150,000 yuan (1.565 million units), -9.9% YoY. For NEV passenger vehicles, it's also 100,000–150,000 yuan (1.218 million units), +15.7% YoY.
The two are now competing head-on in the same price band. For every fuel vehicle lost, roughly half is replaced by an NEV, while the other half represents vanished true demand.
07 / Five Numbers to Watch in the Second Half
NEV penetration rate: 56.9%. This isn't just another penetration figure. It means more than one in every two vehicles sold in China is now new energy. The dominance of fuel vehicles in China's home market officially ended in May 2026. In the second half, this figure will likely surpass 60%, at which point pricing power, discourse power, and supply chain priority will shift decisively toward the electrification camp.
Exports: 930,000 units. May's single-month export volume hit a record high, surging 68.7% YoY. More importantly, this isn't just a few months of Pulse type (pulsed) growth—exports averaged nearly 800,000 units per month from January to May. China's auto globalization isn't an 'opportunity'—it's a structural reality already underway. In the second half, as orders from Southeast Asia, the Middle East, and Latin America continue to surge, exports may become the last line of defense preventing a collapse in industry-wide sales.
Domestic sales: -20.4% YoY. The year-on-year decline in domestic sales exceeds 20%—a staggering figure. Behind it lies weak consumer confidence, depleted replacement demand, and wait-and-see sentiment fueled by price wars. Without strong stimulus policies in the second half, the domestic market will struggle to stabilize. Only those who can defend their share in this shrinking pie will survive.
BYD's decline: -20.3% YoY. BYD's cumulative Jan-May sales decline is starkly at odds with its status as industry leader. This number signals that even the largest, most diversified, and lowest-cost player isn't immune. Whether BYD can stabilize in the second half will be a bellwether for industry confidence—its trajectory will, in many ways, mirror China's NEV market in the second half.
Leapmotor's growth: +51.5% YoY. Leapmotor's Jan-May growth, alongside NIO's +68.7%, outlines the rise of second-tier new forces. Traditional giants are slipping, while new players are taking their place. This reshuffling is far from over. In the second half, finding a survival niche between the 'price floor' and 'brand ceiling' will determine the basic structure of China's auto industry for the next five years.
08 / Conclusion: 930,000 Exports Are a Miracle—and a Dependency
May's data can be summed up in four words: internal woes, external expansion.
Domestic consumption is structurally shrinking—not just for fuel vehicles but even for NEVs domestically. The traditional fuel vehicle distribution system is collapsing. Big brands (BYD, Changan, FAW) are bleeding, while mid-tier players (Chery, Geely) and dark horses (Leapmotor, NIO) are fighting for territory.
Exports are expanding at an unprecedented pace—900,000+ units per month, 35% of total sales, with NEV exports doubling. These two trends define China's auto industry in 2026: an industry with exceptional overseas capabilities but narrowing domestic support. The 930,000 exports prove China's auto manufacturing prowess, but they also reflect the unsolved challenge of domestic auto consumption.
When exports are the only growth area, that growth must be rock-solid. And it's far from stable enough to rest easy—different markets require different strategies.
References and Images
CAAM's 'China Automotive Industry Production and Sales Report, June 2026' PDF.
*Unauthorized reproduction or excerpting strictly prohibited-
-
![]()
"Current gasoline vehicles are akin to horse-drawn carriages of yesteryear."
-
![]()
Gasoline Vehicles Wait for Electric Vehicles to 'Stumble', Electric Vehicles Anticipate Gasoline Vehicles to 'Decline'
-
Entire 330-Kilometer Area Fully Unveiled! Hengqin Set to Eliminate Safety Officers and Steering Wheels Next Week, Ushering in China’s First Fully Autonomous City
-
![]()
New Energy Vehicle Order Rankings: Insights Revealed
-
![]()
China Invests Nearly 200 Billion Yuan This Year to Boost Car Sales
-
![]()
Oil Prices Revert to 7-Yuan Range: Are Gasoline Cars Getting a Reprieve?
-
![]()
Momenta Secures CSRC Approval: Is It Poised to Be the 'Pioneer in Physical AI Stocks'?
-
![]()
What's the Use of Having a General-Purpose Motion 'Cerebellum' for Humanoid Robots?