New Energy Vehicle Order Rankings: Insights Revealed
 06/22 2026
 425
425

Lead
Introduction
Order volumes act as a beacon for sales, while sales volumes, in turn, refine and validate the orders.
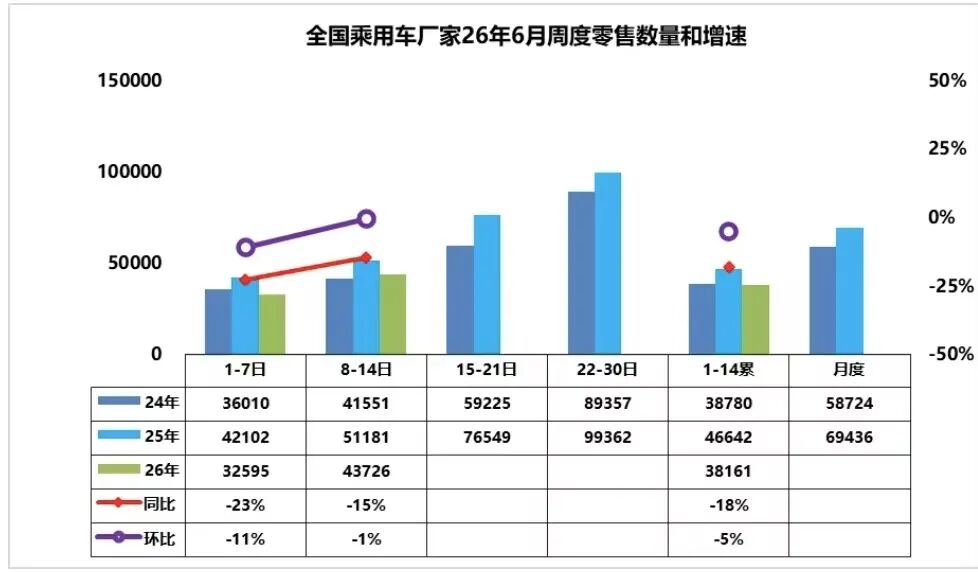
In the second week of June, the automotive market experienced another downturn, with a '15% year-on-year decline'.
According to data from the China Passenger Car Association (CPCA), from June 8-14, the average daily sales volume of major manufacturers in the passenger car retail market was 43,726 units, marking a 15% decrease year-on-year. Consequently, the first half of the month concluded with an 18% decline compared to the previous year.
The greater the pressure on performance, the more eager the industry becomes to access data swiftly.
Even after the ban on weekly data rankings last year, anticipation for the CPCA's weekly reports remains high. The performance evaluation period, once confined to monthly cycles, now necessitates weekly breakdowns, requiring professionals to seek reassurance four to five times more frequently. Good performance is akin to landing in a golden nest, while poor performance feels like being cast into an oven.
Goldman Sachs and Thinkercars offer an alternative perspective on corporate performance through order volumes, which include both weekly and monthly data.
Despite skepticism, such as concerns over 'Longjing's firm orders,' we can discern a reasonable logic by analyzing, sorting, organizing, and streamlining the fluctuations in order data and sales curves.
Order volumes serve as a beacon for sales, offering a forward-looking view; sales volumes, in turn, act as a whetstone, verifying the authenticity of orders.
However, due to the time lag between orders and deliveries, as well as varying production capacities and delivery rhythms among manufacturers, there is no absolute standard for the delay between order volumes and their reflection in terminal sales volumes.
Nevertheless, having an additional lens to estimate market and corporate performance is beneficial for observers.
01 Order Volume: A Precursor to Sales Volume
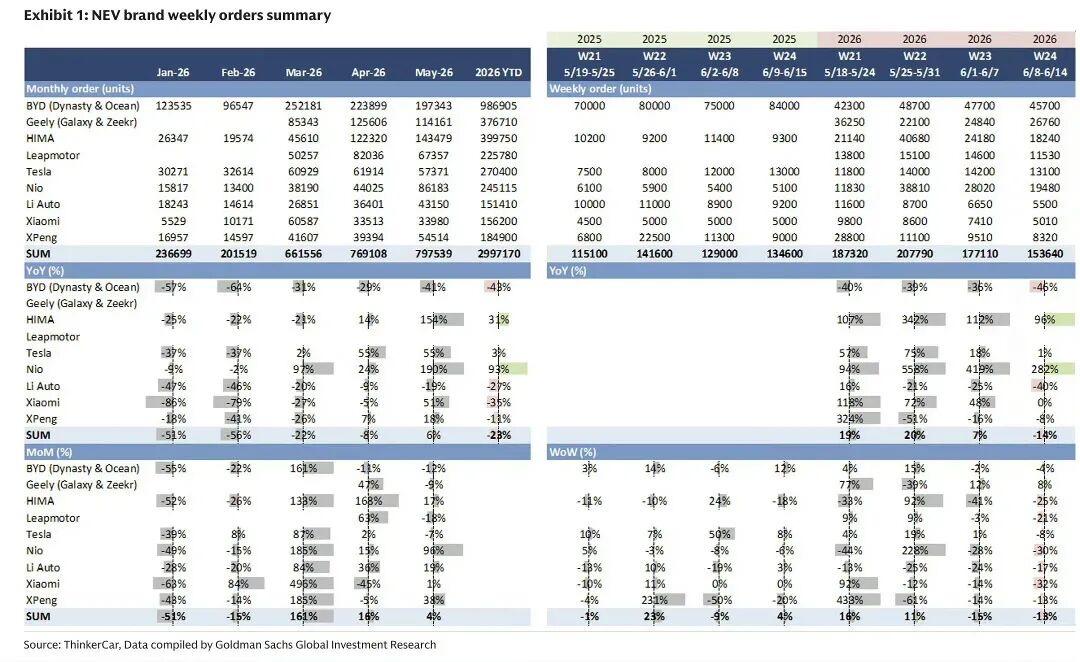
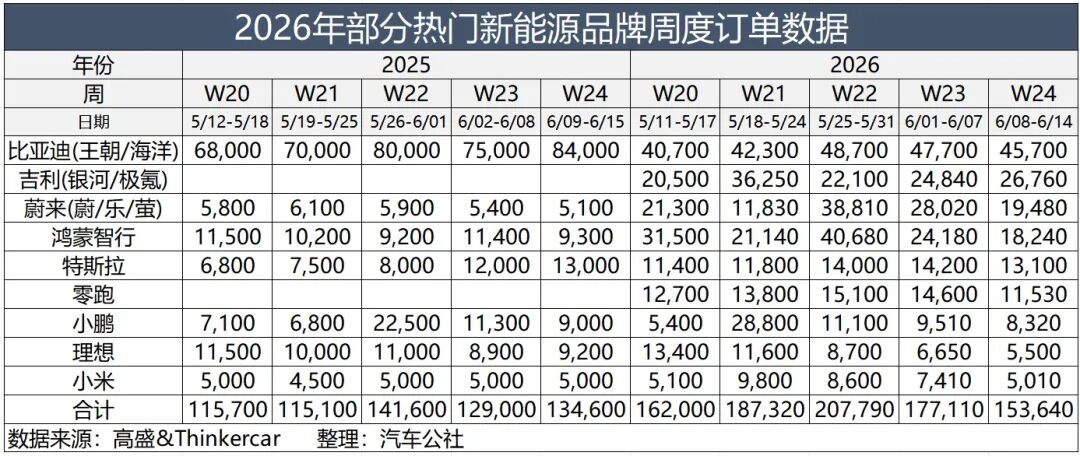
From June 8 to 14, 2026, Goldman Sachs released the latest weekly order volumes for some popular new energy brands, totaling 153,600 units, down approximately 14% year-on-year.
This is not a promising sign. Although the 15% year-on-year decline in passenger car retail sales volume in the second week is close, it includes the collapse of fuel vehicle sales due to high fuel prices.
According to CPCA data, from June 1-7, new energy vehicle retail sales volume was 152,000 units, down 14% year-on-year; from June 1-14, it was 341,000 units, down 8% year-on-year. Thus, from June 8-14, new energy vehicle retail sales volume was 189,000 units, down approximately 3% year-on-year.
In other words, in the second week of June, new energy vehicle retail sales volume is nearing a bottom and may rebound soon.
However, if order volume is down 14% year-on-year, it could lead to a situation where, in some week in the coming months, the year-on-year decline in new energy vehicle sales volume expands again to around 14%.
But this is just a theoretical calculation. After all, order volume fluctuations are less stable than sales volume, and new car launches significantly contribute to order volume increases.
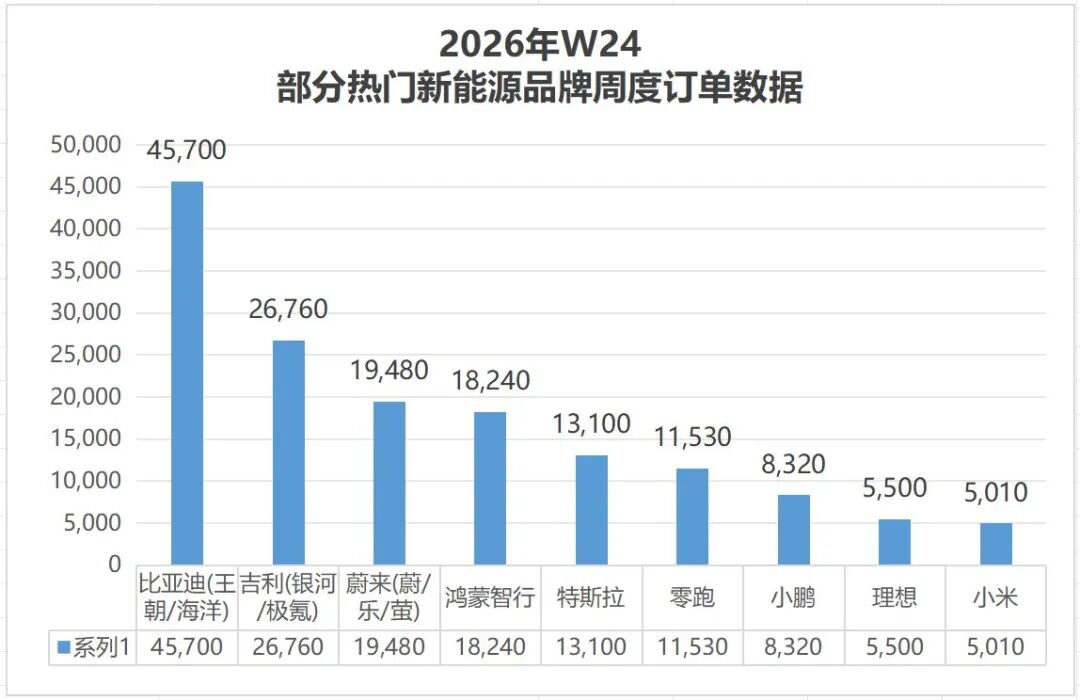
According to order volume data, from June 8 to 14, among several popular new energy brands, BYD (Wangchao + Ocean) had the highest order volume, leading with 45,700 units.
Obviously, this is not BYD's peak performance, as the launch of the Datang model on June 17 received excellent order feedback, and it is expected that BYD will see a surge in order volume in the 25th week from June 15 to 21.
Geely (Galaxy, Zeekr, Lynk & Co) ranked second with 26,760 units. NIO (NIO, Leapmotor, Firefly), which has consistently performed well, received 19,480 orders, surpassing Harmony Intelligent Mobility Alliance (18,240 units) and Tesla (13,100 units), which have long outperformed it in sales volume.
Since Harmony Intelligent Mobility Alliance had outstanding performance in previous weeks, even approaching BYD in the 22nd week with over 40,000 units, it is normal for its momentum to recede now. Tesla, on the other hand, has seen a decline in competitiveness in the domestic market due to product aging, with both order volume and sales volume performing poorly.
Leapmotor became the 'guardian' of the 10,000-unit threshold with 11,530 units. XPeng, Li Auto, and Xiaomi had 8,320, 5,500, and 5,010 units, respectively.
This week, the main declines in new energy orders came from BYD, Li Auto, and XPeng, while increases came from NIO and Harmony Intelligent Mobility Alliance. It should be noted that a decline in orders does not necessarily mean poor sales; it could simply be due to the absence of new car launches.
This relates to the reliability of Goldman Sachs' order data—the logic of new car launches' contribution to orders and subsequent sales volume verification.
02 New Car Launch Roller Coaster
Unlike the firm order data announced by companies themselves, Goldman Sachs' order volume data undergoes third-party verification and de-watering processing.
What seems counterintuitive can often be explained.
Some may be surprised that Leapmotor, which has broken through 80,000 monthly sales volume, has lower order volume than NIO and Harmony Intelligent Mobility Alliance. This is because 80,000 units include export sales volume. For example, in May, Leapmotor's wholesale sales volume, including exports, reached 81,569 units, while domestic retail sales volume was 61,401 units, with weekly sales volume just over 10,000 units, aligning with order volume.
Order volume fluctuations are almost strongly correlated with new car launches.
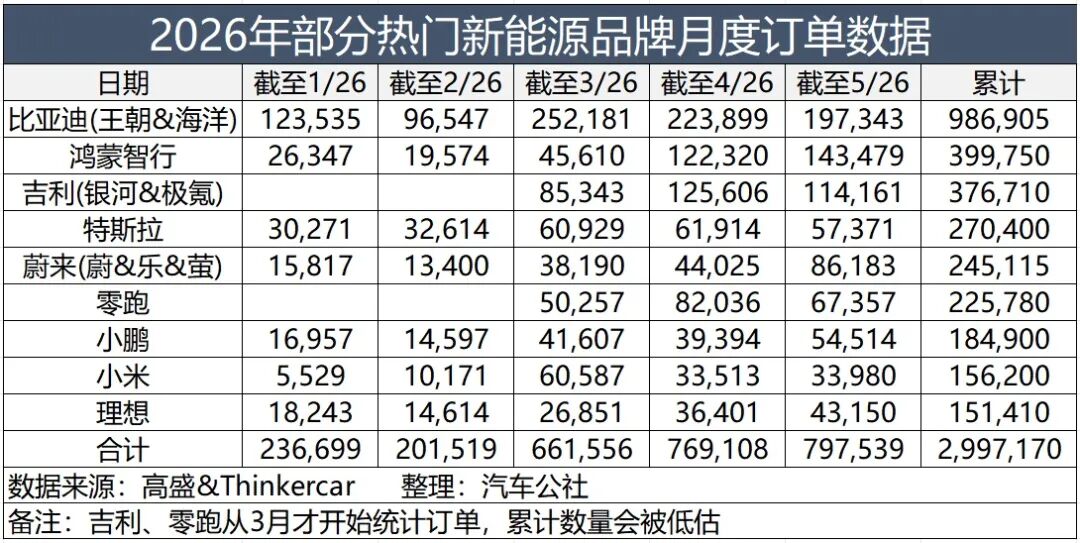
Observing monthly order volume, Xiaomi reached a peak of 60,000 units in March due to the launch of the SU7 on March 19.
Harmony Intelligent Mobility Alliance exceeded 100,000 orders in April and May, launching the Aito M9 Ultimate and Shangjie Z7/7T at its Spring New Product Launch on April 22, and the new Aito M9 in May, which explains why it broke 40,000 units in a single week in the 22nd week, approaching BYD.
Similarly, NIO reached its order peak in the 22nd week, closely tied to the launch of the ES9, with 38,800 orders far exceeding its usual level.
Despite poor pre-sale feedback, the formal launch of the XPeng GX at an astonishing price led to a surge in orders to 28,800 units in the 21st week.
Thus, brands with poor order performance are often associated with insufficient appeal of their main models.
Tesla, with its aging products, is a typical example. As perceptions of 'low configuration and lack of supercharging due to the 400V platform' become widespread, Tesla's advantages in handling are no longer sufficient to offset the disadvantage of being a 'barebones' vehicle.
Xiaomi SU7's order volume performance is worse than the previous generation, which will also be reflected in subsequent sales volume dimensions, making the urgency for the sub-brand Xuntian more prominent.
03 Is the Pure Electric Momentum Stronger?
Automotive Commune made some forward-looking predictions this year, including the 'Pure Electric Era' and the 'Price Increase Era.'
With more pure electric models entering the mainstream price range of 100,000-250,000 yuan, or dual-power models like the Shenlan S05, which is primarily pure electric, we can already conclude that the automotive industry has truly entered the pure electric era. Of course, the recent price increases for intelligent driving systems and the rise in average vehicle prices also confirm the rationality of the 'Price Increase Era.'
In the order volume data, we can also faintly see the stronger momentum of pure electric vehicles.
First, the largest increase comes from NIO, which insists on pure electric models. In the 24th week, NIO's order volume year-on-year increase was as high as 282%, and its cumulative order volume growth rate for the year reached 93%.
Although Harmony Intelligent Mobility Alliance's sales volume has not fully 'awakened' this year, related to the popularization of 896-line LiDAR and the rhythm of new car launches, considering that the main contributors to order growth, Shangjie, currently only offers pure electric models, and the proportion of pure electric models in Aito's new cars is higher than before (the Aito M8 has a higher proportion of pure electric models than the M9, and the new M7 has a higher proportion of pure electric models than the previous generation), it also reflects the contribution of pure electric models to orders and sales volume.
Similarly, although Goldman Sachs does not directly provide the proportion of pure electric orders for BYD, through offline research, most of the new orders for the Ocean Network are for pure electric models.
Within the BYD Group, the Fangchengbao Titan series also has an absolutely overwhelming proportion of pure electric models in new car orders.
Of course, pure electric models are not a panacea. Tesla, which only offers pure electric models, has not updated its products in a timely manner, while Xiaomi relies on fan economy, making it difficult to sustain long-term growth. Ultimately, the automotive industry tests a company's comprehensive capabilities across a six-dimensional radar chart, including product strength, brand strength, channel strength, marketing strength, and price competitiveness.
Both the firm order data announced by companies and the order volume data provided by statistical agencies like Goldman Sachs offer another perspective to observe the market beyond sales volume.
For the current market situation, which is under pressure and anxious, perhaps having one more channel to understand the truth brings a bit more certainty to the heart.
Editor-in-Chief: Shi Jie Editor: He Zhengrong

THE END
-
![]()
Technology Sector's Meteoric Rise | Historic Transformation of A-Share Market Capitalization
-
Automotive Market News: New Energy Vehicles Set to Expand into Rural Areas by 2026!
-
![]()
Exorbitantly Bold! Liang Wenfeng Invests 20 Billion Yuan of His Own Funds and Imposes 'Dictatorial Terms'
-
![]()
FAW-Audi and SAIC-Audi Restructuring: One Maintains Profit from Gasoline Cars, the Other Stakes Future on Electric Vehicles
-
![]()
When Smart Grows Up, Will It Still Be Appealing?
-
![]()
Global Strategy Forum on Automotive Supply Chain Empowerment via Hong Kong's Global Reach Concludes Successfully
-
![]()
In-depth Report on the 2026 Hong Kong Auto Expo | China's Auto Industry Upgrading Systemic Competition in Global Expansion: How Can Hong Kong Empower It?
-
![]()
The decline of fuel vehicles is irreversible, and extended-range and plug-in hybrids may fare even worse