Real Thoughts of New Energy Vehicle Owners in Top 30 Cities by Car Ownership
 06/30 2026
 566
566
Analysys Insights: With the leapfrog growth of NEV ownership in China, the NEV owner demographic has expanded beyond early adopters to encompass diverse age groups and consumption tiers, creating multifaceted demands for public charging services. As public charging enters a new phase driven by both supply and demand, understanding user behavior patterns and addressing their core pain points has become critical for operators to gain a competitive edge. To accurately gauge current user needs, Analysys conducted an online survey across China's top 30 cities by NEV ownership. The survey covered first-tier cities such as Beijing, Shanghai, Guangzhou, and Shenzhen; new first-tier cities including Hangzhou, Chengdu, Zhengzhou, and Wuhan; as well as other cities like Wenzhou, Wuxi, and Xiamen. A total of 3,000 valid responses were collected, with 100 questionnaires distributed per city. The survey targeted owners who regularly use public charging stations and have utilized third-party public charging services within the past month.
I. User Profile: Middle-aged and Young Office Workers Dominate Consumption, Concentrated in Middle-to-High Income Brackets
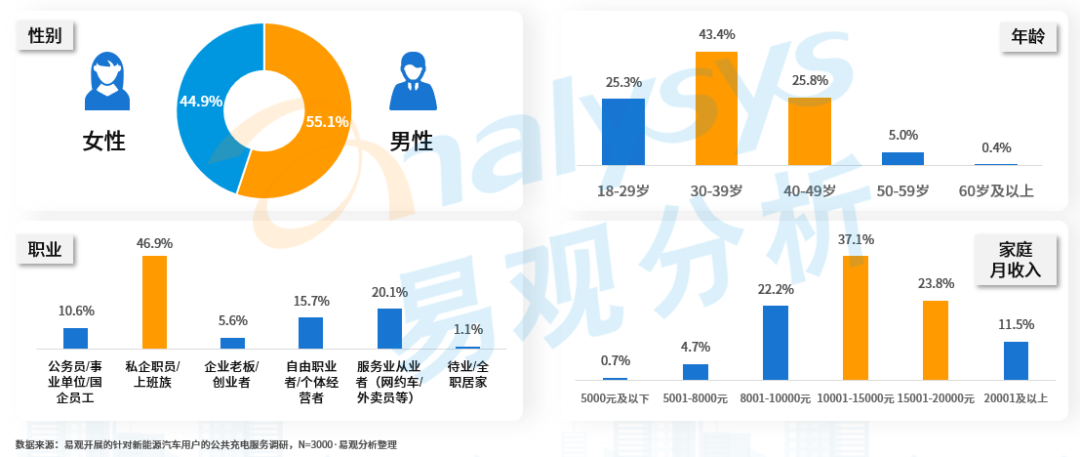
The primary users of public charging services exhibit highly concentrated demographic characteristics. In terms of gender distribution, male owners slightly outnumber female owners, accounting for 55.1% and 44.9%, respectively. Regarding age groups, the 30-39 age bracket (43.4%) and 40-49 age bracket (25.8%) represent the absolute core demographic, together comprising nearly 70% of users. Middle-aged and young groups constitute the main consumer force for public charging.
In terms of occupation and income, private sector employees and office workers account for the largest share at 46.9%, followed by service industry professionals (e.g., ride-hailing drivers, food delivery personnel) at 20.1%, freelancers or self-employed individuals at 15.7%, and civil servants, public institution employees, and state-owned enterprise staff at 10.6%. These groups' household monthly incomes predominantly fall within the RMB 10,001-15,000 (37.1%) and RMB 15,001-20,000 (23.8%) ranges.
II. Charging Habits: Frequent Fragmented Charging, Workplace and Residential Areas as Core Scenarios
Owners demonstrate fragmented and proximity-based charging behaviors. Those who frequently use public charging services average 1.87 charging sessions per week, with each session averaging 25.21 kWh. This indicates a preference for frequent, timely top-ups rather than waiting for complete battery depletion before large-scale charging.
In terms of preferred charging locations, stations near workplaces or companies rank first (40.2%), followed by those near residential areas (39.3%), and then those near shopping malls (20.5%). This requires operators to strategically plan charging stations within users' "commute-residence-consumption" daily life circles.
III. Brand Perception: Leading Operators Demonstrate Significant Advantages in Awareness and Recommendation
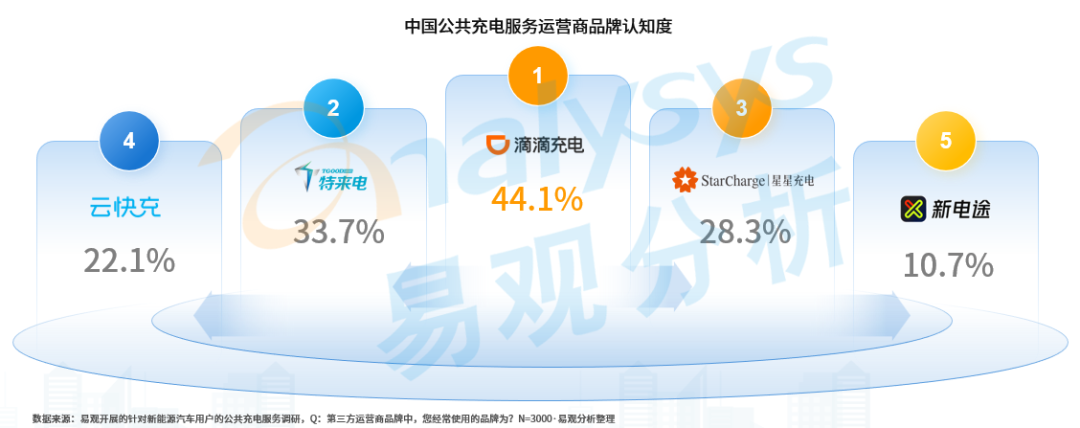
When faced with numerous third-party public charging brands in the market, users show strong concentration in brand awareness and recommendation. In terms of brand awareness, Didi Charging ranks first with a 44.1% regular usage rate, followed by Teld (33.7%), StarCharge (28.3%), YunKuaiChong (22.1%), and Xindiantu (10.7%) rounding out the top five.
Regarding user recommendation rates, Didi Charging leads with 33%, followed by Teld (20%), StarCharge (15%), YunKuaiChong (10%), Kaimai Si (4%), JingChong (4%), KuaiDian (4%), Xindiantu (3%), LvChongChong (3%), Weijing Yun (2%), and Wanma Aichong (1%).
IV. Satisfaction and Expectations: Speed and Price Remain Core Concerns, Service Details Require Improvement
The survey evaluated third-party charging operators across five dimensions: overall satisfaction, charging station coverage, charging experience, charging speed, and charging safety. Didi Charging ranked first with an overall satisfaction score of 17.21, excelling in charging experience (4.26), speed (4.30), and safety (4.41). Teld placed second with 16.98 points, particularly strong in station coverage (4.23). YunKuaiChong (16.91), StarCharge (16.90), and Xindiantu (16.66) rounded out the top five.
However, despite strong ratings for leading brands, users still identify multiple pain points and express clear improvement expectations. The top areas needing enhancement are charging speed (42%) and price reduction (42%) - indicating that shorter charging times and refined operations (e.g., membership/package cost controls) remain critical for improving user experience. Optimizing app user experience (41%) follows closely, as owners expect apps to help locate the most cost-effective charging stations and provide comprehensive surrounding service information. Additional concerns include improving charging station maintenance to reduce failure rates (40%), adding value-added services like restrooms and convenience stores (33%), expanding station coverage, especially in rural areas (28%), and enhancing customer service response times (13%).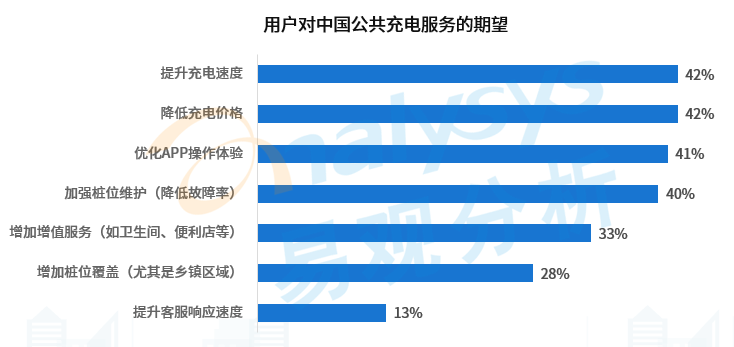
Overall, Chinese NEV owners' demands for public charging have evolved from basic "availability" to comprehensive experiences prioritizing "time efficiency, reliability, convenience, and affordability." Future winners will be those who first establish superior experiences in hardware responsiveness, refined operations, smart app interactions, and comprehensive station facilities, thereby securing high-value user groups in the mature market phase.
Research Methodology
The industry analysis provided by Analysys is based on macro industry data, quarterly end-user survey data, historical vendor data, and quarterly vendor business monitoring information. Using Analysys' proprietary industry analysis models combined with market research, industry research, and vendor research methodologies, the analysis primarily reflects current market conditions, trends, turning points, patterns, and vendor development statuses.
Analysys believes the data derived from these research methods accurately reflects industry trends and patterns within industry-accepted error margins.
The research findings obtained through professional methodologies are intended for decision-making reference. For actual vendor data, please refer to their official financial reports.
Copyright Notice
All third-party data and information cited by Analysys in this document are sourced from publicly available channels. Analysys assumes no liability for this information. Under no circumstances should this document serve as any form of basis - it is provided for reference only. All copyrights belong to the publisher. Without explicit authorization from Analysys, any reproduction, quotation, or use of Analysys' content in any manner is strictly prohibited. Authorized media, websites, or individuals must quote the original text in full and credit the source, with all analytical viewpoints subject to official Analysys releases. No deletions, additions, splicing, interpretations, or distortions of any form are permitted. Analysys disclaims all liability for disputes arising from improper use and reserves the right to pursue legal responsibilities against responsible parties.
-
![]()
Shenzhen’s Most Mysterious Robot Startup Secures 1 Billion Yuan in Funding, Targeting a 150 Billion Yuan Market
-
![]()
Why Are Celebrities So Keen on Diving into the AI Realm?
-
Can WeChat AI Sidestep the Quandary Faced by Doubao Phone?
-
![]()
Luxury Lineup, Highly Anticipated! The Pioneer of Physical AI Gears Up for Hong Kong Stock Exchange Debut!
-
![]()
Mercedes-Benz Withholds Year-End Bonuses for 90,000 Staff: Germany's Industry 4.0 Aspirations in Tatters
-
![]()
Can the Hong Kong Stock Market Pay for World Models? Dissecting Momenta's Prospectus
-
![]()
Set for Secondary Listing in Hong Kong with Market Cap Exceeding 500 Billion: How Luxshare Precision Regains Investor Trust?
-
![]()
Approaching its Secondary Listing in Hong Kong with a Market Cap Exceeding 500 Billion: How Has Luxshare Precision Regained Investor Trust?