The Most Absurd Semi-Annual Report: Revenue Surges 20%, Yet Most Automakers Aren't Actually Making Money
 08/26 2026
 421
421
Author | Shuyan Learn More Financial Information | BT Finance Data Pass The main text is 2,370 words, with an estimated reading time of 9 minutes.
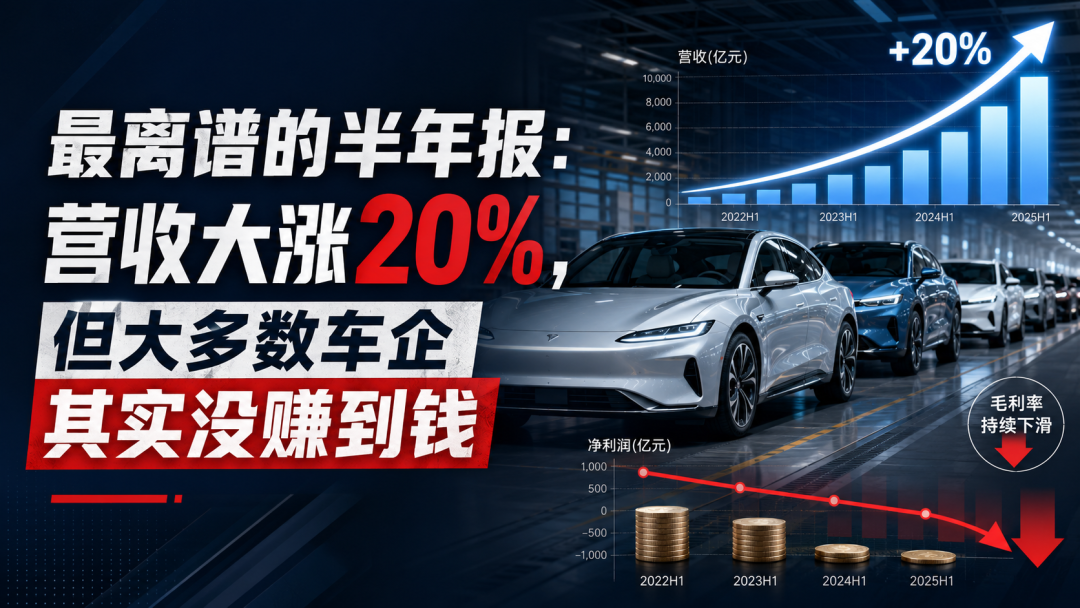
The automotive industry's situation of 'revenue growth without profit growth' is easily mischaracterized in a single sentence. On August 20, 2026, the Economic Information Daily, based on statistics from iFinD, reported that as of 12:00 PM on August 19, 38 A-share listed companies in the automotive industry that had disclosed their 2026 semi-annual reports collectively reported revenue of 159.751 billion yuan, a year-on-year increase of 20.46%; however, their combined net profit attributable to shareholders was 13.778 billion yuan, a year-on-year decrease of 2.28% (Source: Economic Information Daily, iFinD, August 20, 2026).
On the surface, this appears to be a case of 'expanding scale but thinning profits.' However, when the 38 companies are analyzed separately, another set of numbers changes this perception: 32 companies experienced revenue growth, while 23 companies saw net profit growth (Source: Economic Information Daily, iFinD, August 20, 2026). In other words, the overall decline in total profits does not mean that most companies are earning less.
1. First, Look at the Total Discrepancy

Among the 38 companies, 84.21% experienced revenue growth, while 60.53% saw net profit growth. The overall figures of 'revenue up 20.46%, net profit down 2.28%' resemble a consolidated report influenced by companies of varying sizes (Source: Economic Information Daily, iFinD, August 20, 2026).
To minimize the impact of major asset restructurings on the sample, the Economic Information Daily further excluded Qingdao Doublestar and analyzed 37 companies: their combined revenue increased by 11.95% year-on-year, while their combined net profit attributable to shareholders decreased by 4.56% year-on-year, and their combined net profit excluding non-recurring items decreased by 3.64% year-on-year (Source: Economic Information Daily, iFinD, August 20, 2026).
This set of data still indicates 'revenue growth without profit growth,' but the truly informative aspect lies in the difference between the average and the median.
2. Top Performers Drive Up Revenue
Among these 37 companies, the overall revenue growth rate was 11.95%, but the median revenue growth rate was -8.74% (Source: Economic Information Daily, iFinD, August 20, 2026). One figure represents the industry's total performance weighted by company size, while the other more closely reflects companies in the middle of the sample.
In simpler terms, the faster expansion of a few larger companies can drive up the overall revenue growth rate; however, the negative median indicates that the revenue experience of 'typical companies' is not as hot as the 20.46% figure suggests. Focusing solely on the industry's total revenue can easily lead to the misconception that the growth of top companies represents the growth of all companies.
3. The Median Tells a More Interesting Story
The profit side presents a contrasting picture. After excluding companies undergoing major restructurings, the combined net profit of the 37 companies decreased by 4.56%, but the median net profit growth rate was +12.37%; their combined net profit excluding non-recurring items decreased by 3.64%, with a corresponding median growth rate of +8.20% (Source: Economic Information Daily, iFinD, August 20, 2026).
This indicates that the 'overall profit decline' cannot be simply interpreted as 'companies across the industry finding it harder to make money.' Profit fluctuations in a few large companies can drag down the total, while many companies in the middle of the sample are actually seeing improved profits.
Key Insight: When analyzing the automotive industry's semi-annual reports, it's essential to consider both 'totals' and 'medians.' Totals reveal how much the industry's scale has changed, while medians reflect the operating experience of typical companies. When these two point in opposite directions, the truly noteworthy aspect is where profits are being redistributed along the industry chain (Source: Economic Information Daily, iFinD, August 20, 2026).
4. Overseas Expansion Isn't a Simple Equation
Overseas business is one of the key variables driving this divergence. Among the 37 companies, 29 disclosed overseas revenue, totaling 32.673 billion yuan, a year-on-year increase of 15.42% (Source: Economic Information Daily, iFinD, August 20, 2026). Beyond scale growth, overseas business can also alter product mix and gross margins.
For example, Xinquan Automotive reported overseas revenue of 2.115 billion yuan in the first half of the year, a year-on-year increase of 43.34%; Rayhoo Mold reported export revenue of 310 million yuan, a year-on-year increase of 77.59%, with an export business gross margin of 39.58%, higher than the 21.88% margin for its domestic business (Source: Economic Information Daily, citing company semi-annual reports, August 20, 2026).
This does not mean that 'going overseas guarantees high margins.' Significant differences exist among companies in terms of regions, products, clients, and production capacity stages. What it does indicate is that automotive industry profits can no longer be explained solely by domestic sales volume or per-unit vehicle prices; the proportion of overseas revenue and product mix are becoming equally important variables.
5. Exchange Rates Can Rewrite Profits
Another often-overlooked factor is exchange rates. The Economic Information Daily, citing Fuyao Glass's semi-annual report, stated that the company's total profit decreased by 19.95% year-on-year, including a foreign exchange loss of 803 million yuan, compared to a foreign exchange gain of 602 million yuan in the same period last year; excluding the impact of foreign exchange gains and losses, total profit increased by 4.78% year-on-year (Source: Economic Information Daily, citing Fuyao Glass's semi-annual report, August 20, 2026).
Just because a company sells more products and improves operational efficiency does not guarantee a corresponding increase in the bottom line. The more overseas revenue a company generates, the more exchange rate fluctuations can amplify or offset operational improvements.
A Framework to Take Away: The Five Accounts of Automotive Profits: Scale Account - Look at revenue and sales volume → Structural Account - Look at high-margin products and overseas revenue proportion → Cost Account - Look at material and manufacturing efficiency → Expense Account - Look at R&D, sales, and integration costs → Exchange Rate Account - Look at overseas settlements. Only by examining all five accounts can you determine whether growth is truly translating into profits.
The sample of 38 companies suggests that the automotive industry is transitioning from 'simply competing on scale' to a stage where 'scale, structure, and efficiency jointly determine profit quality.' While price remains an important variable, attributing the 2.28% overall profit decline solely to price competition overlooks the differentiated impacts of top companies' scale, product mix, overseas revenue, cost efficiency, and exchange rates on different companies.
6. Why This Matters to You
First, for automotive consumers, industry revenue expansion does not equate to equally large price-cutting space for every brand. Differences in product mix, overseas business, and cost capabilities among companies mean that the product strength, services, and price space available to consumers will vary.
Second, for components suppliers and automotive industry professionals, order growth is just the first challenge. Client mix, overseas revenue proportion, scale effects, and exchange rate exposure will determine whether 'getting busier' translates into 'making more money.'
Third, for readers analyzing industry financial reports, averages and medians must be viewed in tandem. Totals tell you the size of the industry pie, while medians reveal the real experience of most companies; then, by breaking it down using the five accounts, you can avoid misinterpreting a single total figure as a uniform story for the entire industry.
As the automotive industry upgrades and improves, scale remains important, but it is no longer the sole metric of success. What truly matters is where profits ultimately end up after each vehicle or component set is sold. Turning scale into more stable and higher-quality operating results is the next challenge posed by these 38 semi-annual reports.
What are your thoughts on this? Feel free to share your opinions in the comments section.
This article is for information sharing and industry analysis only and does not constitute any investment advice, investment analysis opinions, or trading solicitations. The data in the article primarily comes from statistics by the Economic Information Daily based on iFinD and semi-annual reports of listed companies (August 20, 2026), with the original sources taking precedence. Markets carry risks, and decisions should be made cautiously. Content marked as 'inferences' represents logical deductions based on public information and does not represent official positions.
This article is an original piece by BT Finance and may not be used, reproduced, disseminated, or adapted without permission. Infringement will result in legal action.

The views expressed in this article are the author's own. If you have any questions or feedback, please feel free to leave a comment in the comments section. 
-
![]()
Strategic Emphasis on Digital Photonics Gains Momentum! Optical Behemoth Reports RMB 12.4 Billion in H1 Revenue
-
![]()
In-depth | Li Shufu's "Turn at the Peak": Why Did Geely Choose to Change Leadership at Its Prime?
-
![]()
Has Xiaomi Weathered Its Toughest Times?", "Xiaomi, Financial Report, Chips, Automobiles, AI
-
![]()
Has Xiaomi Ridden Out the Storm?
-
![]()
Why Are Children Better at Learning Languages Than AI? MIT TR: Large Models Need to Burn Down an Entire Forest, While Kids Only Need 100 Million Words
-
![]()
Workplace Transformations Amidst AI Influence: Ensnared in Involution, Yet Struggling to Discover Work’s True Value
-
![]()
The Most Absurd Semi-Annual Report: Revenue Surges 20%, Yet Most Automakers Aren't Actually Making Money
-
![]()
The Dazzling Yet Impractical Internet-Famous Smart Driving Features