The Comprehensive Guide to Tariffs on Chinese Automobile Exports: A Stark Contrast to Japan
 10/12 2026
 517
517
The recent announcement that the UK is considering imposing tariffs on Chinese electric vehicles (as detailed in the article "UK Mulls EU-Level Tariffs on Chinese Electric Vehicles") has once again ignited fervent discussions within China's automotive export sector.
Several acquaintances have posed the same query to me: What is the tax burden for Chinese cars sold overseas?
Online information is fragmented, with percentages ranging from 100% in some instances to 45% in others, making it challenging to piece together a comprehensive overview.
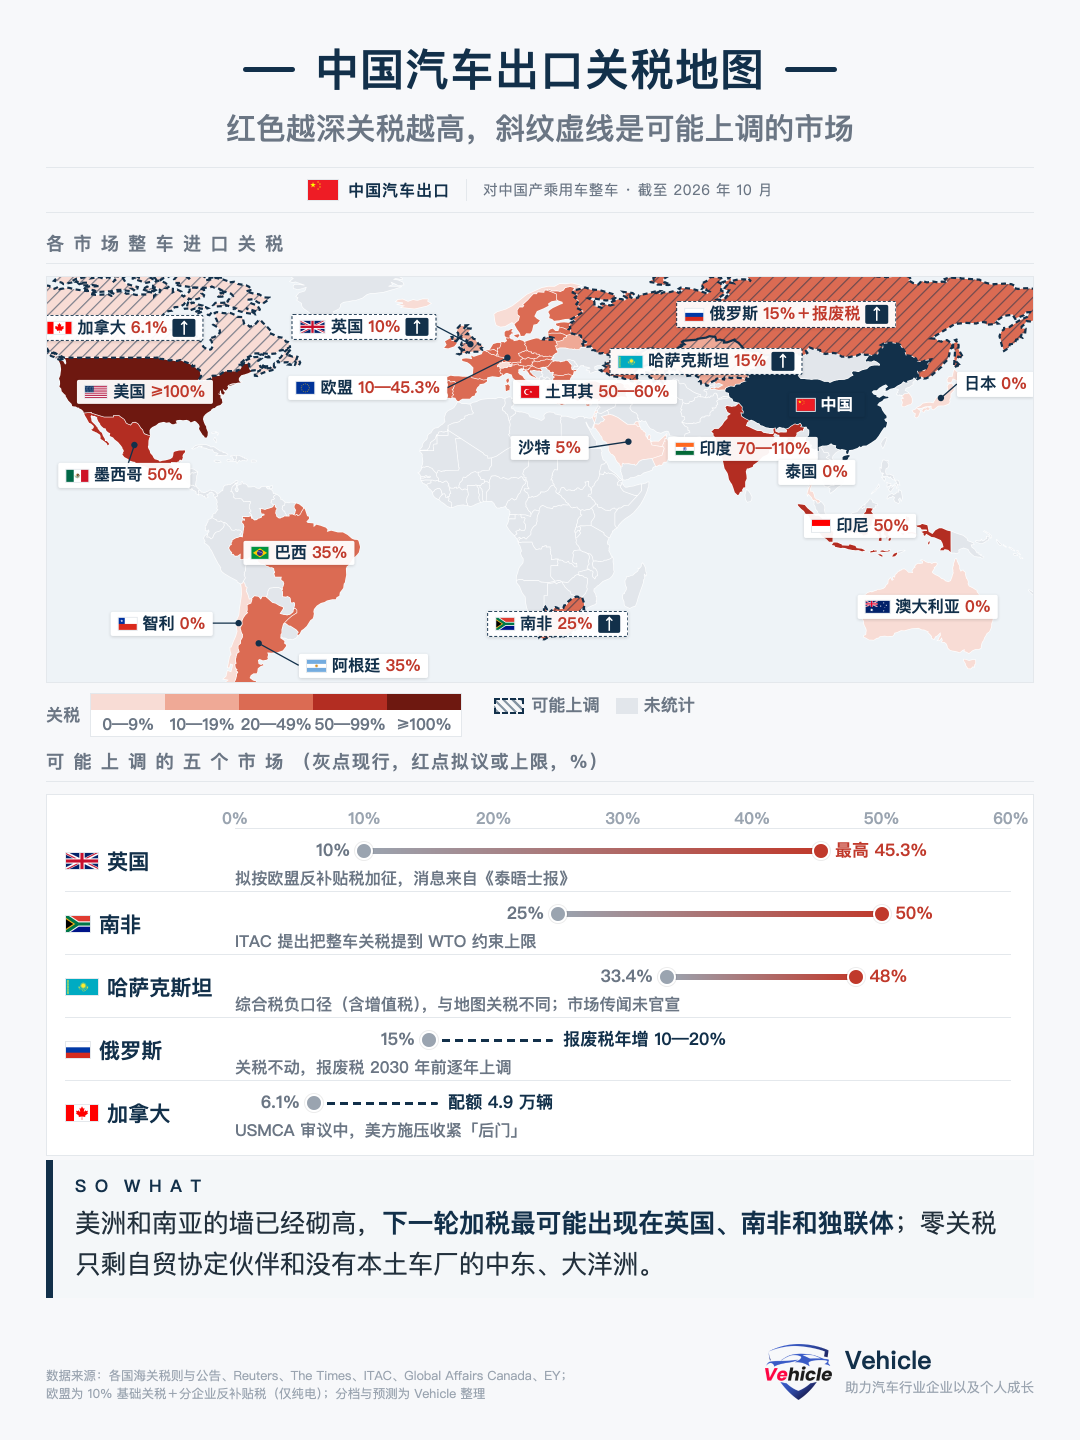
Consequently, I have reviewed tax regulations and announcements from various nations and crafted a map illustrating import tariffs for passenger vehicles manufactured in China.
This article zeroes in on one central theme: identifying regions with the highest barriers, those where barriers may escalate, and areas where we are falling short.
Let's delve right in.
01 Initial Overview: The Current Barrier Landscape
Five color-coded tiers, with deep red predominantly concentrated in the Americas and South Asia.
The darkest tier encompasses solely the United States, imposing a 100% tariff on electric vehicles, effectively slamming the door shut.
Tariffs exceeding 50% are applicable in Mexico, Turkey, India, and Indonesia. Mexico hiked its rate from 20% to 50% this year, while Turkey imposes an additional 40% to 50% on top of its 10% base rate.
The middle tier comprises the EU, Brazil, Argentina, South Africa, and Russia. I have compiled a table of key markets for your convenience:
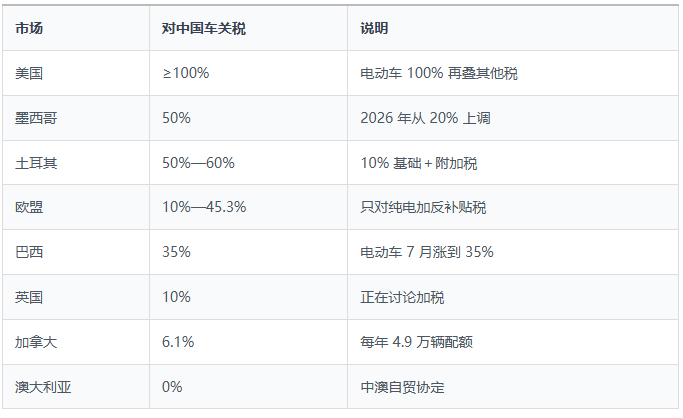
The EU situation is prone to misunderstandings. For instance, BYD faces a combined 27% tariff, SAIC Motor confronts 45.3%, and plug-in hybrids are at 10% but are anticipated to rise shortly.
My assessment is that barriers in the Americas and South Asia are largely established, with few light-colored areas remaining.
02 Potential Future Tariff Hikes
Five markets, indicated with diagonal dotted lines on the map, are exhibiting signals of potential tariff increases.
1. UK: The Times reported on October 4 that the government is drafting a plan for tariffs up to approximately 45%, not yet officially announced.
2. South Africa: The International Trade Administration Commission (ITAC) proposed raising vehicle tariffs from 25% to 50%.
3. Russia: Scrappage tax to escalate by 10% to 20% annually until 2030.
4. Kazakhstan: Rumored to raise the combined tax burden from 33.4% to 48%, not officially announced.
5. Canada: Quotas just introduced, with ongoing US pressure during USMCA reviews.
A discernible pattern emerges here.
Markets where Chinese brands are rapidly gaining market share are often the next to implement tariff hikes.
The UK witnessed Chinese brands capturing a 23.3% market share in September, while Chinese vehicles constitute over half of South Africa's imports—rendering them prime targets.
03 Japan's Comparative Landscape: A Much Lighter Picture
The disparity lies in treaties, not vehicles.
For comparative purposes, I have created a similar map for Japanese vehicles, a major global automotive manufacturer.
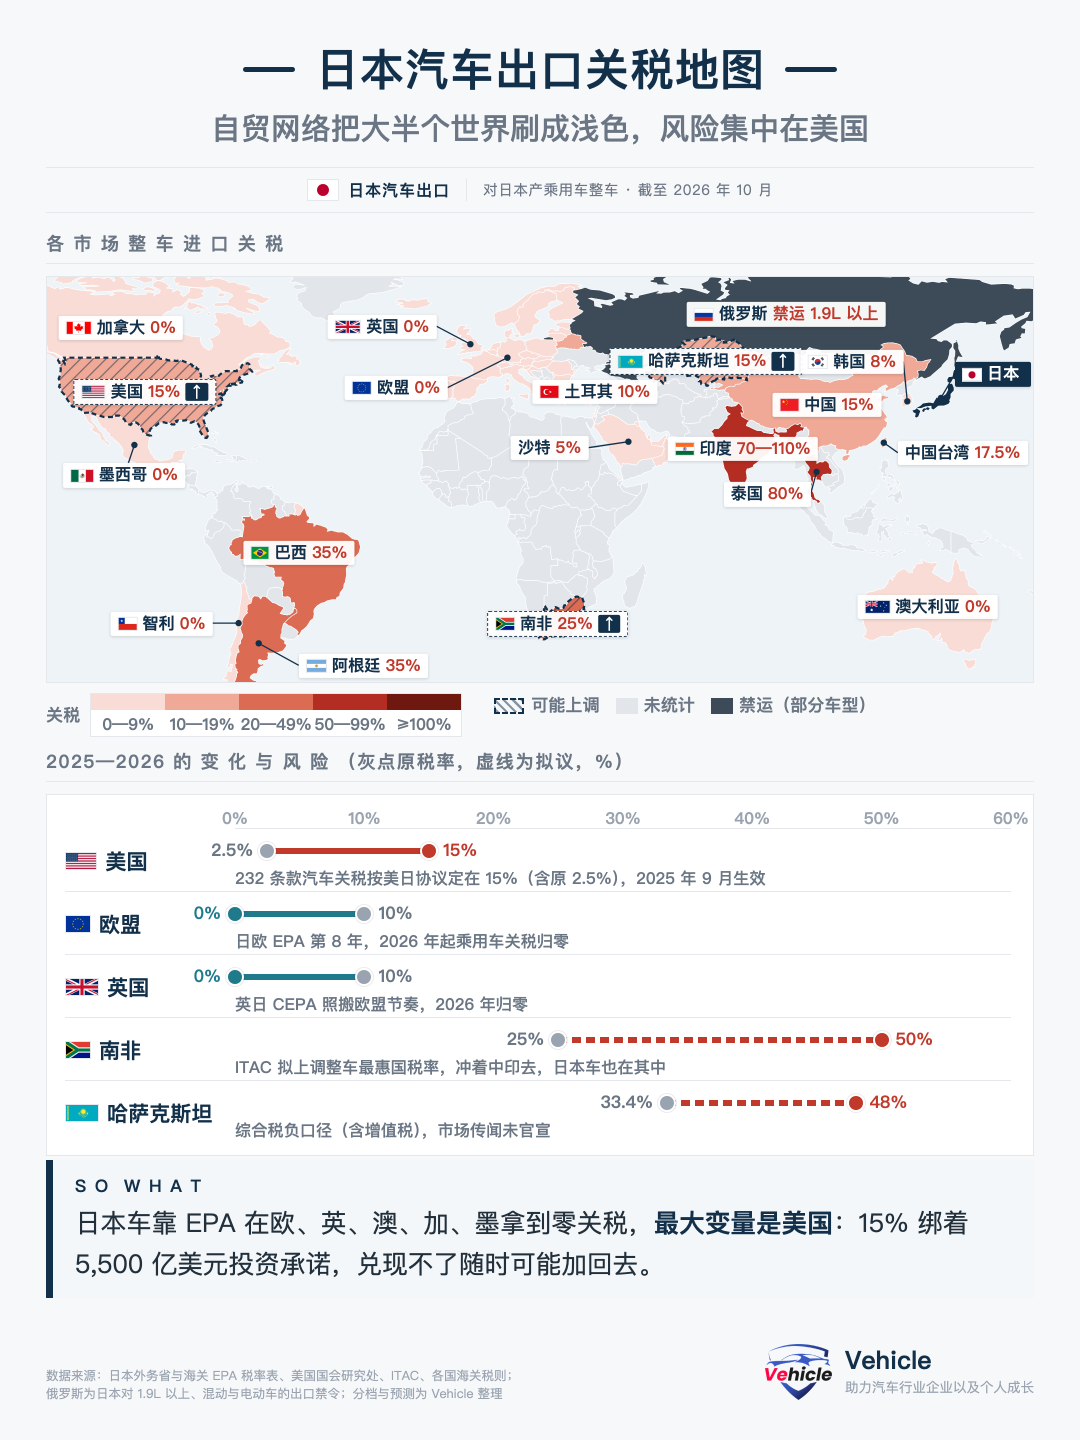
The comparison is striking.
The Japan-EU EPA and Japan-UK CEPA will reduce EU and UK tariffs to zero by 2026. Canada, Mexico, Australia, and Chile also boast zero tariffs for Japanese vehicles.
Japan's only significant risk remains the US, with a 15% tariff tied to a $550 billion investment commitment.
In essence, Chinese vehicles lack not product competitiveness but a robust free trade network.
04 Concluding Remarks
When tariffs obstruct ports, factories relocate.
This elucidates why BYD is constructing factories in Hungary and Turkey, and why Chery is engaging in discussions about contract manufacturing with Nissan.
Of course, tariffs constitute just one facet of the cost equation. Exchange rates, subsidies, and distribution channels also play pivotal roles in determining sales success, and this map cannot supplant detailed market analysis.
Three global developments to monitor next:
1. Whether the UK's Autumn Budget adjusts tariff schedules.
2. When South Africa's ITAC formally proposes its tariff increase.
3. Whether Canada maintains its quotas after USMCA reviews.
Colleagues in China's automotive export industry, preserve these two maps. I will update them with new developments.
Data Sources: Customs tariff schedules and announcements from various countries, Reuters, The Times, ITAC, Global Affairs Canada, Japan's Ministry of Foreign Affairs EPA tariff tables, US Congressional Research Service.
Charts: Compiled by Vehicle, as of October 2026.
The tariffs mentioned pertain to import duties on Chinese-made (or Japanese-made) passenger vehicles, excluding VAT and consumption tax; the EU, Argentina, and Canada exhibit variations by vehicle type or quota; trend assessments represent the author's views, for reference only, and do not constitute investment advice.
That concludes today's share. If you found it beneficial, please like, share, and tap 'Seen'. Feel free to engage in discussions in the comments section.
*Unauthorized reproduction or excerpting strictly prohibited.
-
![]()
BYD Takes the Lead, Li Auto Lags Behind: Are Joint Ventures Making a Comeback? September’s New Energy Vehicle Sales Data Reveals Stark Divisions
-
![]()
New Forces Top Annual List, Tesla Holds Three-Year Reign! September's Pure Electric Model Resale Value Rates: A Tale of Contrasts
-
![]()
Lei Jun’s Bold Claim Proven: Xiaomi Tops Resale Value Charts, with NIO and Li Auto Close Behind!
-
![]()
Has Zunjie 'Stumbled', Paving the Way for Xiaomi's Success?
-
![]()
Before Launch: How Does a Chinese Rocket Stand or Lie?
-
![]()
Zunjie V800 Brake Bracket Fracture: With the Same 40% Glass Fiber-Reinforced Plastic, Where Does the Disparity Arise?
-
![]()
Why Does Your Phone Slow Down After Long-Term Use?
-
![]()
The Comprehensive Guide to Tariffs on Chinese Automobile Exports: A Stark Contrast to Japan