BYD Takes the Lead, Li Auto Lags Behind: Are Joint Ventures Making a Comeback? September’s New Energy Vehicle Sales Data Reveals Stark Divisions
 10/12 2026
 362
362
Written by | Guanchejun
The leaders are surging ahead, the mid-pack is fighting to stay afloat, and the laggards are already trailing far behind. September’s new energy vehicle market appears to be undergoing subtle yet significant shifts.
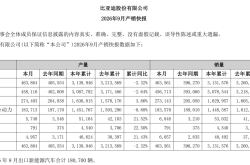
Recently, the China Automotive Data Research Institute unveiled the September 2026 new energy vehicle sales rankings for automakers. In terms of overall sales volume, the estimated wholesale volume of new energy passenger vehicles across China in September reached 1.67 million units, marking double-digit growth both year-on-year and month-on-month, with increases of 11.3% and 11.6%, respectively.
The so-called “Golden September” has lived up to its name. However, in Guanchejun’s view, the most intriguing aspect of these rankings lies not in the total sales volume but in the underlying market structure.
01
First and foremost, BYD dominates the competition by a significant margin.
Undoubtedly, BYD shines as the standout performer on the list. It sold 456,700 units in September, securing a 27% market share.
Geely followed in second place with 188,800 units, Chery took third with 127,500 units, and Leapmotor claimed fourth with 105,700 units. Even when combined, the sales of the second-, third-, and fourth-place automakers fall short of matching BYD’s impressive tally. The “one dominant player” pattern remains firmly intact, at least for the foreseeable future.
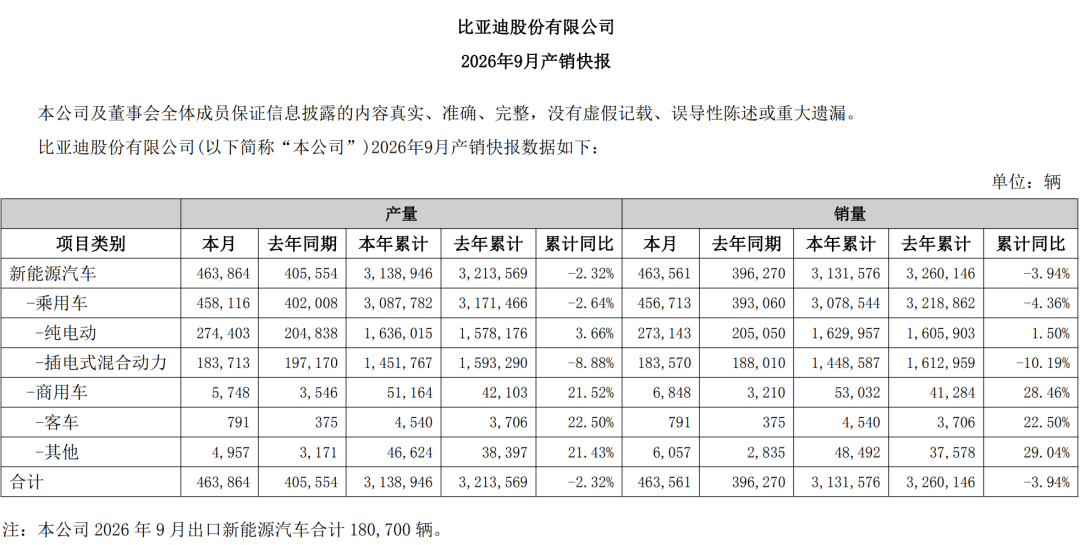
However, Guanchejun also observed that BYD’s cumulative sales from January to September this year have actually declined year-on-year. Despite setting new monthly sales records, its overall annual performance remains stagnant, suggesting that last year’s high sales base and early adoption incentives have preemptively saturated demand.
BYD’s true strength may lie not just within the domestic market but in its export prowess: nearly 40% of its sales come from overseas markets, leveraging international growth to offset domestic competition. This aspect remains unseen in the rankings but is arguably more critical than the rankings themselves.
02
Below the “dominant player,” Changan emerges as the strongest contender in the second tier, with sales surging 80.4% month-on-month to reach 103,000 units. Chery, meanwhile, achieved a 49.3% year-on-year increase, successfully maintaining its traditional fuel-powered vehicle base while simultaneously boosting new energy vehicle sales—a rare feat of balancing both segments in the industry.
Geely remains solidly entrenched in second place, while SAIC Motor Passenger Vehicles (74.7% YoY growth) and GAC Aion (47.9% YoY growth) are quietly thriving.
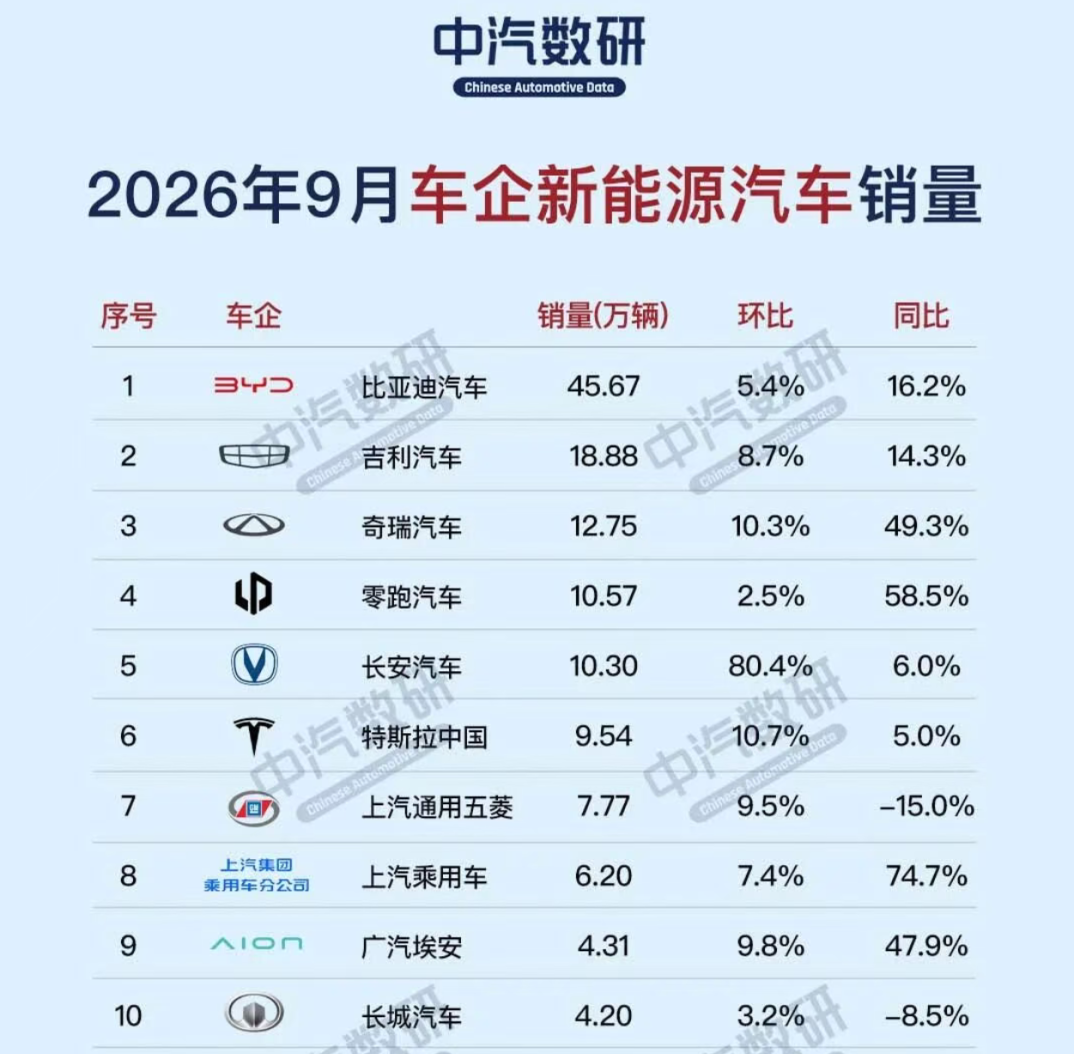
The most easily overlooked data in the rankings lies within the mid-tier segment: SAIC Volkswagen sold 13,100 units, up 174.1% year-on-year; SAIC General Motors sold 17,600 units, up 72.7% year-on-year; and GAC Toyota saw a 14.5% year-on-year increase.
Volkswagen relied on price cuts for its ID. series and channel recovery efforts, while Toyota’s electrification initiatives are finally moving beyond mere rhetoric. This counterattack, however, is largely built on concessions, with profit margins being squeezed to extremely thin levels.
Overall, the winds of change seem to be blowing in favor of joint venture brands.
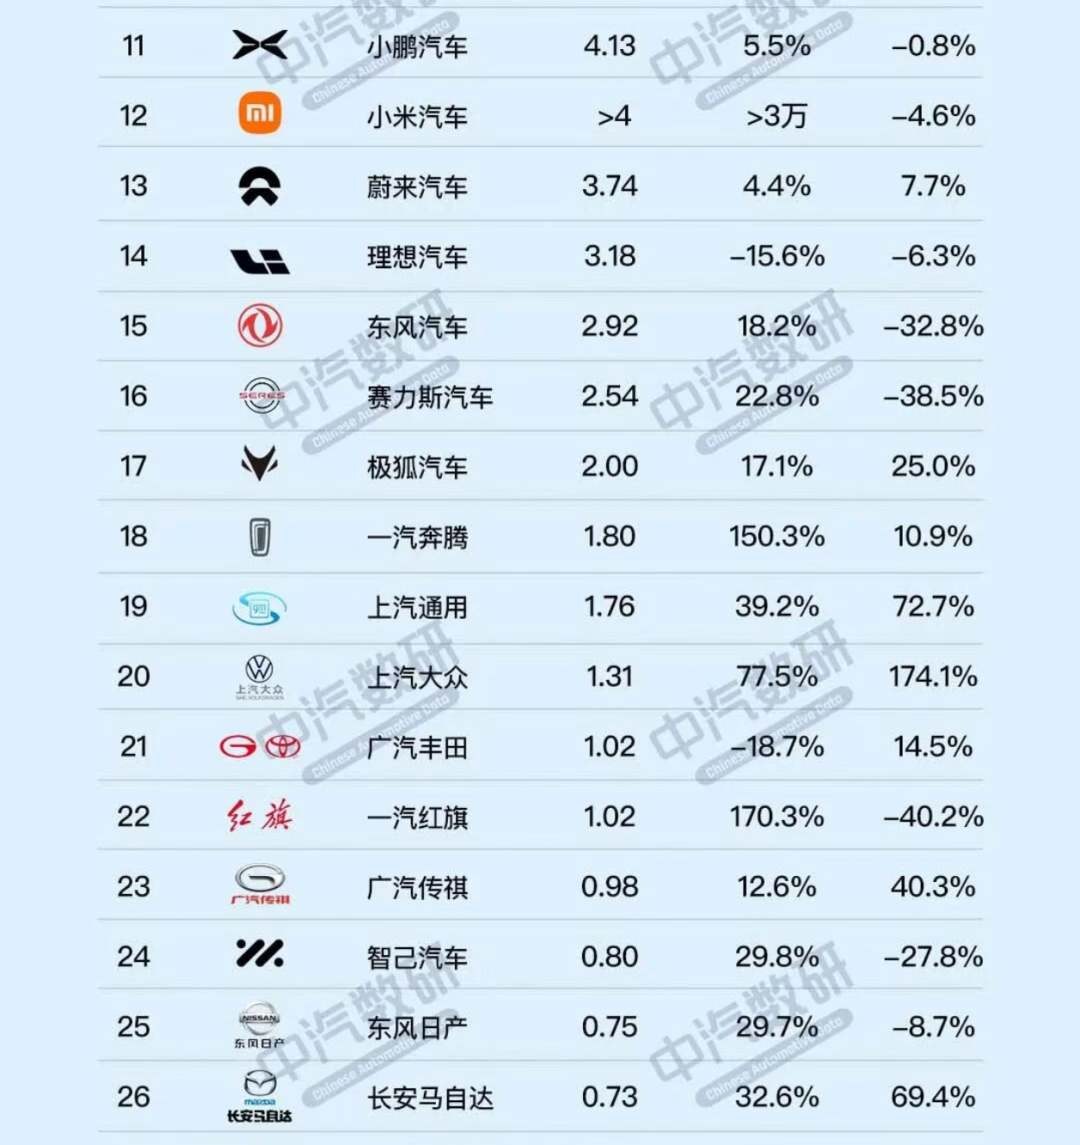
Domestic new energy vehicle startups are experiencing mixed fortunes. Leapmotor sold 105,700 units, up 58.5% year-on-year, surpassing 100,000 units for three consecutive months and solidifying its lead.
Xiaomi delivered over 40,000 units, finally ramping up production and alleviating concerns for Lei Jun; however, after resolving delivery bottlenecks, the next challenge lies in expanding its product lineup.
The most disappointing performers are Li Auto and Seres. Li Auto sold 31,800 units, down 15.6% month-on-month and also negative year-on-year; Seres sold 25,400 units, down 38.5% year-on-year.
03
Finally, there are those falling far behind. Great Wall saw an 8.5% year-on-year decline, Dongfeng experienced a 32.8% drop, FAW Toyota suffered a 63.2% decrease, and FAW Volkswagen plummeted by 74.5%... In the same September, some automakers doubled their sales while others saw theirs halved—this is the Matthew effect in action.
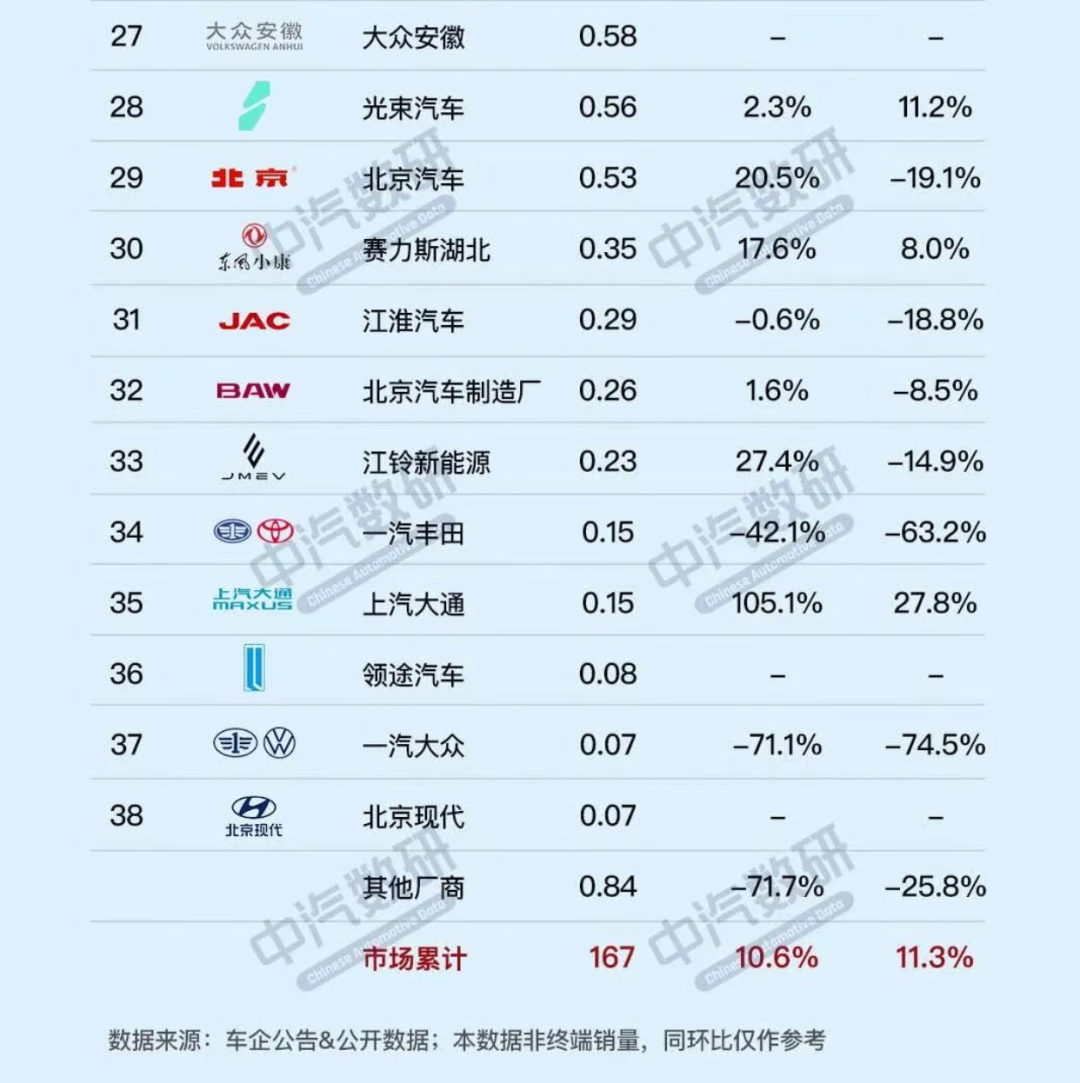
After reviewing the entire rankings, Guanchejun offers three key observations.
First, the sales volume threshold for serious contenders has risen to 100,000 units per month. Without reaching this milestone, automakers lack the qualifications to discuss long-term sustainability. In the first nine months of this year, channels, supply chains, and capital have all concentrated toward the top players. The window of opportunity for mid-tier automakers will likely close within the next one to two years.
Second, automakers with a singular strategy face the greatest risks: those focusing solely on pure electric vehicles mock range extenders as transitional technologies, while those committed to range extenders dismiss the charging challenges faced by pure electric vehicles. Yet both groups are being outflanked by more versatile competitors. Only those who can translate their technical routes into cost advantages will survive the next round of industry consolidation.
Third, do not overlook the broader market environment beyond the rankings: rising memory chip prices and tight supply quotas persist, with executives admitting that per-vehicle costs will increase by 10,000 yuan. While end-market sales surge, underlying supply chain pressures are simultaneously at play. Whether a new round of price wars will erupt in the fourth quarter may no longer be solely decided by the automakers themselves.
Charts in this article without cited sources are derived from public disclosures across various channels. This acknowledgment is made here. The views expressed are for reference only and do not constitute investment advice.
This article is original content from Leverage Auto Observations and is prohibited from reproduction without authorization. For reproduction, please obtain authorization. Additionally, when reproducing with authorization, please indicate the source and author at the beginning of the article. Thank you!
-
![]()
"Not Participating in the Paris Auto Show Means No Car Sales"
-
![]()
BYD Takes the Lead, Li Auto Lags Behind: Are Joint Ventures Making a Comeback? September’s New Energy Vehicle Sales Data Reveals Stark Divisions
-
![]()
New Forces Top Annual List, Tesla Holds Three-Year Reign! September's Pure Electric Model Resale Value Rates: A Tale of Contrasts
-
![]()
Lei Jun’s Bold Claim Proven: Xiaomi Tops Resale Value Charts, with NIO and Li Auto Close Behind!
-
![]()
Has Zunjie 'Stumbled', Paving the Way for Xiaomi's Success?
-
![]()
Before Launch: How Does a Chinese Rocket Stand or Lie?
-
![]()
Zunjie V800 Brake Bracket Fracture: With the Same 40% Glass Fiber-Reinforced Plastic, Where Does the Disparity Arise?
-
![]()
Why Does Your Phone Slow Down After Long-Term Use?