Yutong Bus: Selling 2,600 Fewer Units Yet Boosting Gross Profit by 600 Million Yuan, with Overseas Sales Fueling Profit Surge
 10/21 2026
 416
On the evening of October 14, Yutong Bus unveiled its Q3 2026 financial results, presenting a somewhat paradoxical scenario. In the first nine months, operating revenue dipped by 2.09% year-on-year to RMB 25.816 billion, while net profit attributable to shareholders decreased by 3.31% to RMB 3.184 billion. However, non-recurring net profit attributable to shareholders soared by 18.45% year-on-year, reaching RMB 3.099 billion.
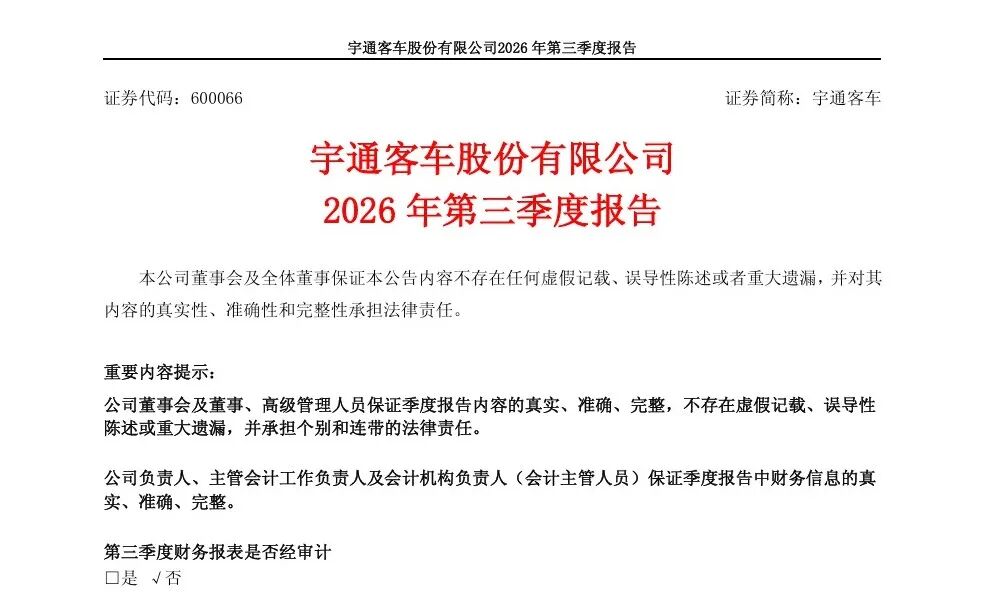
Focusing solely on Q3, the disparity becomes even more pronounced: revenue declined by 11.13% year-on-year to RMB 9.097 billion, whereas non-recurring net profit attributable to shareholders jumped by 22.25% to RMB 1.303 billion.
Sales figures also reflect a downturn. Yutong's production and sales report indicates that from January to September, the company sold a total of 30,929 buses, marking a 7.8% year-on-year decrease.
Despite selling fewer units and experiencing a revenue decline, non-recurring profits have surged. What's driving this phenomenon?
Profit Decline is Deceptive; Core Business is Actually Strengthening
To decipher this financial report, we must first understand the significant disparity between net profit attributable to shareholders and non-recurring net profit.
Yutong's non-recurring gains and losses for the same period last year amounted to RMB 676 million, but this year they have plummeted to RMB 85 million, a reduction of RMB 591 million. This difference primarily stems from two factors.
Firstly, changes in the fair value and disposal gains/losses from held financial assets shifted from a positive RMB 384 million last year to a negative RMB 96 million this year. Secondly, non-current asset disposal gains/losses decreased from RMB 179 million to RMB 10 million.
In essence, nearly RMB 700 million of last year's book profit was "windfall gains," which have largely vanished this year. After excluding non-recurring items, the core business has genuinely improved—Q3 non-recurring gains/losses plummeted from RMB 291 million last year to RMB 13 million, while net profit attributable to shareholders only slightly declined by 3.00%.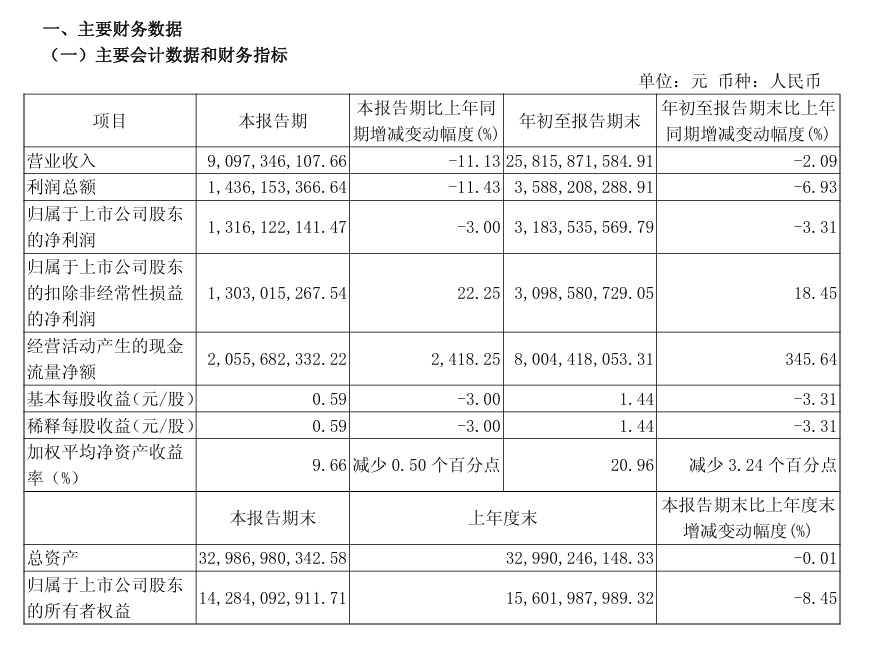
The real hero is the gross margin. In the first nine months, the gross margin was 25.27%, up 2.91 percentage points year-on-year (22.36% in the same period last year). Q3's quarterly gross margin was 26.73%, up 2.75 percentage points year-on-year and 1.75 percentage points quarter-on-quarter.
Consequently, Yutong's revenue in the first nine months of this year was about RMB 550 million less than the same period last year, but gross profit increased by RMB 628 million, from RMB 5.895 billion to RMB 6.523 billion.
Per-unit data further corroborates this. Based on the first nine months' sales of 30,929 units, the per-unit revenue was RMB 834,700, up 6% from RMB 785,700 last year. Per-unit non-recurring net profit was RMB 100,200, up 28.5% from RMB 78,000 last year. In Q3, per-unit revenue was approximately RMB 840,100, and per-unit non-recurring net profit attributable to shareholders was about RMB 120,000.
Clearly, Yutong is generating more profit with fewer buses.
But how meaningful is this profit? Cash flow provides the answer.
In the first nine months, net cash flow from operating activities was RMB 8.004 billion, up 345.64% year-on-year, 2.5 times the same period's net profit of RMB 3.208 billion. Two details are noteworthy: cash received from sales was RMB 31.936 billion, far exceeding the RMB 25.816 billion in operating revenue, with a cash collection ratio of 1.24 (1.07 in the same period last year). Accounts receivable dropped from RMB 5.380 billion at the beginning of the year to RMB 2.476 billion, a 54% decrease, indicating accelerated collection of past receivables.
Additionally, Yutong's contract liabilities (advance payments) increased from RMB 1.858 billion to RMB 2.670 billion, up 43.7%, suggesting a robust backlog of orders despite the revenue decline.
Profits Mainly Originate from Overseas Markets
Why has Yutong's gross margin improved? The answer lies in its regional structure.
It's important to note that Yutong explicitly states in its periodic reports that its business and products exhibit a certain degree of homogeneity, and therefore it does not need to disclose segmented data. Consequently, the Q3 report does not provide regional revenue and gross margin breakdowns. The most recent authoritative regional profit data comes from the 2025 annual report: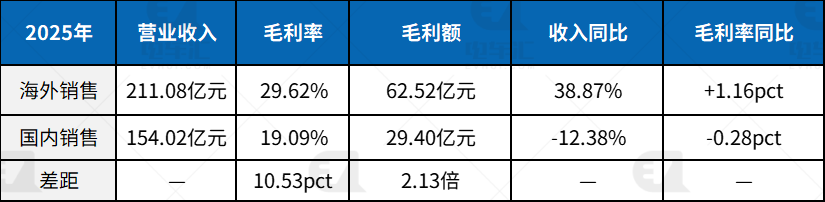
Data Source: Yutong Bus 2025 Annual Report - Main Business by Region
Overseas revenue accounted for 57.81% of main business revenue but contributed 62.5% of gross profit, with a gross margin 10.53 percentage points higher than domestic operations.
Breaking it down per unit, the gap is even more striking than the gross margin. In 2025, Yutong sold a total of 49,518 buses, including 17,149 exports. Based on this, export per-unit revenue was approximately RMB 1.231 million, with per-unit gross profit of about RMB 365,000. Excluding exports, domestic sales were about 32,369 units, with per-unit revenue of approximately RMB 476,000 and per-unit gross profit of about RMB 91,000.
The per-unit revenue difference is 2.59 times, and the per-unit gross profit difference is 4.01 times, meaning the gross profit from selling one export bus is roughly equivalent to selling four domestic buses.
This structure has not weakened in 2026 but has instead strengthened.
In the first half of 2026, Yutong exported 6,850 units, up 13.8% year-on-year, accounting for about 34% of total sales. Domestic sales were 13,250 units, down 13.4% year-on-year. By Q3, the export share further increased to 36.3%, up 2.8 percentage points quarter-on-quarter. Q3 alone saw 3,928 exports and 6,901 domestic sales.
Comparing 2025 and 2026, a more significant observation emerges: Yutong's growth engine has shifted from volume to price.
In 2025, overseas revenue grew by 38.87%, primarily driven by volume, with export sales increasing from 14,000 to 17,149 units. In the first nine months of 2026, export sales were 10,778 units, up only 0.34% year-on-year, barely maintaining the status quo. Yet, the overall gross margin still improved by 2.91 percentage points, and non-recurring net profit grew by 18.45%.
Yutong's profit growth this year has come almost entirely from higher unit prices and improved order structure, not from selling more units.
Declining Bus Sales: A Reality
While highlighting these positives, several realities warrant attention.
Yutong's exports slowed significantly in Q3. Export sales in Q3 were 3,928 units, down 16.81% year-on-year. New energy exports were about 1,000 units, down 23.95% year-on-year. Yutong attributes this to delivery timing disruptions rather than a weakening trend, noting that September exports reached 1,566 units, up 32.71% month-on-month, with a market share of 22.13% reclaiming the top spot in the industry. This explanation holds some merit.
Yutong's domestic sales underperformed the industry. From January to September, Yutong sold 24,987 domestic buses over 6 meters, down 12.95% year-on-year. Meanwhile, the industry sold 87,076 buses over 6 meters, down only 2.18% year-on-year. Yutong's decline was significantly steeper than the industry average, with a market share of 28.70%. Although it remains the industry leader, the pressure to contract is real.
Of course, this outcome could also reflect Yutong's strategic decision to abandon low-margin orders or intensified competition. Distinguishing between these factors is crucial but requires subsequent data for verification.
Another point is that Yutong's reported accrued liabilities increased to RMB 5.543 billion, up 22% from RMB 4.543 billion at the beginning of the year, accounting for 16.8% of total assets, primarily consisting of provisioned after-sales service and warranty expenses. Adequate provisioning suggests potential future profit releases, but as export and new energy vehicle scales expand, the actual costs of overseas after-sales service and battery warranties may also rise.
From Yutong Bus's Q3 report, its profitability is top-tier in the manufacturing sector, with a gross margin of 25.27%, non-recurring net margin of 12%, per-unit non-recurring net profit of RMB 100,200, weighted average return on equity of 20.96%, and operating cash flow 2.5 times net profit. Supporting all this is an overseas gross margin over 10 percentage points higher than domestic operations and per-unit gross profit four times that of domestic sales.
However, its vulnerabilities are also clear. The high profit growth currently relies almost entirely on higher export unit prices and improved order structure, while export volumes have already seen double-digit declines in Q3. Whether the Q4 export peak season and year-end domestic procurement surge can grow together will determine whether Yutong can sustain this profit level in ongoing operations.
-
![]()
Apple, the 'Latecomer,' Initiates Limited AI Rollout
-
![]()
Yutong Bus: Selling 2,600 Fewer Units Yet Boosting Gross Profit by 600 Million Yuan, with Overseas Sales Fueling Profit Surge
-
![]()
GM's Q3 2026: Pickup Trucks Mint Money, Buybacks Provide Support, EVs on Pause
-
![]()
Fuel-Powered Vehicles: Shifting to a 'Niche' Role
-
![]()
Pure Electric Vehicles Dominate the RMB100,000 Market, and the Shift from Fuel to Electric is Unstoppable
-
![]()
September's Top 10 MPV Sales: Joint Venture MPV Regains Leadership
-
![]()
MIIT Unveils New Car Lineup: Multiple Series 9 Models Make Their Grand Entrance
-
![]()
Zhu Huarong Steps Down, Zhao Fei Takes the Helm: Changan Automobile Unveils Its 'Two-Phase' Governance Strategy