SMIC: Not Obsessing Over Short-Term Results, Is AI 'Domestic Chip' the True Belief?
 11/14 2025
 833
833
SMIC Releases Q3 2025 Financial Results After Market Close on November 13, 2025 (Beijing Time): Key Highlights (for the quarter ending September 2025)
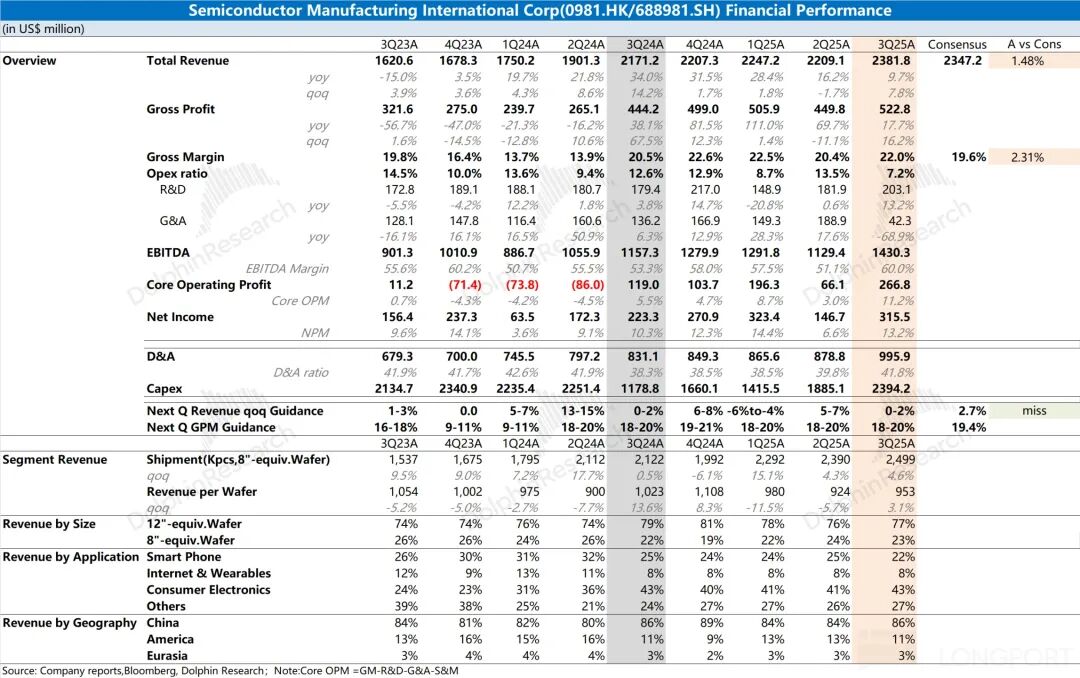
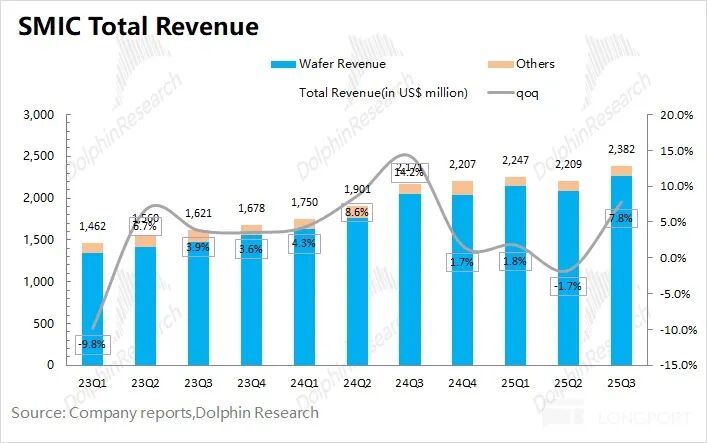
1. Overall Performance: SMIC achieved revenue of $2.38 billion in Q3 2025, largely in line with market expectations ($2.35 billion) and up 7.8% QoQ, slightly above the guidance range (5-7% QoQ growth). The revenue growth was primarily driven by a recovery in demand for consumer electronics, industrial & automotive, and smart home applications.
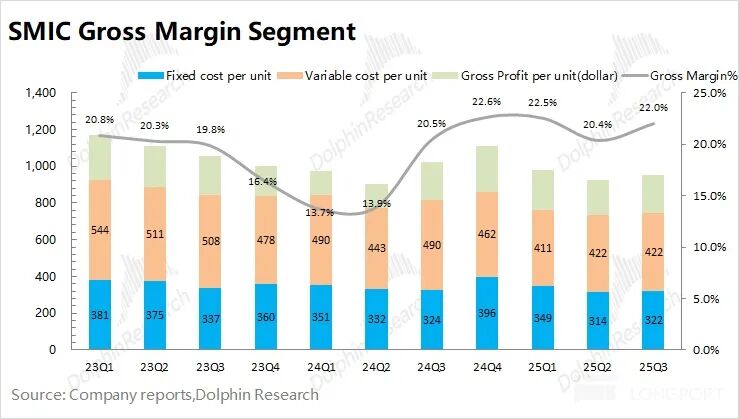
The gross margin for Q3 2025 was 22%, exceeding the upper limit of the guidance range (18-20%). The increase in average selling price (ASP) per wafer ($29/wafer) outpaced the rise in unit costs ($8/wafer), leading to the margin improvement.
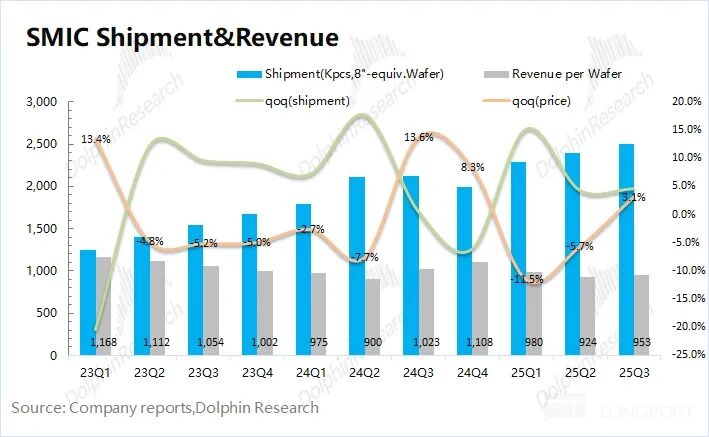
2. Key Performance Indicators: Revenue, Gross Margin, and Capacity Utilization. Revenue growth was driven by both volume and price increases. The proportion of 12-inch wafer shipments rose, structurally boosting ASP. Wafer shipments increased by 4.6% QoQ, while ASP rose by 3% QoQ.
3. Business Progress: Driven by domestic substitution, over 80% of SMIC's revenue now comes from China. QoQ revenue increased in consumer electronics, industrial & automotive, and smart home sectors, while the mobile business declined again.
Despite government subsidies, the mobile business saw no significant recovery, now accounting for just 20% of revenue. Consumer electronics has become the largest revenue contributor at over 40%.
4. Expenses and Capital Expenditure: Operating expenses mainly consist of R&D and administrative costs. R&D spending rose 13% YoY, while administrative expenses declined due to reduced factory setup-related expenditures.
Capital expenditure reached $2.39 billion in Q3. Despite weaker traditional semiconductor demand, SMIC maintains high capex. With Q4 capex typically remaining elevated, Dolphin Research speculates SMIC may raise its full-year capex guidance (previously expected to be similar to 2024).
5. Q4 2025 Guidance: SMIC expects revenue to grow 0-2% QoQ in Q4 2025, reaching $2.38-2.43 billion (market consensus: $2.41 billion), with a gross margin of 18-20% (market consensus: 19.4%).
Dolphin Research's Overall View: Short-Term Fluctuations Matter Less; Domestic Chip Rise Inspires Confidence.
SMIC's Q3 performance was solid, primarily due to a better-than-expected gross margin, driven by a significant recovery in ASP outpacing unit cost increases.
Q4 guidance is more critical, but the outlook remains subdued. Revenue is expected to grow 0-2% QoQ, below market expectations (2.7% QoQ). The gross margin guidance of 18-20% remains conservative, suggesting potential cost pressures next quarter.
Management's view on the traditional semiconductor market remains cautious. Despite a Q3 gross margin recovery to 22%, no clear signal of sustained margin improvement was given. From SMIC's perspective, a true recovery in the traditional semiconductor market has yet to materialize, and performance may remain subdued.
Beyond Q3 operating data, key focus areas for SMIC include:
a) Capital Expenditure and Capacity: Q3 capex was $2.39 billion, up $500 million QoQ. With full-year 2025 capex expected to be flat YoY, Q4 capex is projected at $1.64 billion.
Given typically high Q4 capex, Dolphin Research expects SMIC may raise its full-year capex guidance.
Despite no clear recovery in the traditional semiconductor market and a gross margin around 20%, SMIC maintains annual capex of $7-8 billion for 'counter-cyclical expansion.'
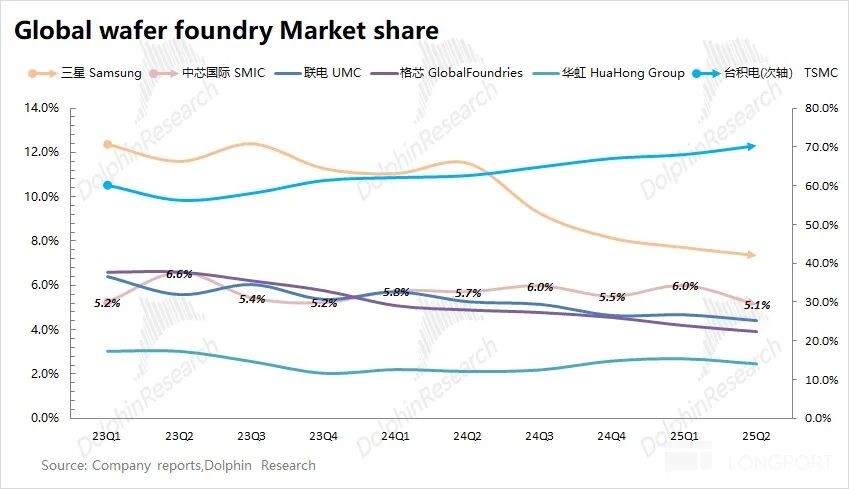
Driven by sustained high investment, SMIC's quarterly wafer capacity has reached 2.6 million units (8-inch equivalent), doubling since late 2018. This capacity growth increasingly meets domestic demand, securing SMIC's position as the third-largest global wafer foundry.
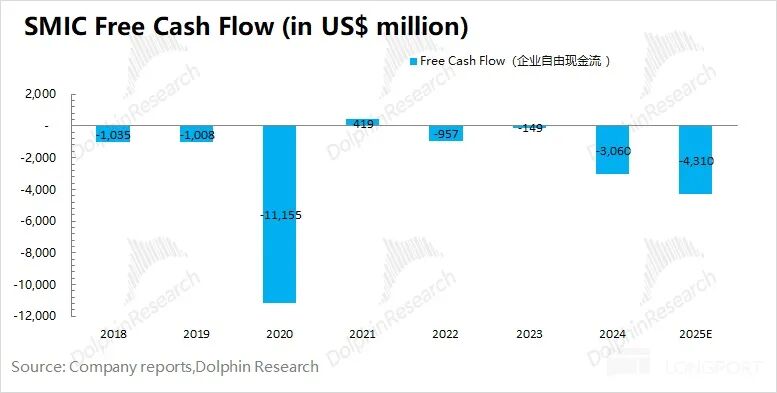
b) Gross Margin and Cash Flow: At a ~20% gross margin, SMIC's annual operating profit is around $1.1 billion. Even with $3-4 billion in annual depreciation and amortization added back, cash flow remains insufficient to cover $7-8 billion in annual capex. [Free Cash Flow = After-Tax Operating Profit + Depreciation & Amortization - Working Capital Increase - Capital Expenditure]
Historically, SMIC only achieved positive free cash flow once (in 2021) during the semiconductor upcycle, when gross margins exceeded 30% and capex was reduced, leading to positive FCF.
Considering only after-tax operating profit, depreciation, and $7-8 billion in annual capex, SMIC's funding gap would only close if gross margins steadily recover to around 27% by 2028.
c) Domestic and International Perspectives & Pricing Power: Due to SMIC's unique position, domestic and international investors hold divergent views. After Q2 results, domestic brokerages were uniformly bullish, while foreign firms like JP Morgan remained bearish. This reflects differing investment logics:
① For domestic investors: It's a long-term commitment reflecting expectations for narrowing the semiconductor industry gap and aligning with national strategic goals.
② For overseas investors: 1) SMIC's assets are less scarce, with alternatives like Samsung, TSMC, UMC, and GlobalFoundries; 2) No need to consider strategic national interests. From a foreign perspective, SMIC remains a 'capital-intensive' asset lacking 'self-sufficiency'; 3) Investing in SMIC also entails currency and geopolitical risks.
Judging by Stock Connect holdings, domestic investors now own over 50% of SMIC's H-share free float, wielding significant influence. SMIC's stock price movements show a clear correlation with mainland-Hong Kong stock holdings.

From an investment perspective, at a current market cap of HK$604.8 billion (~US$77.5 billion), SMIC trades at approximately 50x 2026 core operating profit (assuming +15% YoY revenue, 23% gross margin, 7% tax rate). Valuation digestion requires years of sustained growth.
From a price-to-book (PB) perspective, foundry PB multiples are: TSMC 9.2 > SMIC 3.6 > GlobalFoundries 1.7 > UMC 1.5. TSMC's premium (PEG ~1) reflects its advanced process leadership and high economic returns.
SMIC's revenue scale is similar to UMC and GlobalFoundries. While slightly ahead in process nodes, its gross margins lag. SMIC's higher PB valuation primarily reflects 'domestic substitution' and 'process breakthrough' expectations.
Without clear profitability advantages, current profits (~$1-1.5 billion) are hard to justify on a PE basis.
From a PB standpoint, a valuation above 2x PB begins to incorporate 'long-term commitment' confidence. Each escalation in US-China tensions or breakthrough in domestic semiconductors further boosts 'domestic chip chain' confidence, directly lifting SMIC's PB multiple.
For retail investors, SMIC investment depends on desired returns. Pre-breakthrough, from a pure market perspective, SMIC should trade at 1-2x PB (comparable to UMC, GlobalFoundries).
When shares exceed 2x PB, valuations incorporate 'domestic substitution' and 'process breakthrough' expectations, with higher volatility suited for 'long-term belief' investors.
Especially now, with major capital expenditures by Alibaba Cloud and others, and chip procurement effectively localized to domestic foundries, SMIC's value as an upstream wafer manufacturer becomes increasingly critical.
Detailed Analysis Follows
I. Key Performance Indicators: Revenue, Gross Margin, and Capacity Utilization
Indicator 1: Revenue
SMIC achieved Q3 2025 revenue of $2.38 billion, up 7.8% QoQ, slightly above guidance (5-7% QoQ). Last quarter's decline resulted from annual production line maintenance and equipment upgrades.
Revenue recovery this quarter was driven by demand rebounds in consumer electronics, industrial & automotive, and smart home sectors.
Analyzing volume and price drivers:
1) Volume: Q3 wafer shipments (8-inch equivalent) reached 24.99 million units, up 4.6% QoQ.
2) Price: ASP per wafer (8-inch equivalent) was $953, up 3.1% QoQ.
Volume and price breakdown: Driven by high capex, both capacity and output increased. ASP rose again this quarter, primarily due to a higher proportion of 12-inch wafers, structurally boosting ASP.
Looking ahead to Q4 2025, SMIC guides for 0-2% QoQ revenue growth ($2.38-2.43 billion), below market consensus (2.7% QoQ). Seasonal declines are expected as electronics peak demand occurred in Q2-Q3.
Moreover, the modest revenue guidance reflects continued weakness in traditional semiconductor demand.
Indicator 2: Gross Margin
Q3 2025 gross margin was 22%, up 1.6 ppts QoQ, exceeding market expectations (19.6%) and the guidance range (18-20%).
Cost structure breakdown:
Gross profit per wafer = Revenue per wafer - Fixed cost per wafer - Variable cost per wafer
1) Revenue per wafer: $953 (8-inch equivalent), up $29 QoQ.
2) Fixed cost per wafer: $322 (8-inch equivalent), up $7 QoQ. Depreciation & amortization reached $804 million, up 7% QoQ. With shipments rising, fixed cost per wafer increased only 2.3% QoQ.
3) Variable cost per wafer: $422 (8-inch equivalent), largely unchanged QoQ. Last quarter's rise resulted partly from equipment upgrades.
4) Gross profit per wafer: $209 (8-inch equivalent), up $21 QoQ.
Cost breakdown shows margin expansion was driven by ASP growth, with only modest unit cost increases, lifting gross margin to 22%.
For Q4 2025, SMIC guides for a gross margin of 18-20% (market consensus: 19.4%). Despite Q3's 22% margin, no upward revision suggests management's concern over potential cost pressures and still-weak downstream demand.
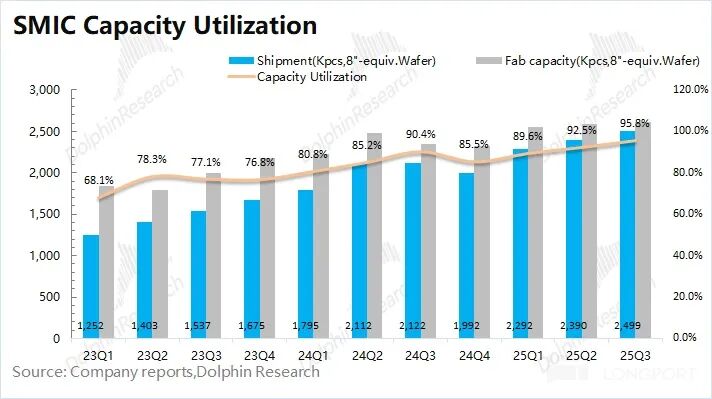
Core Indicator 3: Capacity Utilization Rate
The capacity utilization rate indicator not only reflects SMIC's quarterly operating performance but also provides insights into the overall prosperity trend of the wafer fabrication industry. This is particularly relevant during periods of semiconductor downturn, as monitoring the capacity utilization rate helps grasp the supply and demand changes in both the company and the industry.
In the third quarter of 2025, SMIC's capacity utilization rate reached 95.8%, continuing to rebound from the previous quarter. Considering the company's revenue structure and next quarter's revenue guidance, Dolphin Research believes that the rebound in capacity utilization this quarter was mainly driven by increased demand in consumer electronics, industrial and automotive, and smart home sectors.
By estimating the capacity utilization rate and shipment volume for this quarter, SMIC's total capacity reached 2,609 thousand wafers, representing a 1% increase from the previous quarter. Given that the company's annual capital expenditures have remained at $7-8 billion in recent years, this has led to continuous expansion of its production capacity.
SMIC's capital expenditures for this quarter amounted to $2.39 billion. If the company maintains its full-year capital expenditure target (similar to that of 2024), its capital expenditures for the fourth quarter would be $1.64 billion. Since the fourth quarter is typically not a low-demand period, Dolphin Research anticipates that the company may increase its full-year capital expenditure target, demonstrating its commitment to ongoing capacity expansion.
II. Analyzing SMIC from a Business Perspective
After reviewing the three core indicators, let's take a comprehensive look at SMIC's quarterly business performance with Dolphin Research:
2.1 Downstream Market Segments
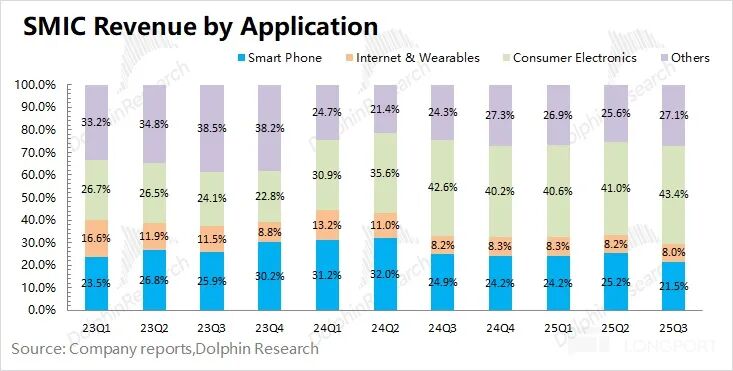
Consumer electronics remained the largest revenue contributor for the company this quarter, accounting for 43.4%. Driven by the inventory build-up demand during the peak season for electronic products in the second half of the year, consumer electronics products saw a quarter-over-quarter increase.
This quarter, SMIC's smartphone business revenue share declined to 21.5%, with quarterly revenue falling to $490 million. Comparing the smartphone business performance across the three quarters this year with the same period last year, there has been no significant growth, indicating that the national subsidy policy has not notably boosted the company's smartphone business.
Considering the performance of various downstream businesses, the quarter-over-quarter revenue growth this quarter was driven by consumer electronics, industrial and automotive, and smart home sectors. The smartphone business, which declined by 7.4% quarter-over-quarter, was a drag on the company's performance this quarter. As the smartphone business's share decreases, its impact on the company's overall performance has also significantly weakened.
2.2 Wafer Sizes
Starting from the first quarter of 2022, SMIC no longer discloses the revenue share of each process node, only revealing the revenue share of 8-inch and 12-inch wafers. This makes it impossible to observe the revenue changes at each node in detail.
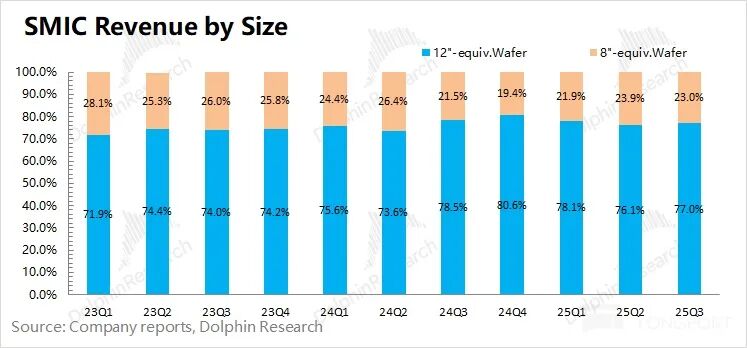
This quarter, SMIC's 12-inch wafer revenue share increased to 77%, primarily due to inventory build-up in downstream markets such as consumer electronics. Specifically, considering the revenue share of both wafer sizes and the company's revenue, SMIC's 12-inch wafer revenue increased by 9.1% quarter-over-quarter, while 8-inch wafer revenue rose by 3.8%.
Over the past two quarters, the continuous quarter-over-quarter growth in 8-inch wafer revenue was mainly supported by the inventory build-up demand from the industrial and automotive sectors. As this demand weakens, 12-inch wafers have once again become the primary driver of the company's performance.
2.3 Regional Distribution
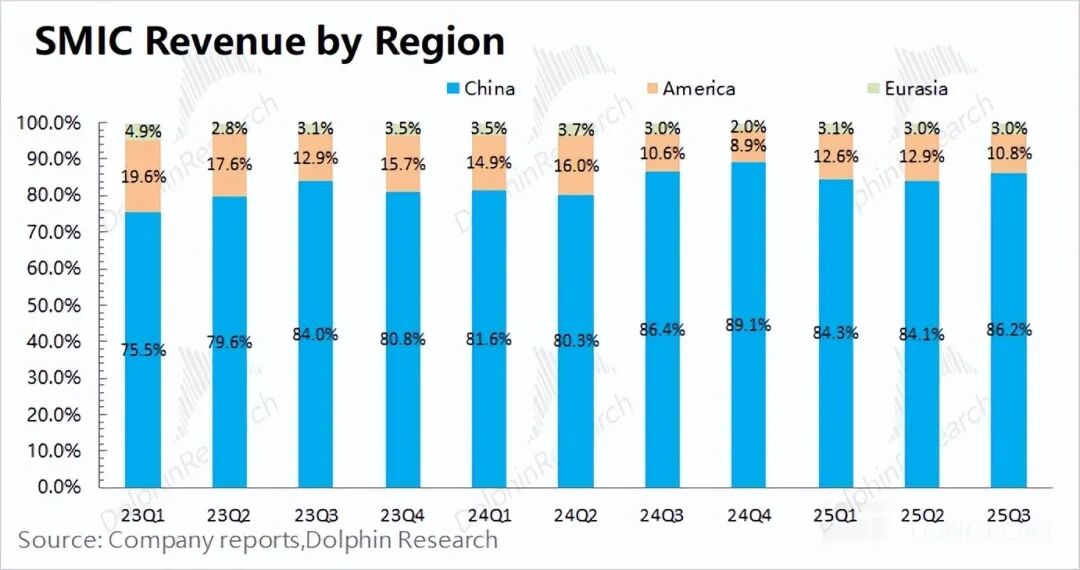
SMIC has readjusted its regional revenue distribution metrics, changing from the original "North America/Mainland China and Hong Kong/Europe and Asia" to the current "China Region/US Region/Eurasia Region." Due to this adjustment, there are slight differences in the data.
From this quarter's regional revenue perspective, the China Region maintained its position as the largest revenue contributor at 86%. Additionally, the company's revenue shares in the US Region and Eurasia Region remained at 11% and 3%, respectively, this quarter.
SMIC's revenue in the China Region reached $2.05 billion this quarter, representing a 10% quarter-over-quarter increase, driven by inventory build-up demand during the peak season in the second half of the year. With the support of the national subsidy policy, the company's domestic market revenue has seen accelerated year-over-year growth over the past few quarters. However, the year-over-year growth rate of domestic revenue slowed to 9% this quarter, indicating a gradual weakening of the policy's impact.
III. Analyzing SMIC from Operational Data
3.1 Operating Expenses
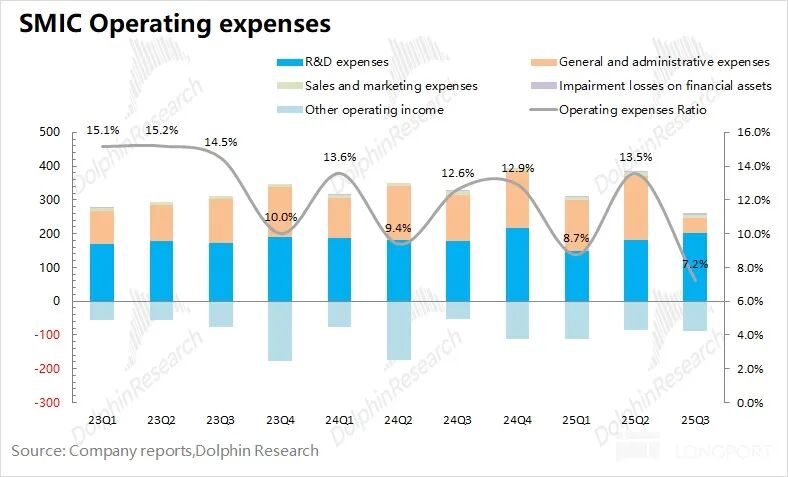
From an operating expense perspective, SMIC's operating expenses for this quarter were $170 million, a significant decrease primarily due to reduced administrative expenses. The operating expense ratio fell to 7.2% this quarter.
Breaking down this quarter's operating expenses, research and development expenditures amounted to $200 million, general and administrative expenses were $40 million, and sales and marketing expenses were $10 million. The $150 million quarter-over-quarter decrease in general and administrative expenses was mainly due to reduced expenses related to the opening of new factories this quarter.
3.2 Operating Indicators
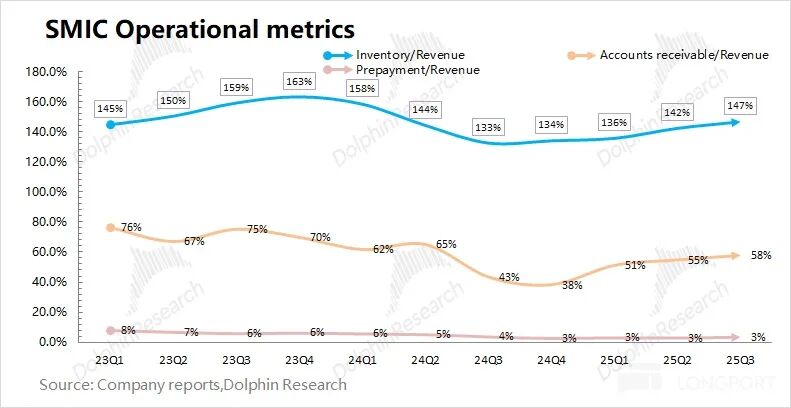
From an operating indicator perspective, we primarily observe the company's inventory and accounts receivable:
1) SMIC's inventory reached $3.49 billion this quarter, representing an 11% quarter-over-quarter increase; 2) SMIC's accounts receivable amounted to $1.38 billion this quarter, a 14% quarter-over-quarter increase.
Considering the relationship between inventory & accounts receivable and revenue in the balance sheet, the inventory-to-revenue and accounts receivable-to-revenue ratios were 147% and 58%, respectively, this quarter. From an operational indicator perspective, SMIC's inventory share has increased. The company typically ramps up inventory in the third quarter, and overall, it remains at a relatively reasonable level.
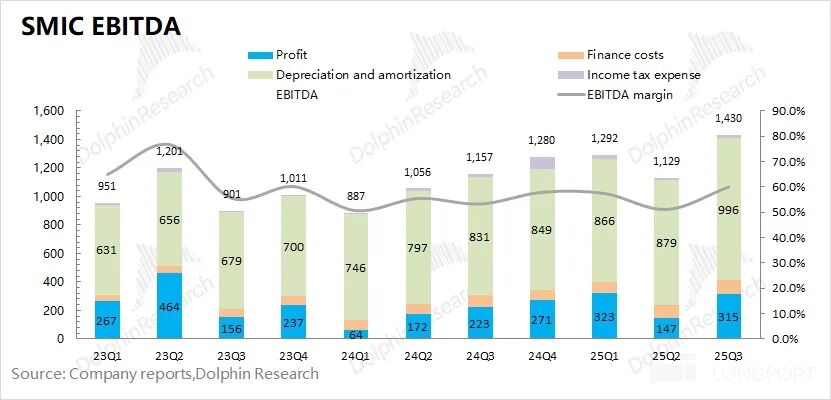
3.3 EBITDA Indicators
From an EBITDA perspective, SMIC's earnings before interest, taxes, depreciation, and amortization (EBITDA) reached $1.43 billion this quarter, showing a significant rebound.
Breaking down the indicators, SMIC's EBITDA primarily comes from the release of operating profits and depreciation and amortization. The calculated profit margin (before interest, taxes, depreciation, and amortization) rebounded to 60% this quarter. The increase in the company's profit this quarter was mainly driven by improved gross margins and reduced administrative expenses.
- END -
// Reproduction Authorization
This article is an original piece by Dolphin Research. Reproduction requires authorization.
// Disclaimer and General Disclosure
This report is intended for general comprehensive data purposes, providing Dolphin Research and its affiliated institutions' users with general reading and data reference. It does not consider the specific investment objectives, investment product preferences, risk tolerance, financial situation, or special needs of any individual receiving this report. Investors must consult with independent professional advisors before making investment decisions based on this report. Any investment decisions made using or referring to the content or information in this report are at the investor's own risk. Dolphin Research shall not be liable for any direct or indirect responsibilities or losses that may arise from using the data in this report. The information and data in this report are based on publicly available sources and are for reference purposes only. Dolphin Research strives to ensure but does not guarantee the reliability, accuracy, and completeness of the information and data.
The information or views mentioned in this report shall not be regarded as or construed as an offer to sell securities or an invitation to buy or sell securities in any jurisdiction. They also do not constitute recommendations, inquiries, or endorsements regarding relevant securities or related financial instruments. The information, tools, and data in this report are not intended for or proposed for distribution to jurisdictions where distribution, publication, provision, or use of such information, tools, and data conflicts with applicable laws or regulations or requires Dolphin Research and/or its subsidiaries or affiliated companies to comply with any registration or licensing requirements in those jurisdictions, or to citizens or residents of those jurisdictions.
This report solely reflects the personal views, insights, and analytical methods of the relevant creators and does not represent the stance of Dolphin Research and/or its affiliated institutions.
This report is produced by Dolphin Research, and the copyright is solely owned by Dolphin Research. Without prior written consent from Dolphin Research, no institution or individual may (i) produce, copy, duplicate, reproduce, forward, or create any form of copies or reproductions in any manner, and/or (ii) directly or indirectly redistribute or transfer them to other unauthorized persons. Dolphin Research reserves all related rights.
-
![]()
ByteDance, DJI, and Xiaohongshu Secure Top Three Positions Among China’s Fastest-Growing Unicorns
-
Tesla's in-car voice system in China is finally learning to 'understand human language'
-
![]()
Foreigners Are Amazed: Chinese Electric Vehicle Drive Systems Unveil Innovative 'Poses'
-
![]()
700,000 Brothers and the Future of Robots: Behind JD.com's 'Nirvana Plan'
-
![]()
Zhipu's Trillion-Dollar Valuation: A New Chapter for China's AI
-
![]()
Is Laifen, a 'Dyson Alternative' on the Rise, Now Ensnared by the 'Alternative Curse'?
-
![]()
Beyond Patents: Insta360 and DJI Compete in Retail
-
![]()
Piercing Through Industry Chaos: The Curtain Rises on Compliance for Autonomous Driving