Salesforce: AI Agent 'Struggling in Delivery', Has the SaaS Leader Become a Value Stock?
 12/04 2025
 655
655
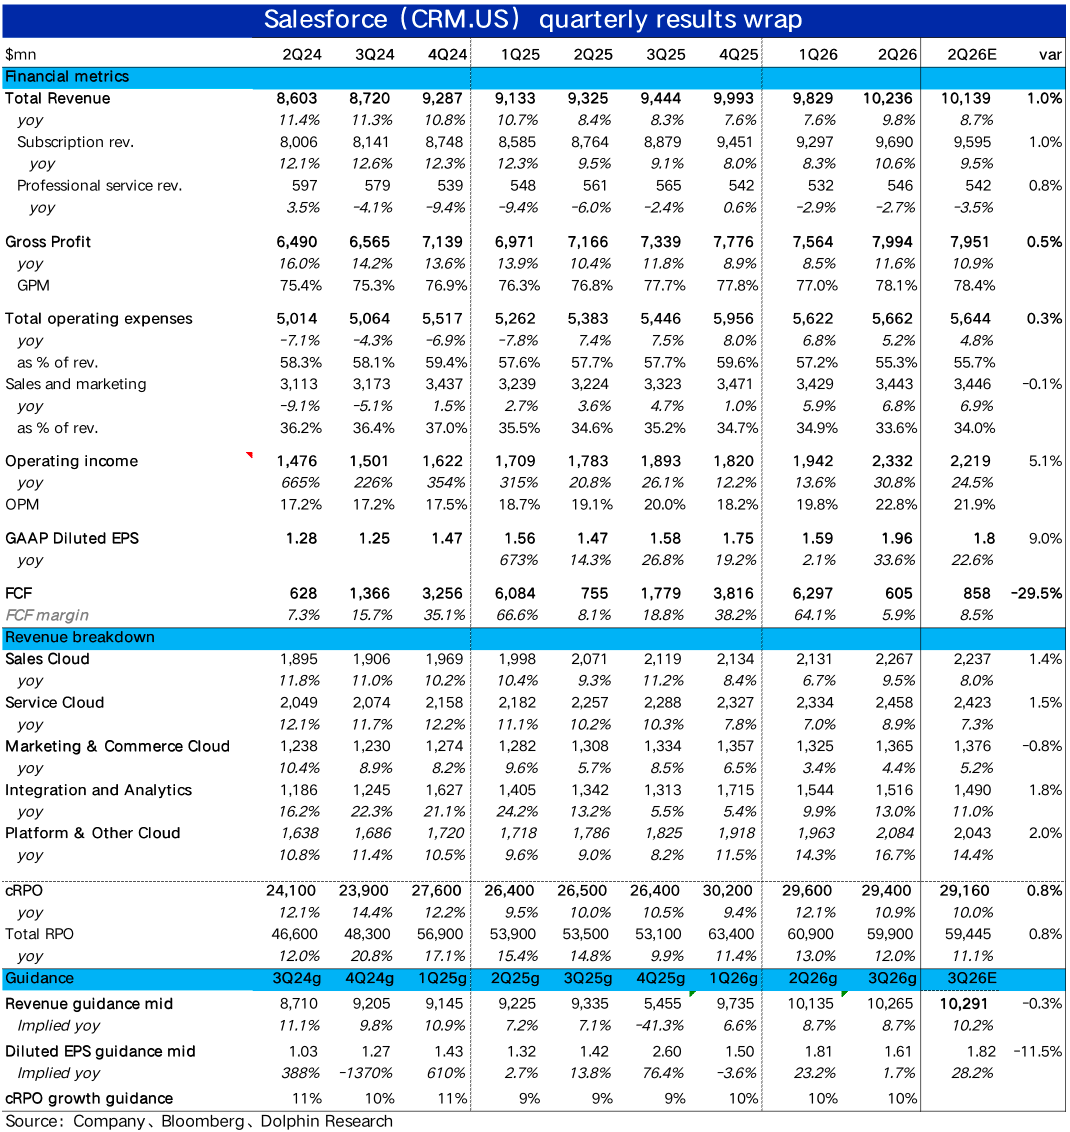
SaaS leader Salesforce announced its Q3 FY2026 financial results (ending October 31) after the U.S. market closed on December 4. Quarterly performance was lackluster, with most key metrics falling short of market expectations. The silver lining was that leading indicators (cRPO and new bookings) showed slight improvement on a low base. Notably, the company guided for significant growth improvement next quarter, primarily due to the consolidation of Informatica. Details are as follows:
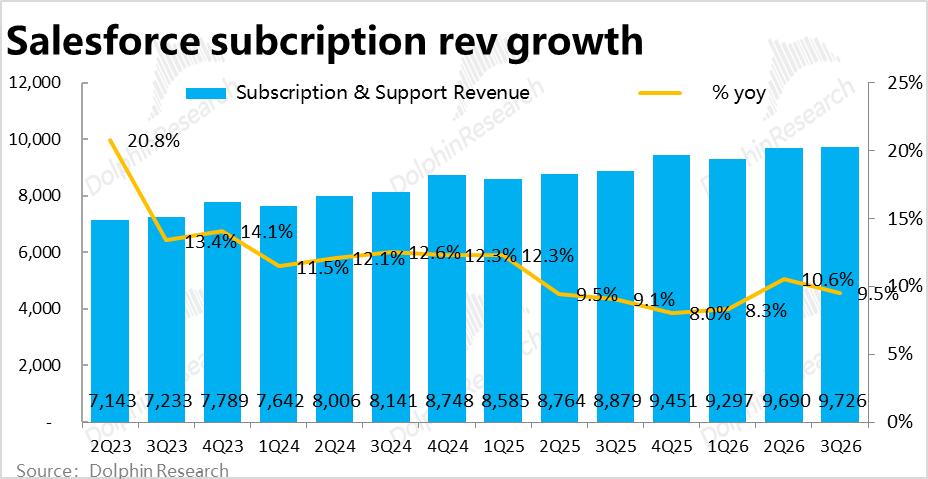
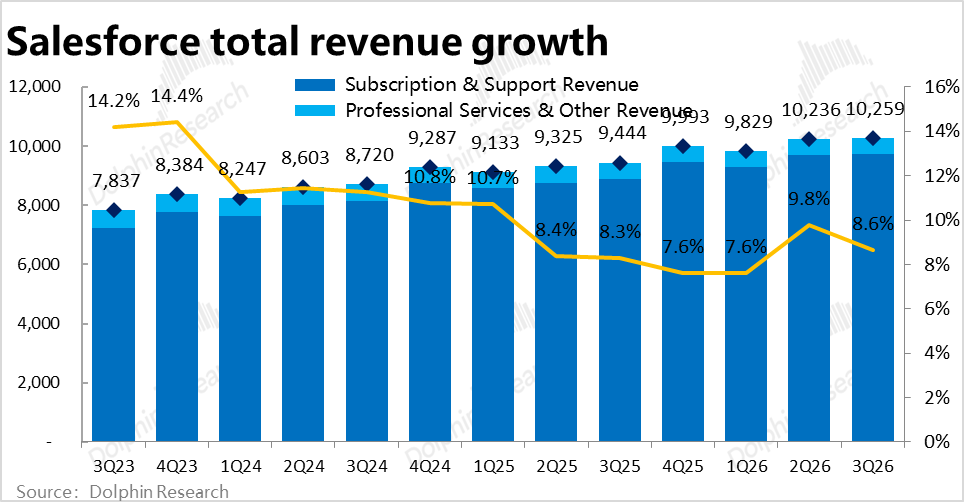
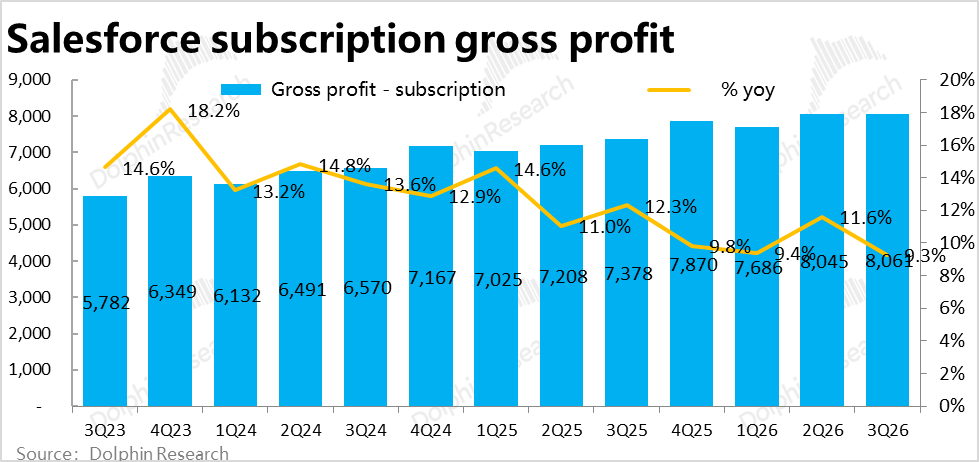
1. Overall revenue growth continues to slow, but AI business remains relatively strong: Core subscription revenue reached approximately $9.73 billion this quarter, up 9.5% YoY, slowing by another 1.1 percentage points sequentially and slightly missing market expectations.
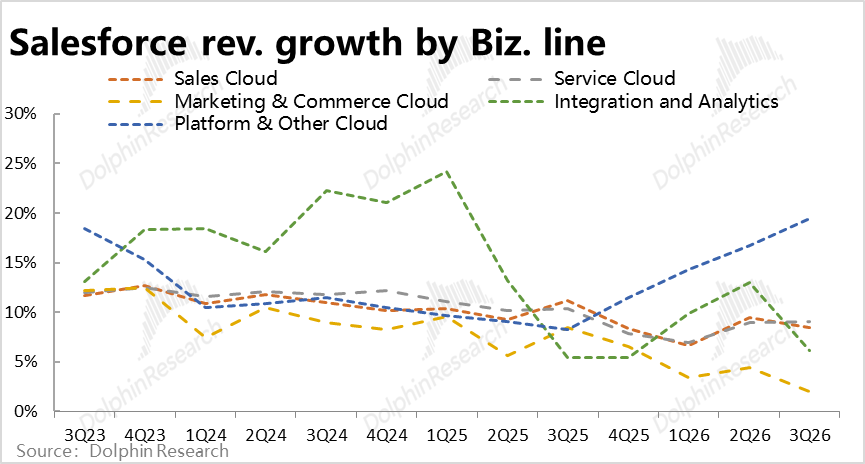
Breaking down by business segment, traditional business growth continues to decelerate, while Service Cloud and Platform Cloud—more closely tied to AI Agents—performed well.
Among them, Customer Service Cloud, where AI Agents are most widely applied, saw 9% YoY revenue growth, accelerating slightly by 0.1 percentage points sequentially. While not a significant acceleration, it stands out amid slowing growth in other segments.
Platform Cloud, the foundation for Agentforce services, performed even stronger, with revenue growing 19.5% this quarter, marking five consecutive quarters of acceleration (from approximately 8% to nearly 20%). Though lacking explosive single-quarter growth, the cumulative trend reflects AI Agents' role in driving expansion.
2. Leading indicators prove more resilient: Compared to slowing overall revenue growth, leading indicators such as cRPO and new contracts demonstrated greater resilience.
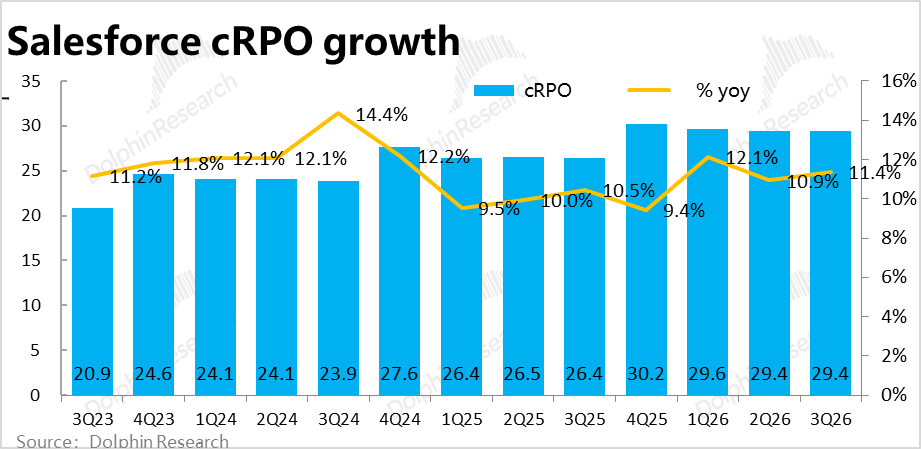
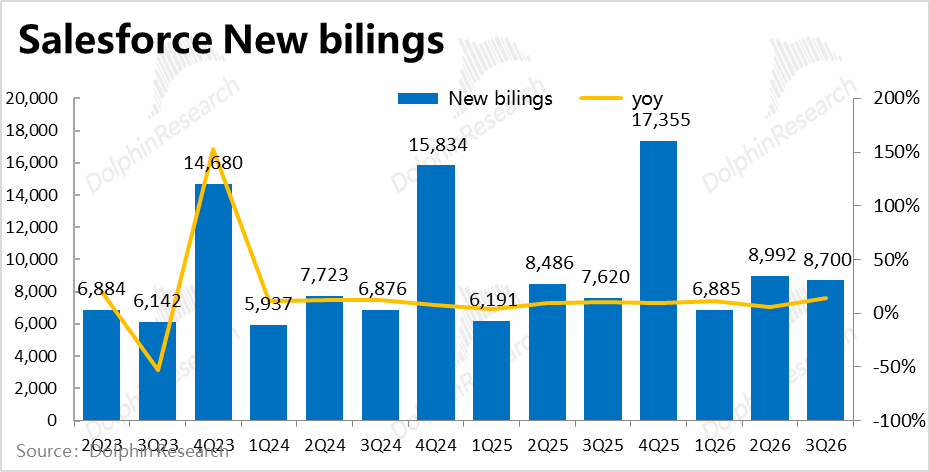
cRPO (current remaining performance obligations) grew 11.4% YoY in nominal terms this quarter, accelerating by 0.5 percentage points sequentially. New bookings reached $87 million, up 14% YoY.
However, sequentially, cRPO remained flat at $29.4 billion this quarter. Similarly, new bookings declined slightly from $89.9 million last quarter.
Thus, the acceleration in cRPO and new contract growth stems more from a low base last year rather than a true improvement, though it at least suggests potential for better performance next quarter compared to this quarter's slowing revenue growth.
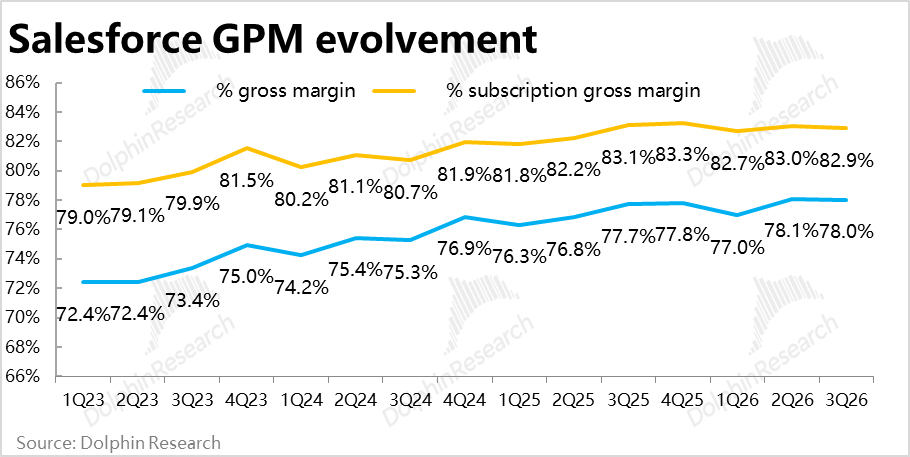
3. Will AI investments end the gross margin expansion trend? Due to generally lower margins in AI businesses, subscription revenue gross margins reached 82.9% this quarter, declining both YoY and sequentially, ending the sustained margin expansion trend since FY2021. Even with broad price increases for its products in August, the company couldn't fully offset this impact.
Additionally, professional services' gross loss rate widened slightly to -10.7% this quarter. With margins declining in both segments, the company's overall gross margin still improved slightly YoY due to a higher proportion of subscription revenue (which carries higher margins), but declined sequentially.
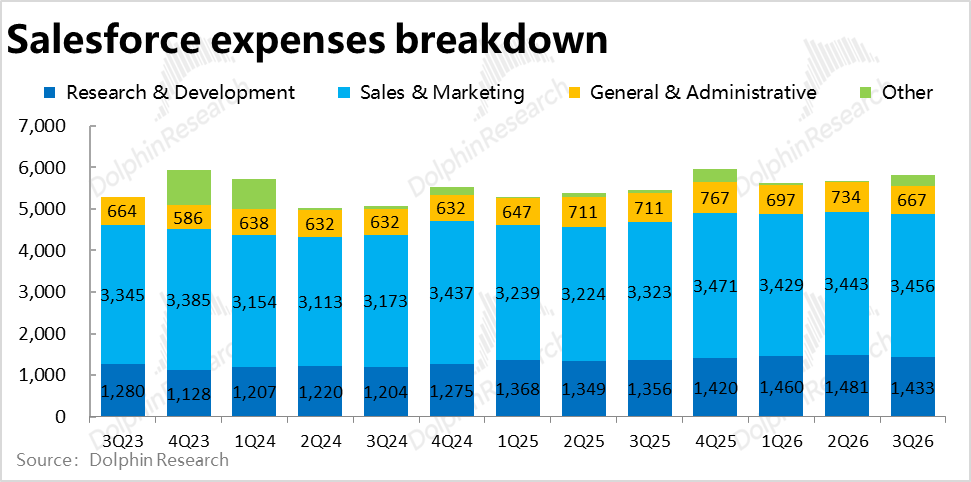
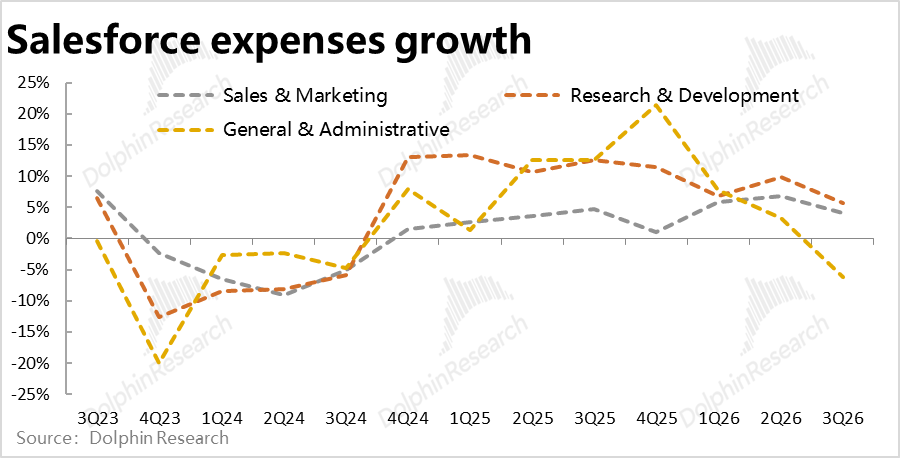
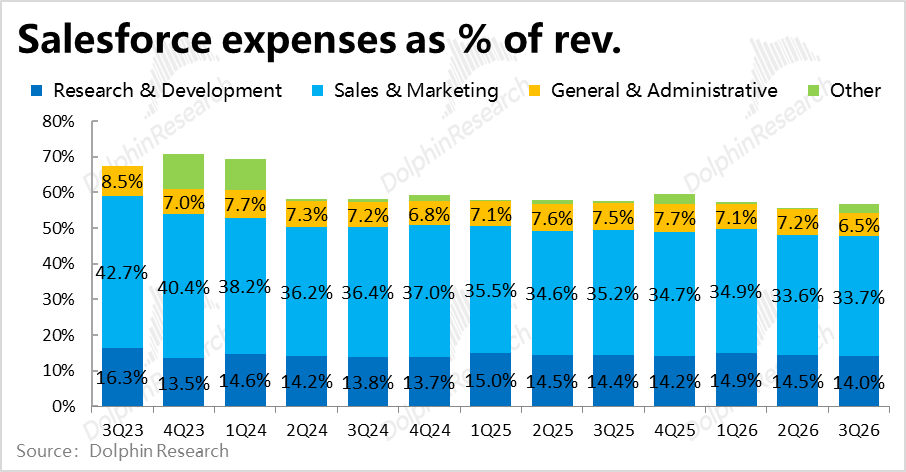
4. Cost control remains excellent: Salesforce's total operating expenses reached $5.82 billion this quarter, up 6.8% YoY, accelerating slightly from last quarter but below market expectations. Marketing and R&D expenses grew at mid-single-digit percentages YoY, while general and administrative expenses declined approximately 6% YoY. The company's spending hasn't significantly increased due to new business developments like Agentforce.
Excluding $260 million in restructuring costs (likely due to the Informatica acquisition), the three major expense categories grew just 3.1% YoY, with the restructuring costs masking stronger cost control.
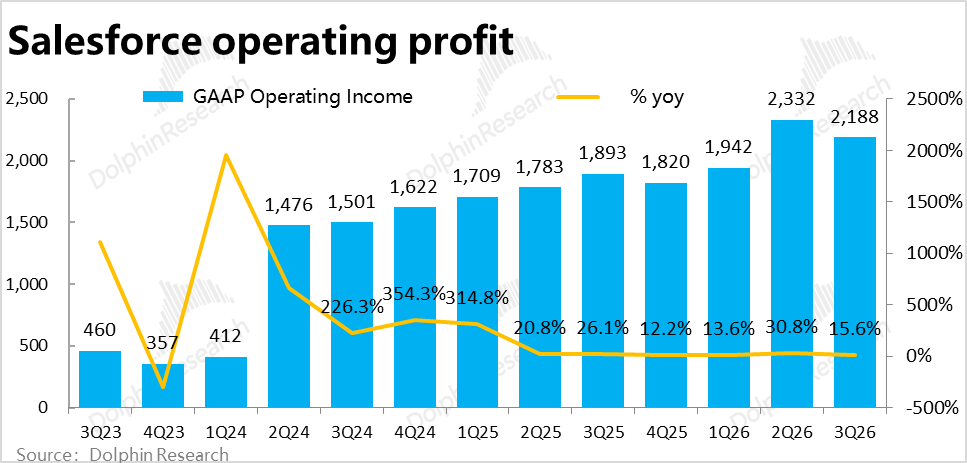
5. Profit growth remains solid but shows signs of weakening: With gross margins still improving YoY and cost control remaining effective, GAAP operating margin reached 21.3% this quarter, up 1.3 percentage points YoY. Operating profit grew 15.6% YoY, still a respectable pace.
However, sequentially, the margin improvement narrowed significantly from last quarter's 4 percentage points as gross margins began to decline, indicating a weakening trend. Actual profits also fell slightly short of sell-side expectations.
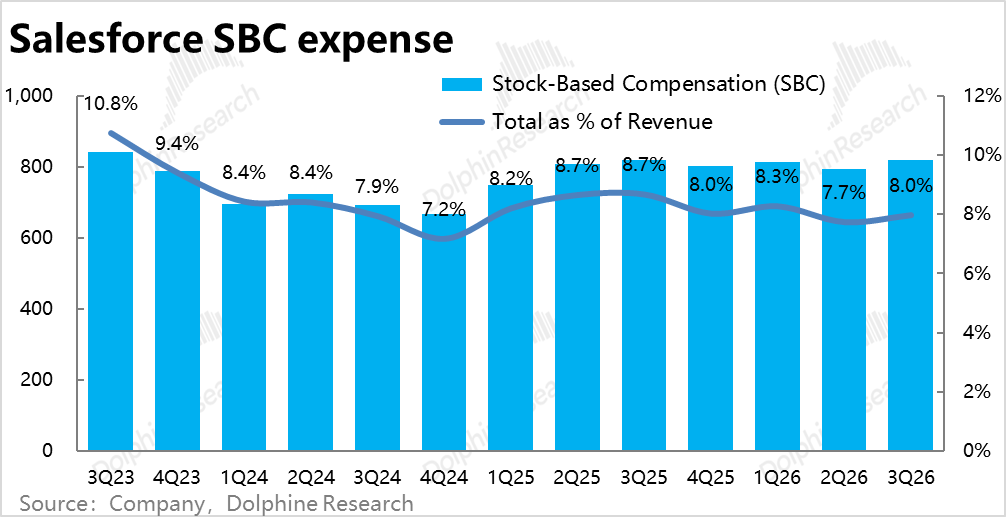
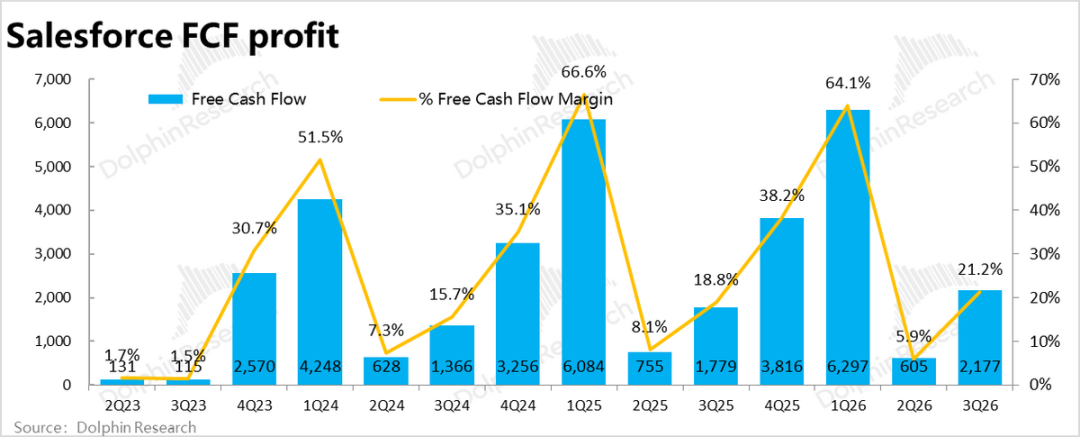
Excluding non-cash expenses (such as stock-based compensation and amortization from M&A), free cash flow—which the company focuses on more—reached $2.18 billion this quarter, roughly in line with operating profit. The cash flow margin stood at 21%, slightly below market expectations of 22%.
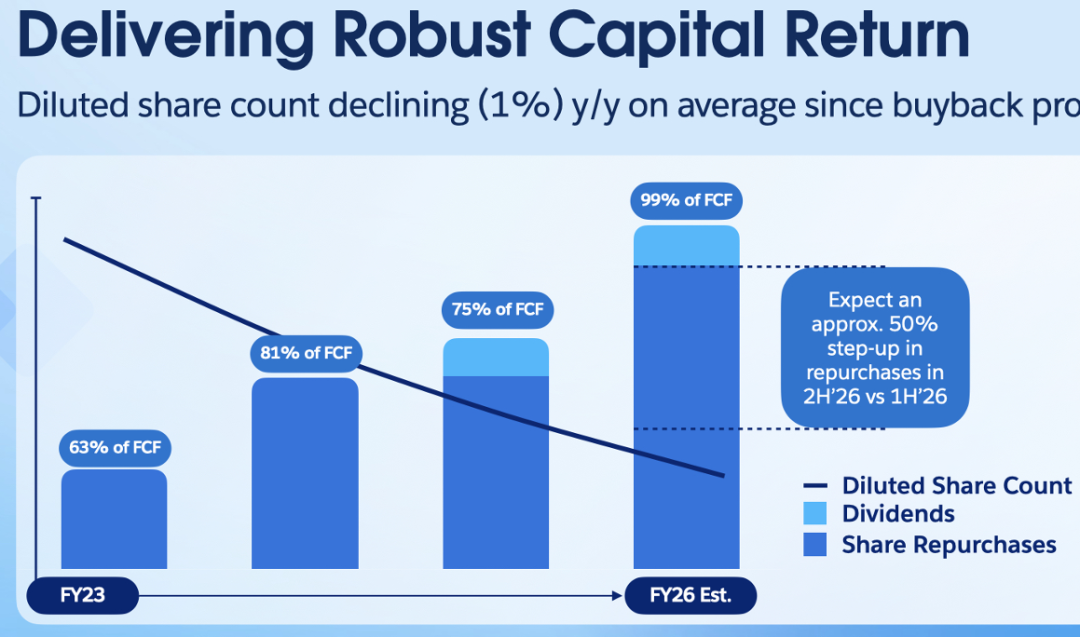
6. Shareholder returns rise as promised: As committed at the previous Dreamforce conference, shareholder returns surged in the second half of the fiscal year. This quarter, the company returned $4.2 billion to shareholders through repurchases and dividends, equivalent to approximately 1.8% of its current market cap—a substantial amount.
Dolphin Research View:
As seen above, Salesforce's quarterly performance was far from impressive, falling short of market expectations across the board (except for cost control). Trends show continuing revenue growth deceleration and margin weakening. While cost control remains excellent and profit growth holds up, the profit-to-revenue growth gap is narrowing due to AI-related margin pressures.
This quarter's results arguably reinforce the market's biggest concern about the company: sluggish growth with no signs of acceleration.
That said, these results reflect past performance, while future prospects and guidance matter more. Leading indicators like cPRO and new bookings, though not robust, at least suggest potential revenue growth stabilization ahead.
Structurally, while traditional businesses deteriorate, AI-related Platform Cloud and Service Cloud show relatively better performance, maintaining the vision that AI Agents could reignite growth acceleration.
Looking ahead at guidance and outlook:
1) In the near term, the company guided for revenue growth to accelerate to 11%-12% next quarter, with cPRO growth reaching 15%—both significant accelerations from this quarter. This indeed hints at a growth rebound.
However, a closer look reveals that the improvement stems mainly from the Informatica acquisition, contributing 3 percentage points to revenue growth and 4 percentage points to cPRO growth. Excluding this impact, organic growth would show little acceleration, implying stabilization rather than meaningful speedup in the core business.
The true bright spot in guidance is that the company raised its FY2026 free cash flow growth forecast to 13%-14% YoY. At the midpoint, this implies next quarter's free cash flow could exceed $5 billion, up 32% YoY—significantly higher than this quarter's growth and above current market expectations of $4.8 billion (though some consolidation impact may exist, which the company didn't quantify).
Overall, next quarter should see roughly stable growth and significant profit improvement.
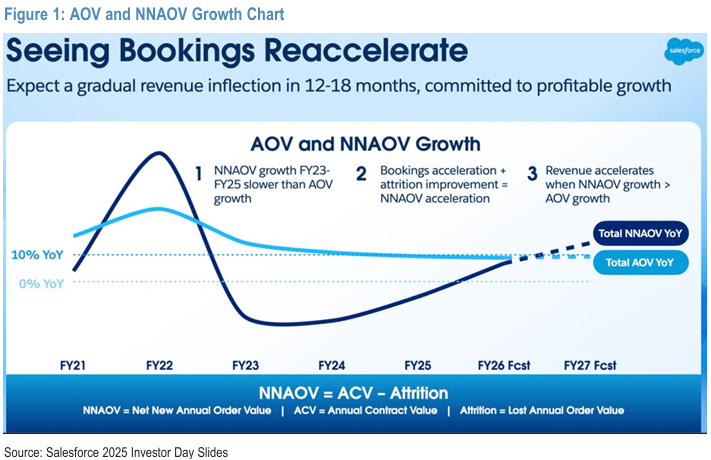
2) Additionally, at October's Dreamforce conference, the company provided two critical long-term outlooks. First, as shown below, its disclosed NNAOV (Net-new Annual Order Value, representing net new contract value after excluding lost old contracts) has gradually improved after negative growth in FY2023-2025 and now shows momentum to break above 10% growth. As a leading indicator, the company expects this to translate into revenue growth acceleration within the next 12-18 months.
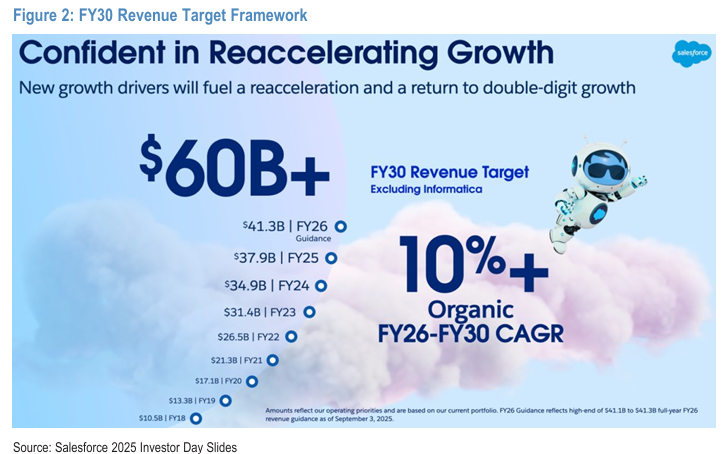
From a longer-term perspective, the company set a FY2030 revenue target of $60 billion (excluding Informatica consolidation), implying a CAGR of around 10% for FY2026-2030. While not a significant acceleration from current levels, this at least counters market fears of continued deceleration to mid-single-digit growth barely outpacing GDP.
The company also expects adjusted operating margins to reach approximately 40% by FY2030, up about 5 percentage points from FY2026 levels. At this guidance, GAAP post-tax operating profit would reach approximately $18 billion in FY2030. Applying a mature 15x PE, this implies a market cap of around $270 billion—about 20% upside from current levels. While not enormous, this provides some valuation support.
Furthermore, as mentioned earlier, the company announced increased shareholder returns in the second half of the fiscal year, planning to return nearly all FY2026 free cash flow ($14 billion total) via repurchases or dividends. At current market cap, this represents about 6.3%.
A more detailed valuation analysis has been published in the Changqiao App's 'Dynamic - Research (In-Depth)' section under an article with the same title.
Detailed Analysis Follows:
I. Salesforce Business & Revenue Overview
Salesforce pioneered the SaaS (Software-as-a-Service) concept in the CRM (Client Relationship Management) industry across the U.S. and globally. This model's key features include cloud-based services rather than on-premise deployment and subscription-based pricing instead of outright purchases.
Thus, Salesforce's business and revenue structure comprise two main categories: 1) Over 95% of revenue comes from various SaaS subscription services; 2) The remaining ~5% derives from professional services like project consulting and product training.
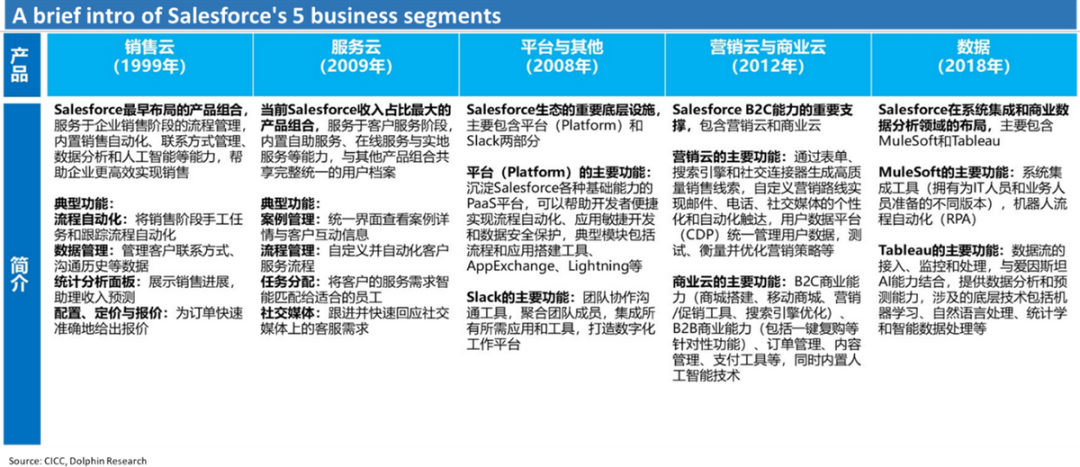
Breaking down the dominant subscription revenue further, it consists of five major SaaS service categories with roughly equal revenue scales:
① Sales Cloud: The core CRM business and the company's earliest offering, focusing on enterprise sales process management tools such as customer contact, quoting, and order signing.
② Service Cloud: Another core business, encompassing customer service-related functions like customer information management and online support.
③ Marketing & Commerce Cloud: Marketing Cloud systematizes campaigns across search, social, email, and other channels; Commerce Cloud provides virtual storefronts, order management, payment, and other e-commerce functions.
④ Integration & Analytics: Salesforce's internal database services and business analytics tools, primarily consisting of MuleSoft and Tableau.
⑤ Platform Cloud (Platform & others): Infrastructure and services underlying other Salesforce SaaS offerings, similar to PaaS (Platform-as-a-Service). It also includes Slack, a team collaboration SaaS service akin to Microsoft Teams.
II. Traditional Businesses Weaken Further, While Agentforce-Related Businesses Perform Well
On the growth front, Salesforce's core subscription revenue reached approximately $9.73 billion this quarter, up 9.5% YoY but slowing by another 1.1 percentage points sequentially and slightly missing market expectations. In hindsight, growth remains quite sluggish, showing no signs of acceleration while continuing to decelerate.
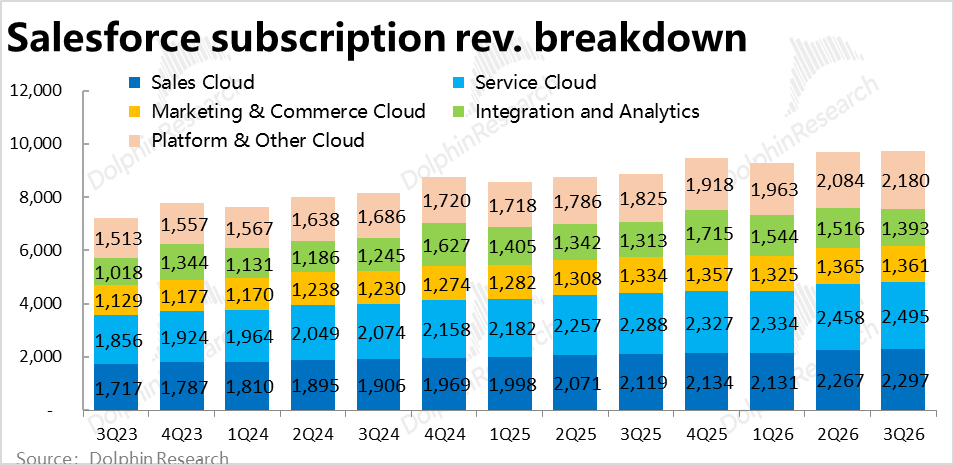
However, breaking down by business segment reveals that traditional businesses continue to slow, while Service Cloud and Platform Cloud—more closely tied to AI Agents—performed well:
1) Among traditional businesses, Commerce & Marketing Cloud remained the weakest, growing just 2% YoY and slowing by 2 percentage points. The foundational Sales Cloud grew 8.4%, also slowing by about 1 percentage point. The Analytics business (Integration & Analytics) grew 6%, a significant deceleration.
2) In contrast, Customer Service Cloud—where AI Agents see the broadest application—and Platform Cloud—the foundation for all Agentforce services—performed well. Service Cloud revenue grew 9%, accelerating slightly by 0.1 percentage points sequentially. While not robust, this stands out amid slowing growth elsewhere.
Platform Cloud performed even stronger, with revenue growing 19.5% this quarter and marking five consecutive quarters of acceleration (from approximately 8% to nearly 20%). Though each quarter's acceleration isn't explosive, the sustained trend reflects AI Agents' role in driving growth.
In this quarter, professional services revenue was approximately $530 million, with the year-on-year decline expanding to 5.7%, continuing to weaken. Overall, Salesforce's total revenue was approximately $10.26 billion, up 8.6% year-on-year. After excluding the positive impact of exchange rates, the growth rate was 8%, continuing to slow down and slightly below market expectations.
II. Compared to Weakening Revenue, Leading Indicators Remain Relatively Robust
Compared to the overall weakening revenue for the current quarter, leading indicators reflecting future growth prospects showed relatively better growth, though still not strong. Specifically, the nominal year-on-year growth rate of cRPO (short-term unfulfilled balance) for this quarter was 11.4%, accelerating by 0.5 percentage points from the previous quarter. However, the cRPO balance remained flat at $29.4 billion compared to the previous quarter.
Similarly, the value of newly signed contracts (new bilings) for this quarter was $87 million, up 14% year-on-year, showing a significant increase in growth. However, it was slightly lower than the $89.9 million in the previous quarter.
Therefore, overall, the higher growth rates of cRPO and newly signed contracts are more due to the lower base in the same period last year and do not represent a significant improvement. However, when compared to the continued slowdown in revenue growth, they still appear better.
III. Will the Momentum of Gross Margin Improvement, Sustained for Nearly Five Years, End Due to AI Investments?
In terms of gross profit, the gross margin for the core subscription business this quarter was 82.9%, showing a decline both year-on-year and quarter-on-quarter, ending the continuous upward trend in gross margins since fiscal year 2021. Although the company raised prices across its product line in August, it failed to prevent the decline in gross margins, likely due to the impact of higher-cost AI services and related investments.
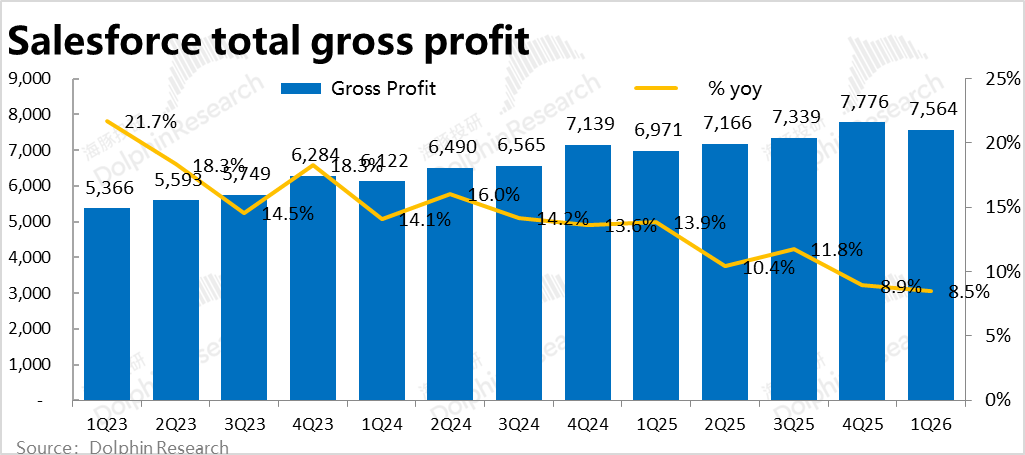
Meanwhile, the gross loss rate for the professional services business slightly widened to -10.7% this quarter. As the gross margins for both the subscription and services businesses deteriorated this quarter, but partially offset by a structural increase in the proportion of the higher-margin subscription business, the company's overall gross margin for the quarter was 78%. Although still higher year-on-year, it declined quarter-on-quarter.
Due to the fading amplification effect of gross margins, the company's total gross profit for the quarter was approximately $8 billion, up only 9.1% year-on-year.
IV. Cost Control Remains Very Limited
In terms of expenses, Salesforce's total operating expenses for the quarter were $5.82 billion, up 6.8% year-on-year, slightly accelerating from the previous quarter but slightly lower than market expectations and below the growth rates of revenue and gross profit. In other words, expense investments did not significantly increase due to the development of new businesses like Agentforce. Instead, cost control (with operating expense ratios down 1 percentage point year-on-year) offset the impact of weakening gross margins.
Specifically, marketing expenses, the largest component, were $3.46 billion, up 4% year-on-year; R&D expenses increased by 5.7% year-on-year, while administrative expenses decreased by 6.2% year-on-year. The year-on-year growth rates of all expense categories significantly declined from the previous quarter.
If we only consider the above three expense categories, actual year-on-year growth was only 3.1%. However, $260 million in restructuring expenses (presumably related to the acquisition of Infromatica) were recognized this quarter, weakening the effect of cost control.
V. Profit Still Outpaces Revenue, but the Lead Narrows
In terms of profit performance, as gross margins remained higher year-on-year and cost control remained effective, the operating profit margin under GAAP for the quarter reached 21.3%, still up 1.3 percentage points year-on-year. Therefore, operating profit for the quarter still grew by 15.6% year-on-year. Compared to single-digit revenue growth, profit growth was still decent.
However, in terms of marginal trends, as gross margins began to decline quarter-on-quarter, the increase in operating profit margins significantly narrowed from 4 percentage points in the previous quarter. Ultimately, GAAP operating profit was $2.19 billion, slightly lower than sell-side expectations.
Excluding non-cash expenses (such as stock-based compensation expenses and amortization and depreciation impacts from mergers and acquisitions), the company's more closely watched free cash flow for the quarter was $2.18 billion, roughly in line with operating profit. The cash flow profit margin was 21%, also slightly lower than market expectations of 22%.
- END -
// Republication Authorization
This article is an original work by Dolphin Research. Republication requires authorization.
// Disclaimer and General Disclosure
This report is for general comprehensive data purposes only, intended for general viewing and data reference by users of Dolphin Research and its affiliated institutions. It does not take into account the specific investment objectives, investment product preferences, risk tolerance, financial situation, or special needs of any individual receiving this report. Investors must consult with independent professional advisors before making investment decisions based on this report. Any person making investment decisions using or referring to the content or information mentioned in this report assumes their own risks. Dolphin Research shall not be liable for any direct or indirect responsibilities or losses that may arise from the use of the data contained in this report. The information and data in this report are based on publicly available sources and are for reference purposes only. Dolphin Research strives for, but does not guarantee, the reliability, accuracy, and completeness of the relevant information and data.
The information or views mentioned in this report shall not, under any jurisdiction, be regarded as or considered an offer to sell securities or an invitation to buy or sell securities, nor shall they constitute recommendations, inquiries, or endorsements regarding relevant securities or related financial instruments. The information, tools, and data contained in this report are not intended for or proposed for distribution to jurisdictions where distribution, publication, provision, or use of such information, tools, and data contradicts applicable laws or regulations, or to citizens or residents of jurisdictions where Dolphin Research and/or its subsidiaries or affiliates are required to comply with any registration or licensing requirements in such jurisdictions.
This report only reflects the personal views, insights, and analytical methods of the relevant creators and does not represent the stance of Dolphin Research and/or its affiliated institutions.
This report is produced by Dolphin Research, and the copyright is solely owned by Dolphin Research. Without the prior written consent of Dolphin Research, no institution or individual may (i) produce, copy, reproduce, duplicate, forward, or distribute in any form of copies or replicas in any way, and/or (ii) directly or indirectly redistribute or transfer to other unauthorized persons. Dolphin Research reserves all related rights.
-
![]()
ByteDance, DJI, and Xiaohongshu Secure Top Three Positions Among China’s Fastest-Growing Unicorns
-
Tesla's in-car voice system in China is finally learning to 'understand human language'
-
![]()
Foreigners Are Amazed: Chinese Electric Vehicle Drive Systems Unveil Innovative 'Poses'
-
![]()
700,000 Brothers and the Future of Robots: Behind JD.com's 'Nirvana Plan'
-
![]()
Zhipu's Trillion-Dollar Valuation: A New Chapter for China's AI
-
![]()
Is Laifen, a 'Dyson Alternative' on the Rise, Now Ensnared by the 'Alternative Curse'?
-
![]()
Beyond Patents: Insta360 and DJI Compete in Retail
-
![]()
Piercing Through Industry Chaos: The Curtain Rises on Compliance for Autonomous Driving