Oracle: Is the High-Stakes Bet on AI Computing Power Worth the Odds?
 04/28 2026
 486
486
Based on Dolphin Research's previous analysis of Oracle, the core judgment is that Oracle is essentially similar to a 'larger' CoreWeave. The key point is that the explosive growth in demand for AI computing power could drive the company's computing power leasing revenue to grow by more than tenfold or even higher.
The main issue is the uncertainty of AI demand versus the certain upfront Capex investments and debt-funded investments, which bring the risk of significant bad debts if the AI bubble bursts.
Overall, the company is a speculative investment with relatively low certainty, where risks and opportunities coexist, and the potential for both upward and downward movement is significant.
In this valuation piece, Dolphin Research will focus on the following questions:
1) The composition and future growth prospects of each business segment—traditional business vs. AI business.
2) How large is the AI computing power revenue scale implied by the company's guidance? How high is the probability of achieving this goal?
3) How significant is the impact of investments and debt incurred due to AI? How much profit will the AI business ultimately contribute?
4) What is the investment value of Oracle under different scenarios?
Here is a detailed analysis.
I. Forecasting Framework—'Building Blocks'
Based on our previous analysis, Oracle is currently in a severely bifurcated state:
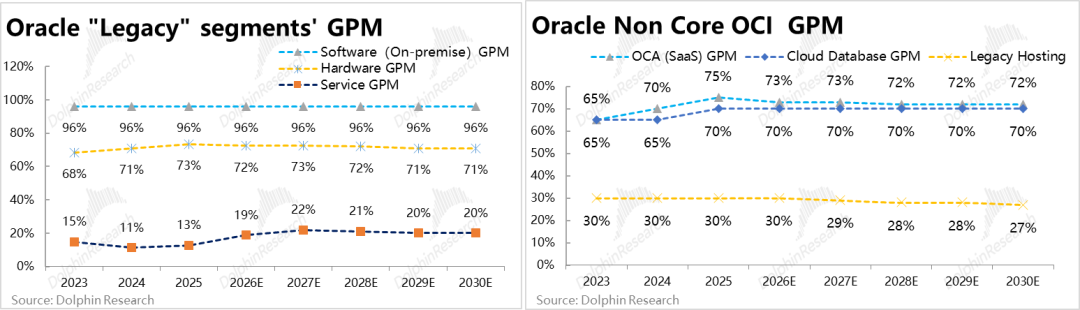
a. On one hand, all businesses outside of OCI are largely approaching a 'retirement' phase. Even OCA SaaS has seen revenue growth of only slightly over 10% in recent years, while revenue growth for 'legacy' businesses such as Software, Hardware, and Services is only in the low single-digit percentages.
This segment, which still accounts for about 70% of the company's total revenue in FY26, can be said to have almost no upside, but on the other hand, because this segment is already mature, it offers high visibility into future performance—future revenue is relatively clear, providing the typical high gross margins (generally 60%–70% or higher) and stable cash flows characteristic of software businesses. This can be seen as the 'foundation' part of Oracle's business and valuation building blocks.
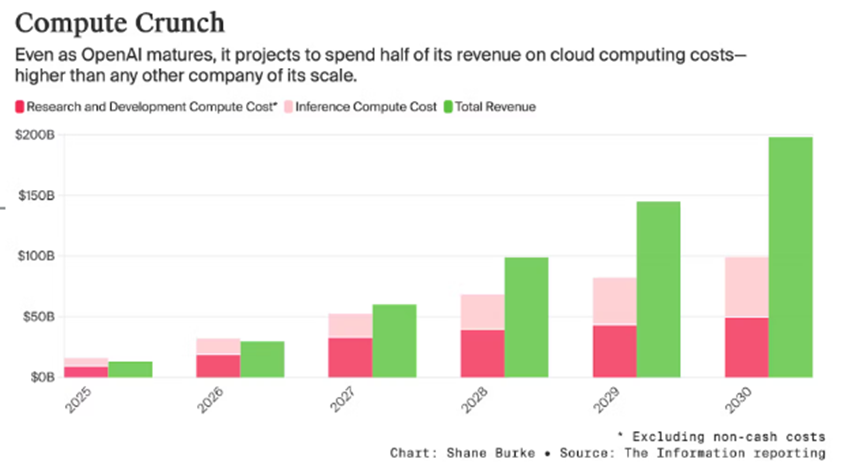
b. On the other hand, the critical OCI segment (including IaaS + PaaS cloud businesses) presents significant opportunities and risks. For optimists, according to the company's long-term guidance from FY25 to FY30, Oracle's total revenue is expected to grow nearly 4x from $57 billion to $225 billion, with about 92% of the incremental revenue ($155 billion) coming from the OCI segment alone. Moreover, the actual incremental revenue from AI could eventually be higher than this guidance.
However, on the flip side, the demand for AI computing power is highly concentrated among a few large customers and requires massive upfront Capex investments, resulting in the company experiencing net cash outflows of about $10 billion for two consecutive quarters, with interest-bearing debt reaching 2.4x the book value of equity. The company bears significant balance sheet risks and the possibility of shareholder equity being wiped out.
In summary, this can be described as extremely high uncertainty—there is the potential for multiple times revenue growth from the AI business, but there is also the possibility of significant losses for the company and its shareholders due to judgment or execution errors in aggressive expansion and computing power construction.
c. In response to this extreme bifurcation, Dolphin Research's valuation analysis framework for Oracle is divided into two parts: first, briefly review the 'foundation' type businesses outside of OCI and estimate the company's 'foundation' value based on this segment. Then, overlay expectations for the OCI business under different scenario assumptions to jointly form an analysis and judgment of the company's overall value.
1.1 Overview of 'Foundation' Type Businesses
After determining the overall framework, the first step is to establish expectations for the 'foundation' type businesses outside of OCI as a basis. Specifically, the 'foundation' businesses include: the OCA SaaS business under the Cloud segment, traditional software business (sales of software licenses + support and maintenance), hardware sales business (servers, databases, etc.), and consulting services (user training, etc.) in four parts.
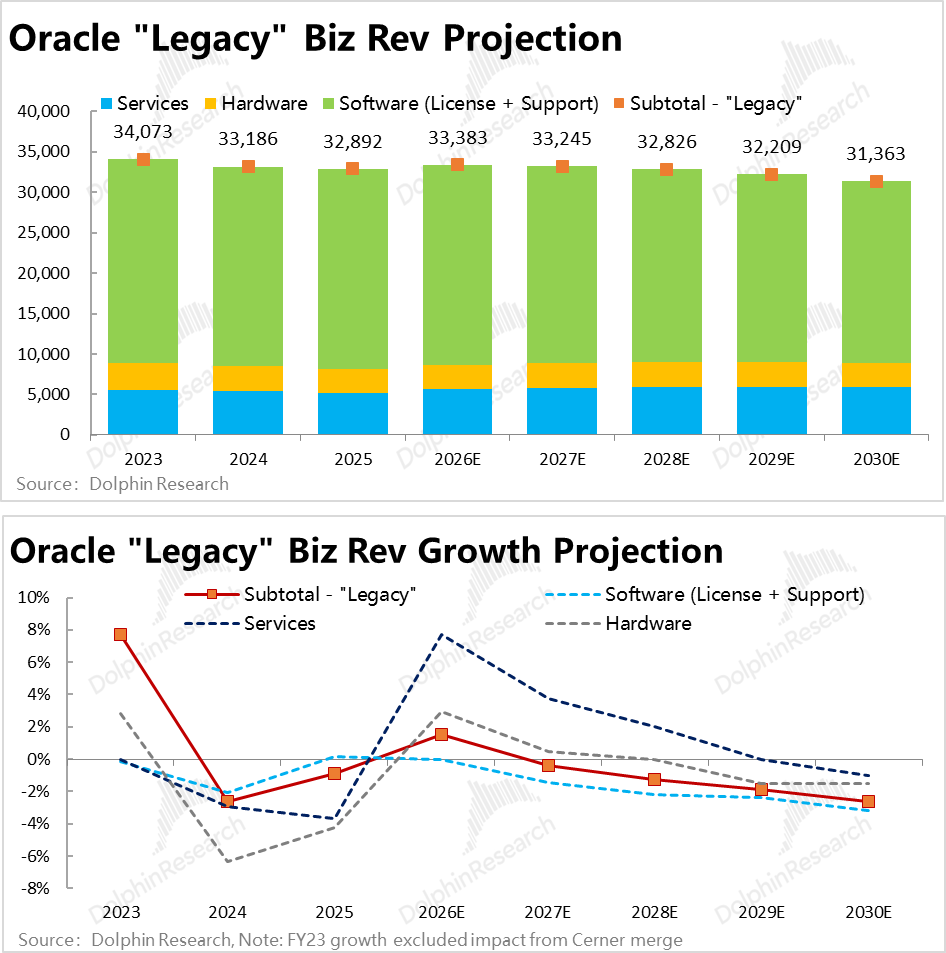
Software + Hardware + Consulting—Chronic Decline: For these three traditional segments, considering past actual performance and the two major trends of software cloudification & AIization, Dolphin Research believes that, based on simplicity, effectiveness, and caution, the basic assumption is that traditional software and hardware businesses will continue their previous trend of slight year-over-year revenue decline.
The following is Dolphin Research's specific forecast for these segments. Overall, the expected compound annual growth rate (CAGR) for the combined revenue of these three 'foundation' type businesses is -2% from FY26 to FY30.
Steady Growth in OCA: As for the OCA SaaS segment (currently accounting for over 20% of the company's total revenue), it can be further divided into two product lines—a. the core product line Strategic Back-Office, covering comprehensive back-office management modules such as ERP, HCM, and SCM; and b. other products primarily consisting of industry-vertical SaaS, which is a relatively weaker business for the company, with revenue growth rates in the past few years hovering only in the positive or negative single-digit percentages.
The Back-Office product line, which accounts for over 60% of OCA's total revenue, can be further divided into the Fusion suite and the Netsuite suite, depending on whether it targets large enterprises or medium-sized or startup companies.
According to announcements, the quarterly revenue for both Fusion ERP and Netsuite ERP in the past two quarters was approximately $1.1 billion each, of similar scale, together accounting for about 55% of the OCA segment's revenue. (The company discloses revenue for these two products separately, indicating their significant importance.)
Cross-referencing industry data, Oracle is indeed a leader in the back-office management system segment within the software application space, with market share generally ranking in the top 3. As shown in the table below, Oracle ranks second or third in market share for the three main modules of CRM, ERP, and SCM, behind only SAP and Salesforce, the two largest leaders. However, Oracle ranks relatively lower in modules such as Analytics and IT Operations, showing a clear contrast in strengths and weaknesses.
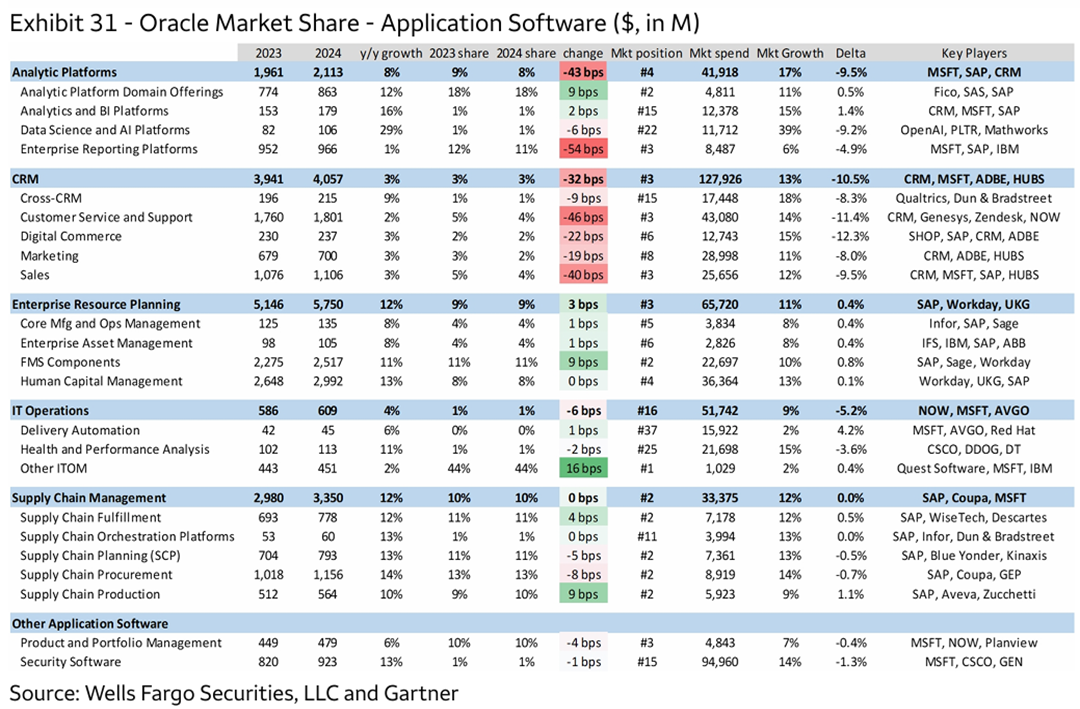
In terms of specific forecasts, considering that the revenue growth rates for Fusion and Netsuite ERP businesses have remained at 15%–25% over the past 2–3 fiscal years, showing strong momentum, and that Oracle is indeed a leader in back-office management systems, Dolphin Research's basic assumption is that the Strategic Back-Office product line will maintain a compound annual growth rate of about 15%–16% from FY26 to FY30, driving the overall OCA segment's revenue to grow at an average rate of 12% during the same period.
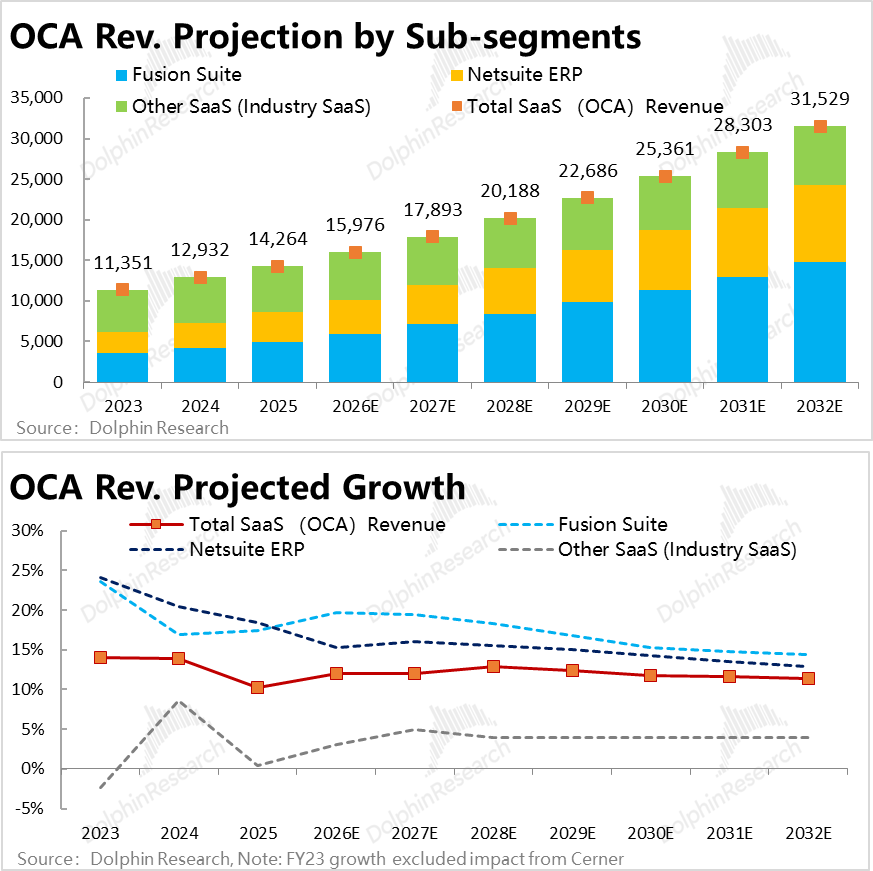
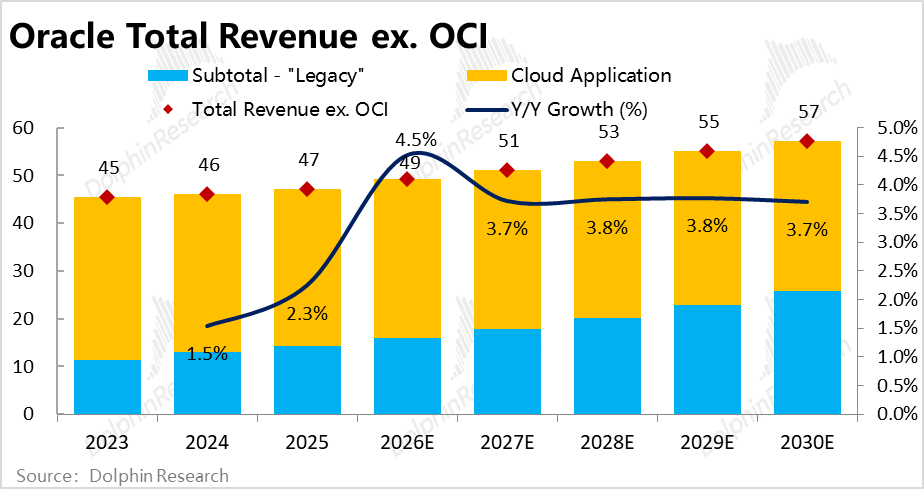
Summarizing the expectations for the 'Legacy' and OCA SaaS businesses, our revenue forecast for all of Oracle's businesses excluding OCI is approximately growth from about $49 billion in FY26 to $56.7 billion in FY30, with a CAGR of 3.6%, 1 percentage point lower than the CAGR implied by the company's official guidance.
So, what situations might cause actual revenue to deviate from these basic assumptions? Dolphin Research believes the main scenarios are: a. Negative scenario: Rapid evolution of AI quickly replaces traditional commercial software, causing the company's traditional software business and even SaaS business revenue to actually plummet rather than decline gradually; b. Optimistic scenario: Oracle attracts new customers and generates cross-selling through the explosive growth of its OCI business, driving a recovery in the growth of 'foundation' businesses.
However, we believe that the likelihood of significant cross-selling driven by the AI computing power business is currently low, due to the customer base structure of the AI computing power leasing business—concentrated among a few cloud computing giants and AI Labs, rather than a large number of conventional enterprises. It is hard to imagine that companies like OpenAI would adopt Oracle's other SaaS software or database services simply because they lease Oracle's computing power.
Conversely, while the risk of AI replacing traditional commercial software is probably low in the short term, given the current rapid iteration of AI, it cannot be ruled out. Therefore, overall, Dolphin Research believes the probability of the negative scenario occurring is higher than that of the optimistic scenario, and it is advisable to be pessimistic and conservative rather than overly optimistic about revenue growth expectations for traditional software and hardware businesses.
1.2 In-Depth Look at OCI Business
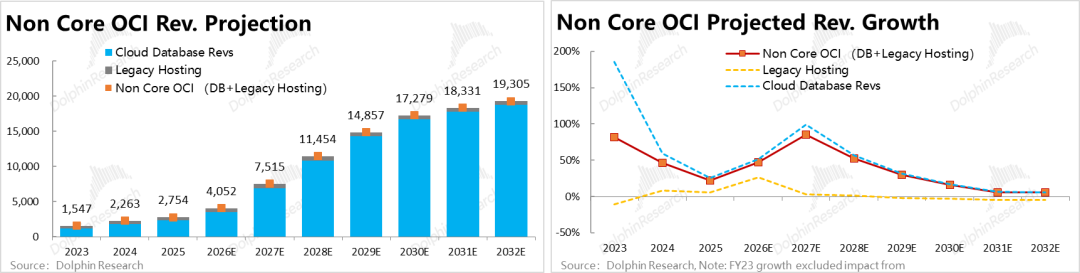
Next, let's further understand and break down the most critical OCI segment. Based on relevant research, OCI can be further divided into three sub-segments—Legacy business, Cloud Database (Database) business, and Core OCI business—i.e., the narrowly defined IaaS computing power leasing business (correspondingly, we classify Legacy + BD Cloud as non-core Non-Core businesses). Specifically:
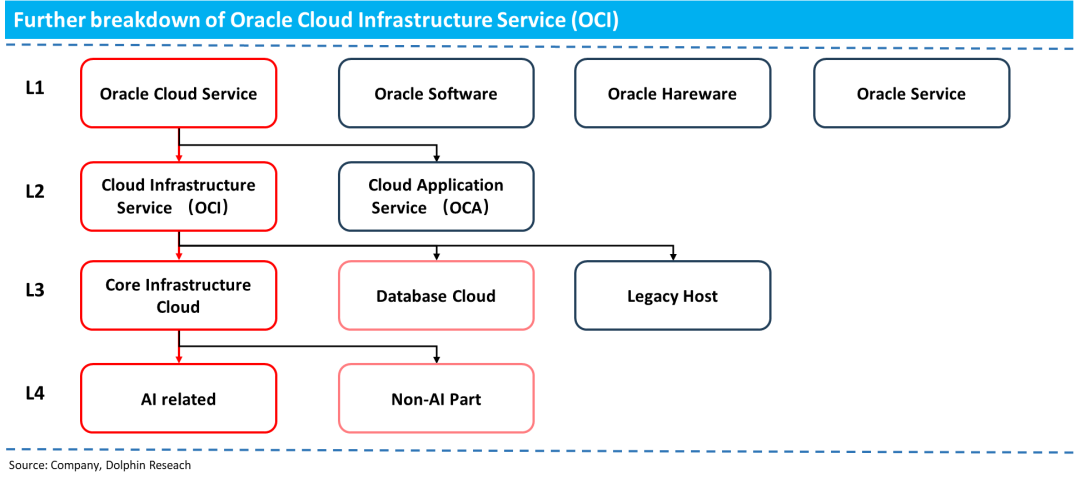
1) Legacy Hosting Business: This mainly includes outdated businesses left over from the OCI Gen1 era and some managed hosting services—i.e., managing Oracle software or database systems deployed by users locally or on other clouds.
This segment accounts for less than 3% of OCI revenue and has been slowly contracting in recent years, making it of low importance.
2) Advantageous Database Business: As a specialized product segment since Oracle's inception, databases remain one of Oracle's most differentiated and competitive products. Flagship products include Autonomous Database and Exadata Cloud Service (ExaCS), among others.
Referring to mainstream investment bank estimates, the revenue volume of the database business under the OCI segment in FY25 is about $2.0–2.1 billion, accounting for approximately 22%–23% of OCI segment revenue. Moreover, it still maintains year-over-year growth of 20%–30%+ in FY24–FY25. Thus, the growth momentum of the cloud database business is still good.
3) Critical Core OCI Business: After stripping away the above two segments, what remains is Core OCI—i.e., the narrowly defined IaaS business, which leases computing infrastructure (Compute + Storage + Network, three major categories) through different methods such as bare metal, virtual machines, or large-scale clusters.
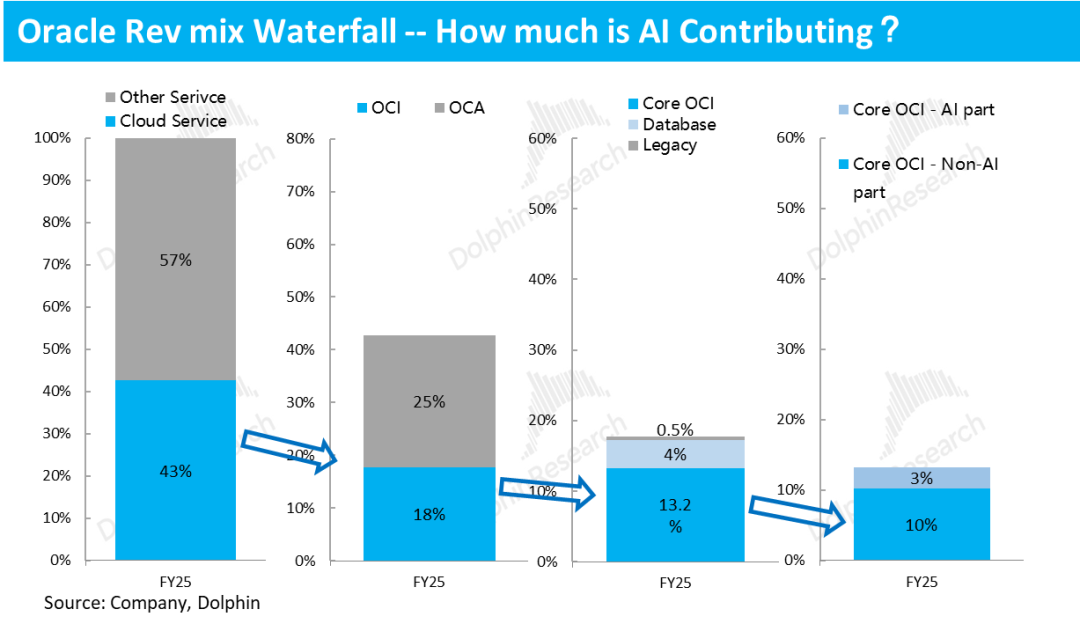
According to estimates, Core OCI's total revenue in FY25 is approximately $7.5 billion+, making it the main part of the entire OCI segment and contributing about 3/4 of the segment's total revenue.
Further breaking down Core OCI based on whether it is related to AI demand, it can be divided into 'AI-related' and 'non-AI-related' parts.
a. Non-AI computing power leasing is also growing rapidly: Referring to outsider breakdown estimates, the revenue of the non-AI segment (mainly targeting conventional enterprise users and primarily CPU-based) in FY25 is slightly below $6 billion, still larger in volume than the AI business. Moreover, the non-AI segment still has 40%–50% revenue growth in FY24–FY25.
Thus, even without the promote (tuī dòng, 'push') of the AI wave and contributions from large OpenAI orders, Core OCI still has significant growth potential relying solely on traditional demand (more from traditional enterprise users)—after all, in FY25, Core OCI's total revenue only accounts for about 5% of the entire IaaS industry's size, leaving some room for further market share gains.
b. AI computing power leasing—Wild Card: After peeling away layer by layer, what remains is the AI computing power (primarily GPU-based) leasing business, which is still small in volume and proportion but directly benefits from the AI wave and has the greatest impact on the company's subsequent performance.
According to estimates, as of FY25, the revenue volume of AI computing power leasing is still less than $2 billion, accounting for only about 3% of the company's total revenue. However, growth is very rapid, with revenue growth rates forecasted to exceed 200% annually from FY23 to FY26.
1.3 What Will OCI's Revenue Be?
1) Non-Core OCI Segment
First, the small-scale Legacy Hosting business is likely to continue its declining trend in revenue scale with the sustained development of AI and cloud computing, with expectations of low single-digit percentage year-over-year declines in the subsequent period.
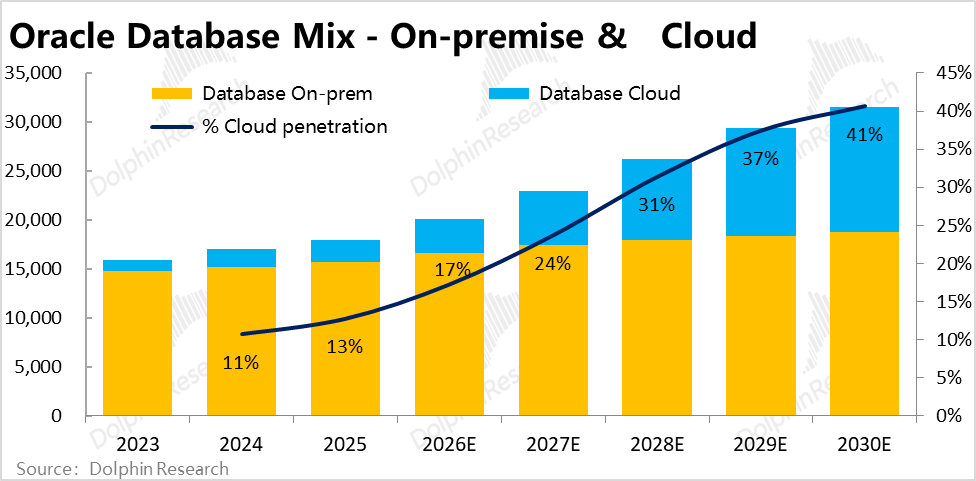
As for the cloud database, we believe it should still achieve relatively good growth in the future for the following reasons: a. Databases are the company's traditional strength, and growth momentum has been good in recent years; b. As of FY25, the company's cloud database revenue still accounts for less than 15% of the revenue from database business under the traditional license model, leaving significant room for migration from on-premises deployment to the cloud.
2) Core OCI Segment
After completing revenue forecasts for all the aforementioned businesses, we address the final 'Wild Card'—Core OCI, which refers to the IaaS business. Objectively speaking, due to the high uncertainty in AI development, accurately predicting the demand for computing power in the AI industry over the next five years is indeed challenging.
Therefore, Dolphin Research believes that relying on the company's guidance as a baseline assumption remains the simplest and most effective approach. Our task is to verify the achievability of the company's guidance and make appropriate adjustments based on the verification results.
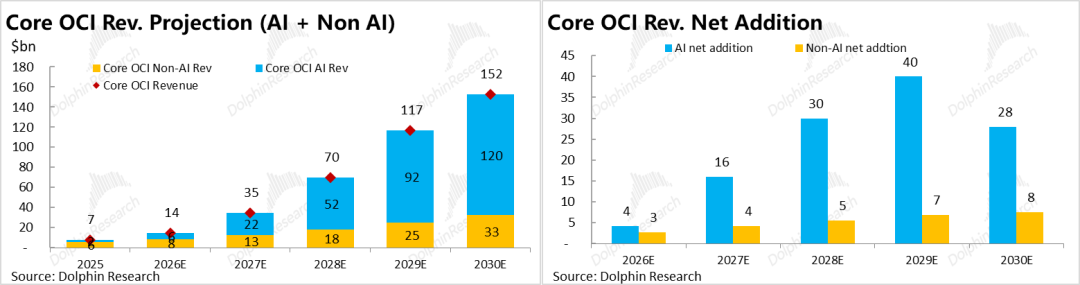
According to the company's latest OCI segment revenue guidance following the F3Q26 earnings announcement, and after excluding the non-Core OCI portion calculated above, the implied Core OCI revenue needs to explode from over $14 billion in FY26 to over $150 billion in FY30. This includes:
a. AI segment: Surging from less than $6 billion in FY26 to $120 billion in FY30, representing a multiple-fold increase.
b. Non-AI segment: Relatively 'stable' but still rapid growth from $8 billion in 2026 to $33 billion in 2030, with a compound annual growth rate (CAGR) of 42%. (We believe AI computing power leasing has a slight driving effect on traditional computing power leasing.)
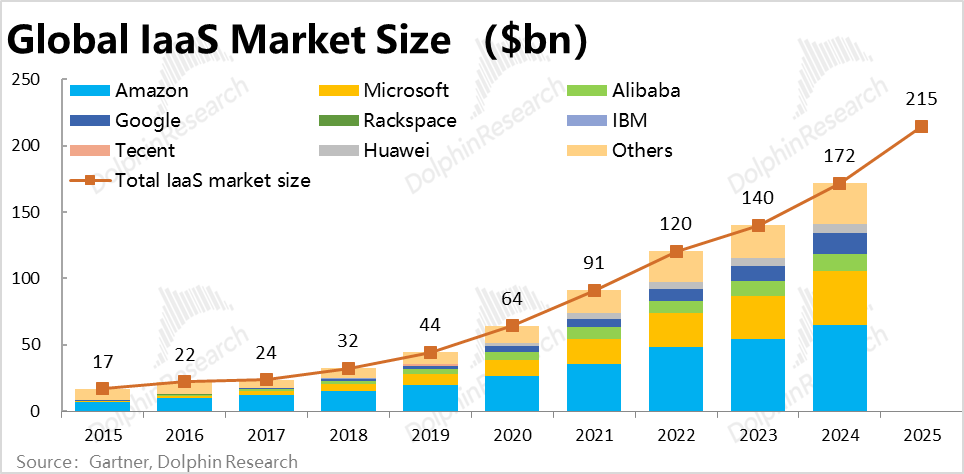
How can we understand the magnitude of $150 billion in IaaS business revenue? From two perspectives:
a. According to Gartner, the global IaaS revenue is approximately $215 billion in the 2025 calendar year (including only the IaaS segment, thus lower than the company's disclosed total cloud business revenue). In other words, the annual revenue of Core OCI by FY30 (approximately the 2029 calendar year) will be equivalent to over 60% of the global IaaS revenue in 2025.
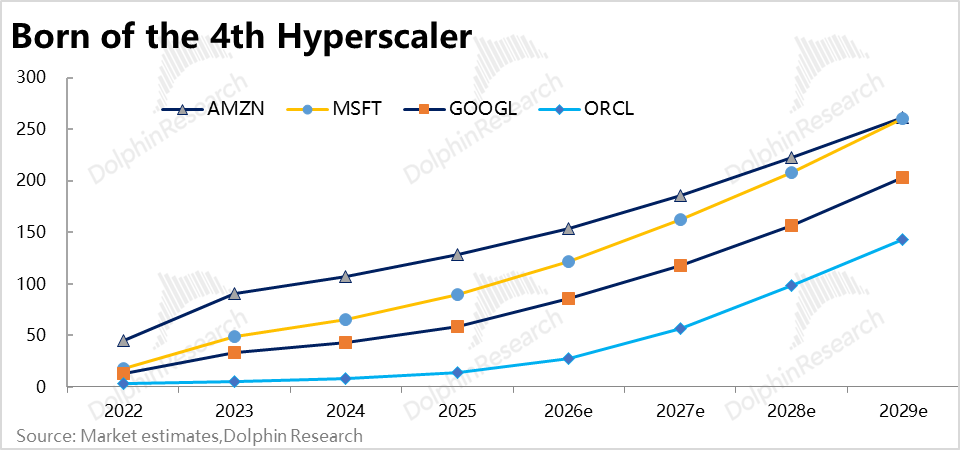
b. From a dynamic perspective, referencing recent market expectations, OCI's revenue volume by FY30 (including IaaS + databases + Legacy) will approach Google Cloud's total revenue and be equivalent to 50%-55% of AWS and Azure's revenue scales. This implies that by FY30, Oracle will officially become the fourth cloud computing Hyperscaler.
II. Can the Core OCI Revenue Target Be Achieved?
2.1 Cross-Validation: Is $100 Billion in Revenue More Realistic?
As seen from the above and previous analyses, Oracle's investment value largely depends on the extent to which the company can realistically achieve the aforementioned Core OCI computing power leasing revenue targets. Therefore, the main purpose of this section is to cross-judge the likelihood of Oracle achieving these revenue targets through multiple methods.
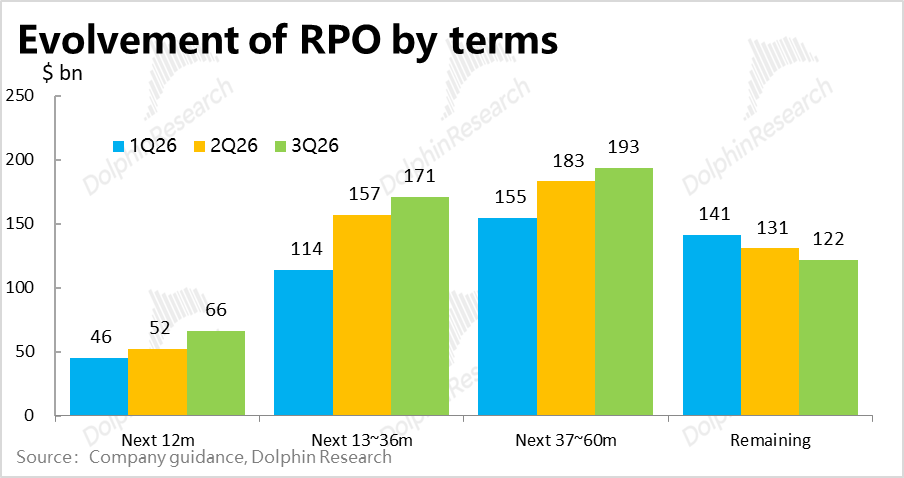
1) Method 1—Backlog Validation: According to the company's latest RPO (Remaining Performance Obligations) balance disclosed after the F3Q26 earnings announcement, compared to our baseline revenue expectations for the Core OCI business, we can see that the $17.1 billion in unfulfilled backlog for the next 13-36 months covers over 91% of the combined Core OCI revenue for FY28-29.
However, the $19.3 billion in backlog for the next 37-60 months can only cover 58% of the combined Core OCI revenue expectations for FY30-31.
In simple terms, Oracle's current backlog can support a peak annual Core OCI revenue of approximately $100 billion at most, leaving a significant gap from the $150 billion target for FY30.
(Note: The RPO does not have official disclosure on which specific businesses it comes from, but referencing some investment bank views, at least 90% is from the OCI segment, and the proportion from OCI in longer-term RPOs should be higher. Therefore, for analysis convenience, RPOs beyond 12 months are all considered to be from the OCI segment, especially Core OCI IaaS-type businesses.)
2) Method 2—Is Computing Power Supply Sufficient?: Another validation logic—how many GW-scale data centers are needed to achieve approximately $150 billion in annual IaaS revenue? Does Oracle currently have or plan for a sufficient scale of computing power in its data centers?
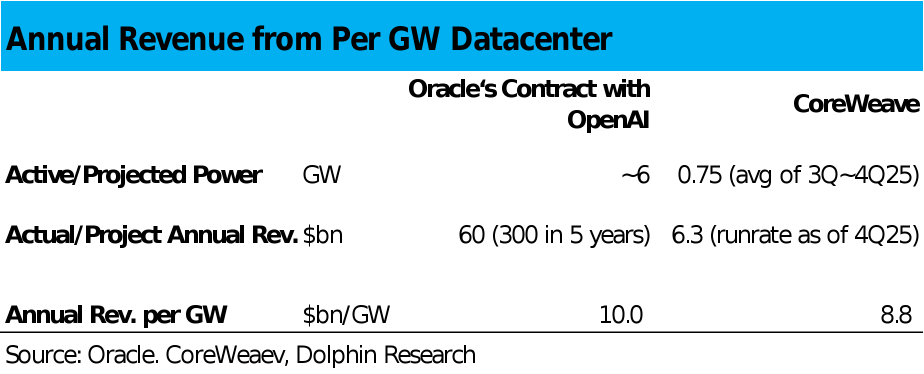
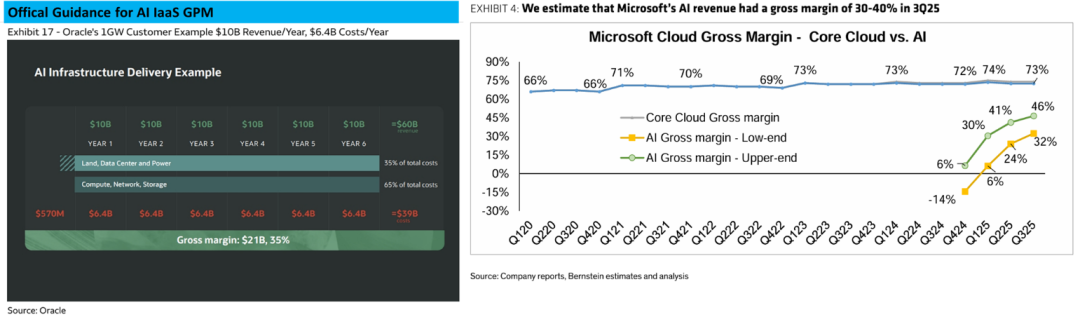
According to Oracle management, a 1GW-scale data center generates approximately $10 billion in annual revenue. This figure is validated by two examples: First, the contract between OpenAI and Oracle, involving approximately 6GW of computing power over five years for $300 billion, corresponds to $10 billion in annual revenue per GW. Additionally, CoreWeave's revenue in Q4 2025, annualized to $6.3 billion, with an average of 0.75GW of computing power deployed during 4Q, generates approximately $8.8 billion in revenue per GW.
Thus, it is evident that 1GW of computing power corresponds to approximately $10 billion in annual revenue is generally accurate, while Oracle's revenue per GW appears slightly higher than CoreWeave's. Therefore, Oracle needs at least approximately 15GW of deployed computing power to achieve the set Core OCI revenue target.
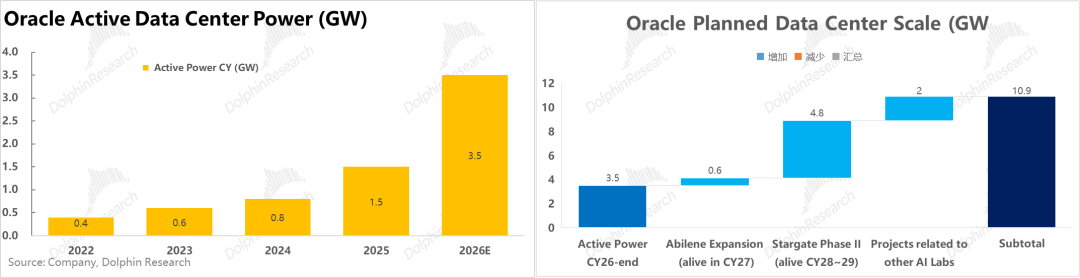
So, how much computing power has Oracle currently deployed or planned in its data centers? Referencing market forecasts, the company had approximately 3.5GW of deployed computing power by the end of 2026. The planned computing power to be deployed after 2026 is approximately 7.4GW—including 0.6GW from the Alibene project expansion, approximately 4.8GW from the Stargate Phase II stage, and a combined total of approximately 2GW from collaborations with other AI Labs such as xAI and Meta (this portion lacks public disclosure for verification).
Therefore, Oracle's total planned computing power to date is approximately 10.9GW, corresponding to a supported peak Core OCI revenue of approximately $110 billion, close to the peak calculated using the backlog amount method, and still falling short of the $150 billion revenue target for FY30.
Another cross-validation metric is that as of F3Q26 (end of February this year), the company announced committed data center leasing expenses of $261 billion. Assuming an average leasing period of 17 years and an annual leasing cost of $2 billion per GW, this implies that the company has contracted but not yet utilized approximately 7.7GW of data center scale, roughly equivalent to the planned computing power center scale to be deployed after 2026. This also indicates that the company has not yet reserved enough data centers to support a total computing power scale of 15GW.
The peak Core OCI revenue indicated by the three data points—backlog RPO, planned computing power center scale, and committed data center leasing expenses—are generally consistent and all suggest that Oracle still has an annualized revenue gap of approximately $40-50 billion to fill.
3) Method 3—Is There Sufficient Demand?
From a more fundamental perspective of end-user demand, how much computing power will large model providers require? And how much can end-users consume?
First, according to Information's forecast at the end of 2025, OpenAI aims to achieve $200 billion in annual revenue by 2030, with total computing power expenditures reaching approximately $100 billion, with inference and training expenditures each accounting for about 50%. Using this as a reference, Oracle's current contract with OpenAI (annual $60 billion) actually accounts for approximately 60% of OpenAI's total computing power expenditures by 2030.
In other words, unless OpenAI's actual total computing power expenditures far exceed current expectations, it will not be easy for Oracle to rely on obtaining large additional orders (exceeding $10 billion annually) from OpenAI to fill the current gap between the visible $100 billion in annual Core OCI revenue and the $150 billion target. Logically, OpenAI would not overly rely on a single computing power supplier.
This means Oracle will likely need to rely on expanding its customer base to other large clients, such as Anthropic, to achieve the approximately $150 billion Core OCI revenue target. This conclusion is also consistent with the above judgments.
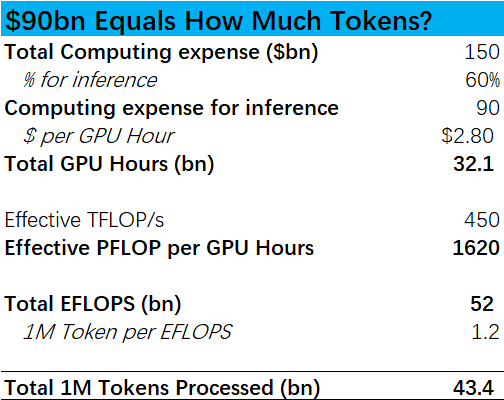
Finally, let's verify the feasibility of Oracle's 2030 revenue target from the perspective of end-user demand. For the company's $150 billion revenue target, we assume that 60%, or $90 billion, is used for inference and 40% for training (we believe a higher proportion of inference is more conservative, as training expenditures are phased (phased), while inference expenditures are continuous).
After some calculations, $90 billion in inference expenditures can roughly correspond to 400-450 billion million Tokens output (see the table below for details; due to many assumptions, this is only for reference on an order of magnitude). Referencing assumptions used in the market, if light users consume 10 million Tokens annually, this can support 4 billion light users globally; if heavy users (such as Agent users) consume 500 million Tokens annually, this can only support over 8 million users.
Moreover, the above only considers the end-user demand corresponding to Oracle's inference computing power revenue. The overall end-user demand for the entire industry may be more than five times the above estimate. Thus, it is evident that relying solely on light users of chatbots will find it difficult to support the current global surge in data center construction and the revenue targets of various cloud service providers. There must be a significant number of heavy users.
However, from another perspective, Dolphin Research believes that the actual number of future heavy users and the annual Token consumption per heavy user may far exceed the above basic assumptions. In short, we believe there will be sufficient total industry demand in the future to support Oracle in achieving $150 billion in Core OCI revenue. The question is more about whether Oracle can secure a sufficient market share.
Summary: From the above analysis, Dolphin Research believes that with the rapid increase in user penetration of Token-intensive applications like Agents, the total future market demand for computing power should be more than sufficient to support the data centers built by Oracle and other cloud computing companies. The main issue is that the company's current customer base and planned data center scale are insufficient to meet the company's long-term revenue targets.
In other words, the company needs to find more partners and data center suppliers to achieve its goals.
III. How Much Profit Can the Explosive Growth in AI Business Revenue Generate?
Next, we need to explore the incremental profits that the above revenue expectations can ultimately bring to Oracle. Therefore, we need to consider several core factors: the impact of the AI business on gross margin, Capex, debt & interest expenses.
3.1 How Significant Is the Impact on Gross Margin?
First, to better assess the impact of the explosive growth in AI computing power leasing business on the company's overall gross margin, Dolphin Research has broken down the gross margins of the company's various product lines based on market research, as shown in the figure below.
In summary, product lines outside of Core OCI can be categorized into three groups: a. Traditional software business has the highest gross margin, exceeding 90%, aligning with the business model of selling software licenses with nearly zero marginal costs. b. OCA SaaS business, hardware business, and the data cloud within the OCI segment generally have gross margins around 70%. c. The Legacy Hosting and consulting segments within the OCI segment have gross margins around 20%-30%.
For the gross margins of these non-Core OCI segments, our baseline expectation is that they will remain stable or slightly decline. This is one of the main differences between Dolphin Research's expectations and market expectations. The market expects traditional business gross margins to steadily improve, while we believe a more cautious approach is warranted.
Focusing on the main contradiction—the impact on the total gross margin primarily depends on two main factors: the rapid increase in the revenue share of low-gross-margin Core OCI, leading to structural changes, and the steady-state gross margin of the AI segment business.
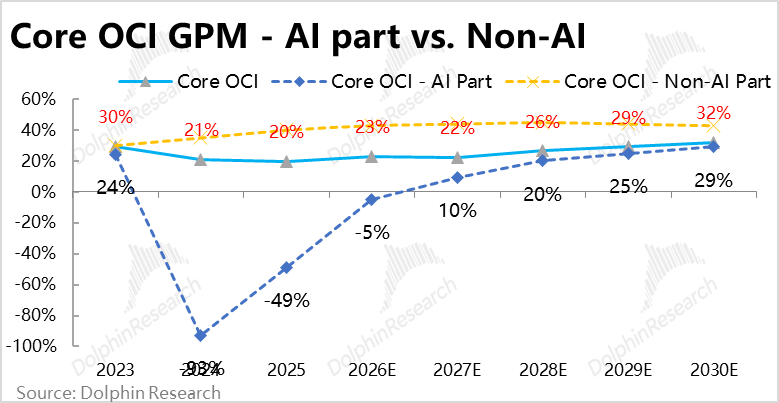
According to the company's recent official guidance, the steady-state gross margin for the AI-related computing power leasing business within the OCI segment will be 30%-35%.
Is this guidance reasonable and credible? Let's compare it horizontally: a. CoreWeave, whose business composition and cost structure are very similar to Oracle's AI computing power business, has a steady-state gross margin of approximately 25%, according to our previous calculations. b. According to Bernstein's forecast, Microsoft's gross margin for AI cloud revenue in Q3 2025 (calendar year) is approximately 30%-40%.
Dolphin Research believes that Oracle, which falls between CoreWeave and Microsoft in terms of technical strength and business scale, having an AI business gross margin between the two is logical. In other words, the company's gross margin guidance should be generally accurate.
As for why Oracle's gross margin is slightly higher than CoreWeave's, Dolphin Research believes that on one hand, Oracle's unit pricing (GPU/hour) can be slightly higher.
This can be verified by the earlier calculation showing that CoreWeave generates approximately $8.8 billion in revenue per GW, while Oracle generates about $10 billion. On the other hand, although their cost structures are similar, Oracle's significantly larger business scale should also provide some economies of scale advantages.
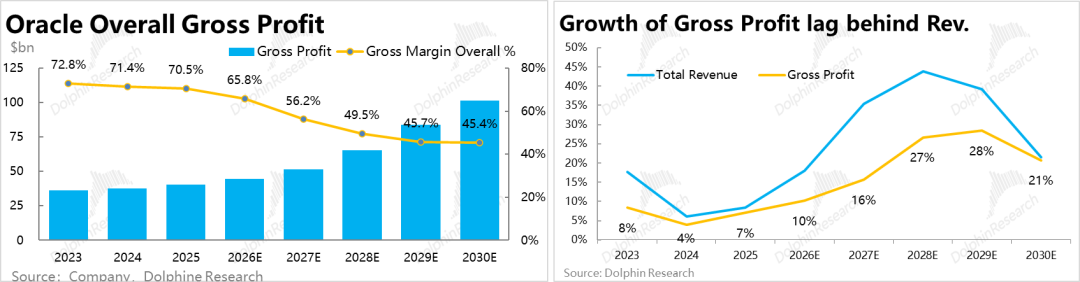
In terms of specific forecasts, based on the assumption that the gross margin of the non-AI portion of Core OCI remains roughly stable at just over 40%, while the gross margin of the AI portion turns positive for the first time in FY27 and approaches 30% by FY30, Oracle's overall gross margin is projected to decline from just over 70% in FY25 to around 45% by FY30.
As a result, although total revenue is expected to accelerate significantly between FY26 and FY30 driven by the AI business, total gross profit growth will lag behind revenue growth. Gross profit in FY30 will only be 2.3x that of FY26, compared to revenue reaching 3.3x over the same period. This suggests a scenario where growth does not translate proportionally into profit increases.
3.2 Capex, Debt & Interest Expenses
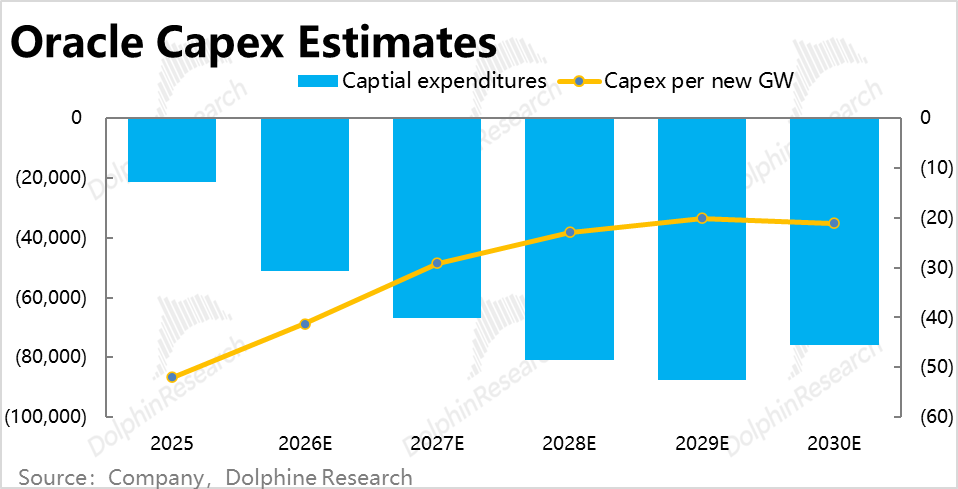
Regarding Capex, the company has officially guided that the Capex for each newly built 1GW computing center is approximately $25 billion. This is significantly lower than NVIDIA's previously stated range of $50-60 billion per GW, primarily because Oracle does not build its own data centers but instead leases completed 'shell' data centers from external suppliers.
Therefore, investments in facilities such as central buildings, power supply, and cooling will not be included in Oracle's Capex but will be reflected as rental expenses in costs.
Given Oracle's recent statement that 'in some customer collaboration projects, it will rely on customer advance payments to purchase equipment or have customers directly purchase GPUs for Oracle,' Dolphin Research believes that Oracle's actual Capex per new GW is likely to be lower than previous guidance. In our forecast, we assume $20 billion per GW.
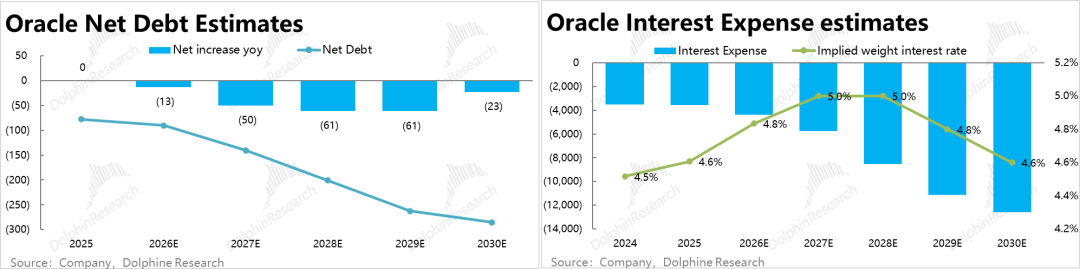
Turning to new debt and interest expenses, since the company has already been in a net debt position with tight free cash flow (primarily used for large share buybacks before AI investments, and now for AI Capex),
Dolphin Research conservatively assumes that 70-75% of the company's Capex in FY28-29 will be financed through new debt. By FY30, as Capex peaks and operating cash flow largely covers Capex, the proportion of new debt will decrease to 20% of Capex.
Combining this with Oracle's historical average debt interest rate and market expectations, we assume Oracle's average debt interest cost will fluctuate between 4.6-5%. Thus, Oracle's interest expenses will peak at approximately $11 billion by FY30, accounting for 5% of revenue that year.
This is also one of Oracle's significant advantages over CoreWeave, whose average borrowing cost exceeds 10%, causing interest expenses to account for 20% of revenue and severely compressing profits. Oracle is much less affected in this regard.
IV. Valuation Analysis
For the final valuation, following the framework established by Dolphin Research at the beginning, we divide the analysis into two parts: (1) all businesses except AI computing leasing, including three legacy businesses, the OCA SaaS business, and the non-AI computing leasing portion of the OCI segment; and (2) only the AI computing leasing business.
From the table below,
a. Non-AI Segment: Revenue is projected to reach approximately $103 billion by FY30 (CAGR of 13.6% from FY26-30), with a gross margin of 65% for this segment. We assume that expenses related to this segment will remain largely flat or decline slightly starting in FY26 (as the business is no longer growing significantly and requires minimal investment).
Under this assumption, the profit for this traditional business segment is expected to reach approximately $33 billion by FY30, with a valuation of **** (detailed valuation analysis has been published in the Changqiao App under 'Dynamic - In-Depth' in an article with the same title, hereinafter the same).
b. AI Segment - Optimistic Scenario: For this segment, we consider two scenarios. First, based on company guidance, if OCI achieves total revenue of nearly $160 billion by FY30, we estimate that the AI segment will contribute approximately $120 billion in revenue.
The gross margin for the AI segment is projected to reach 29% by FY30. Since the AI business is concentrated on serving a small number of large customers, with a single customer potentially contributing tens of billions in revenue, the Opex required for the AI business should be minimal, estimated at less than 7% of revenue.
Interest expenses are calculated based on the previously estimated total interest expense for FY30, minus the portion already attributed to the non-AI business, as the additional interest expense borne by the AI segment.
Under this optimistic scenario, the AI business's after-tax profit is estimated to be approximately **** by FY30 (detailed valuation analysis has been published in the Changqiao App under 'Dynamic - In-Depth' in an article with the same title).
c. AI Segment - Neutral Conservative Scenario: In the other scenario, based on our earlier analysis, the company achieving OCI revenue of over $100 billion is significantly more achievable, with the AI segment contributing approximately $75 billion in revenue. Other assumptions remain largely consistent with the optimistic scenario.
The AI segment's after-tax profit is estimated to be **** (detailed valuation analysis has been published in the Changqiao App under 'Dynamic - In-Depth' in an article with the same title).
Overall, Dolphin Research believes that the probability of the AI business completely collapsing is very low. The more likely risk is that Oracle's primary customer, OpenAI, may lose in future competition, forcing Oracle to find new customers for its built-out computing capacity, though not reducing it to zero. The most probable scenario is that the company achieves OCI revenue of around $100 billion, as currently indicated with high probability.
Regarding the optimistic scenario, Dolphin Research believes that given the accelerating pace of AI development and the rapid growth of compute- and token-intensive applications like Agents, the probability of Oracle ultimately meeting or even exceeding its revenue guidance is not low, offering significant potential for the company's value to rise further, though current visibility into this outcome remains limited. Betting on an upside option at prices corresponding to the neutral scenario may not be a bad move, in Dolphin Research's view.
- END -
// Reprint Authorization
This article is an original piece by Dolphin Research. Reprinting requires authorization.
// Disclaimer and General Disclosure
This report is for general comprehensive data purposes only, intended for general viewing and data reference by users of Dolphin Research and its affiliated institutions. It does not consider the specific investment objectives, investment product preferences, risk tolerance, financial situation, or special needs of any individual receiving this report. Investors must consult with independent professional advisors before making investment decisions based on this report. Any person making investment decisions using or referring to the content or information in this report assumes all risks. Dolphin Research shall not be liable for any direct or indirect responsibilities or losses that may arise from using the data contained in this report. The information and data in this report are based on publicly available sources and are for reference purposes only. Dolphin Research strives but does not guarantee the reliability, accuracy, or completeness of the information and data.
The information or opinions expressed in this report shall not, under any jurisdiction, be construed as or deemed to be an offer to sell securities or an invitation to buy or sell securities, nor shall they constitute recommendations, solicitations, or endorsements of securities or related financial instruments. The information, tools, and materials in this report are not intended for or Proposed work distribution to jurisdictions where distribution, publication, provision, or use of such information, tools, and materials would contravene applicable laws or regulations or require Dolphin Research and/or its subsidiaries or affiliates to comply with any registration or licensing requirements in those jurisdictions, nor to citizens or residents of such jurisdictions.
This report reflects only the personal views, insights, and analytical methods of the relevant contributors and does not represent the stance of Dolphin Research and/or its affiliated institutions.
This report is produced by Dolphin Research, and copyright is solely owned by Dolphin Research. No institution or individual may, without the prior written consent of Dolphin Research, (i) produce, copy, duplicate, reproduce, forward, or otherwise create copies or reproductions in any form, and/or (ii) directly or indirectly redistribute or transfer to other unauthorized persons. Dolphin Research reserves all relevant rights.
-
![]()
Tesla Restructures Its Balance Sheet
-
![]()
Accelerating the High-Speed Interconnection Upgrade of AI Computing Clusters! JONHON Releases ELSFP External Light Source Optical Connectors
-
![]()
Breaking the overseas blockade of volumetric holographic materials, this optical enterprise secures nearly 100 million yuan in financing!
-
![]()
Why Does Jensen Huang So Openly Praise China’s AI?
-
![]()
"Wudang" Unveiled: Arm China's Next-Gen AI VPU Redefines Video Encoding
-
![]()
From Energy Conservation and Carbon Reduction to AI Decision-Making: GECON East Intelligence and Chery Group Explore a New Green and Smart Paradigm for Automobile Manufacturing
-
![]()
WAIC 2026 Observation | AI Accelerates Towards the Core of Industries, Industrial AI Enters a Critical Phase
-
![]()
Volkswagen China Fires the First Shot in Foreign-Funded 'White Box Delivery'!