Salesforce: No Growth, No Profit—Can Its AI Story Still Stand Strong?
 05/29 2026
 601
601
As a stalwart in the traditional SaaS CRM sector, Salesforce has found itself significantly impacted by the 'AI substitution theory.' Following the market close on May 28, Salesforce unveiled its financial results for Q1 FY27 (ending in April), revealing a generally lackluster performance. The quarter's results were decent, with metrics largely aligning with market expectations and lacking any significant signals that could prompt a narrative reversal.
The guidance for the upcoming period was relatively subdued, featuring a downward revision to profit margin expectations amid no clear signs of revenue acceleration. Key observations include:
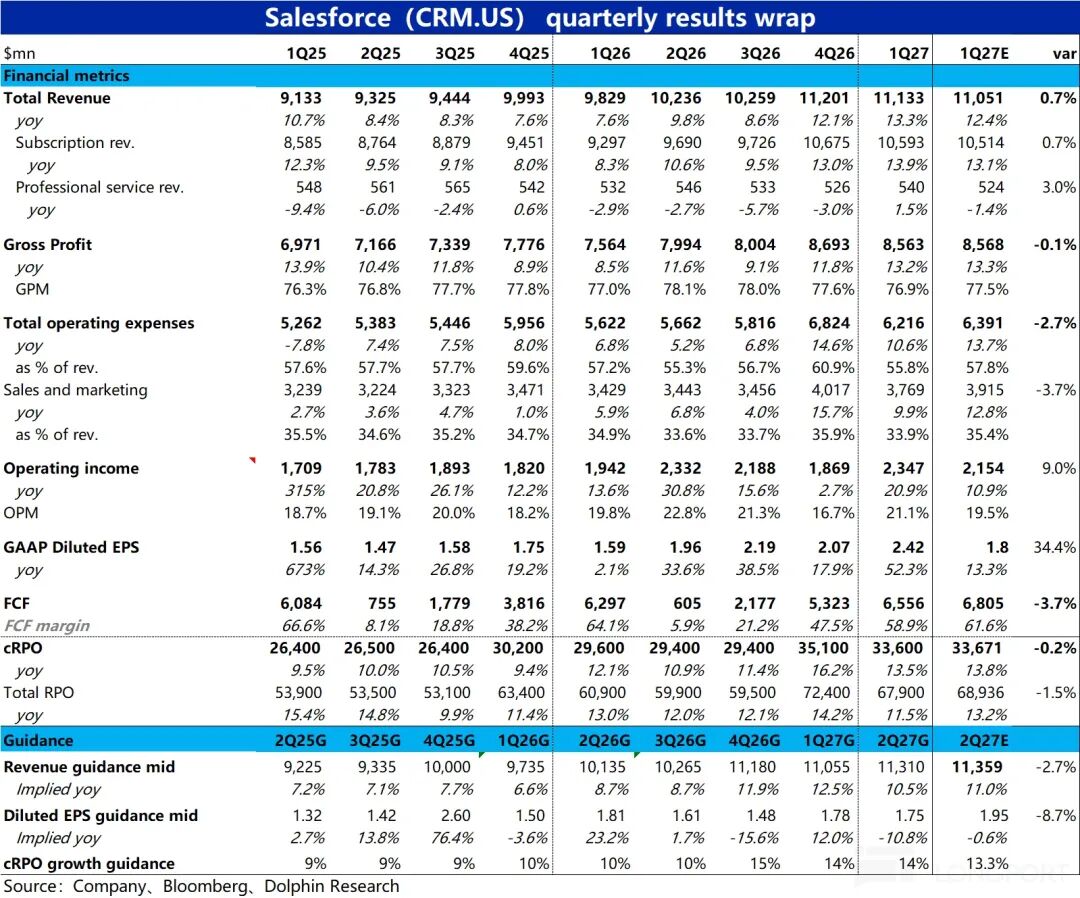
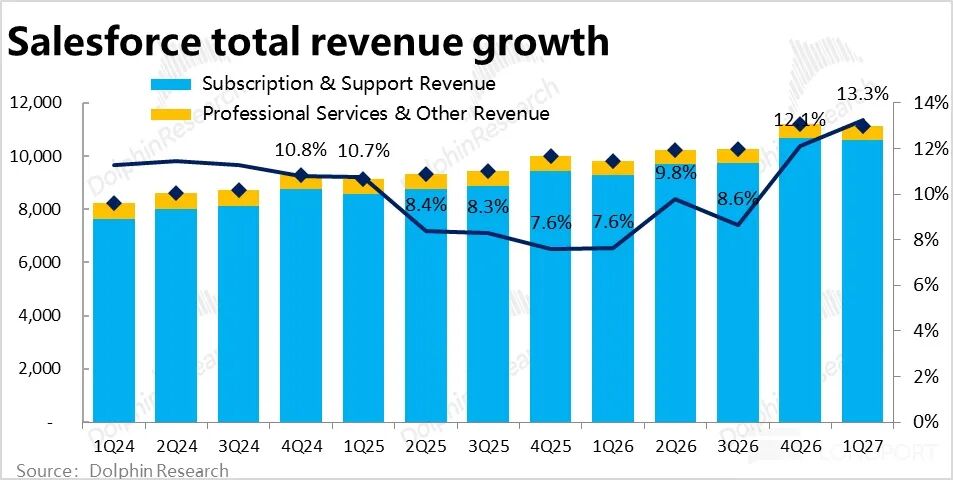
1. Growth Remains Stagnant: Subscription revenue, the core of Salesforce's business this quarter, reached approximately $10.6 billion, up 12% year-over-year (YoY) at constant currency (CC), showing a slight acceleration of 1 percentage point (pct) from the previous quarter. However, after excluding the impact of consolidating Informatica, the true growth rate likely remained flat compared to the previous quarter.
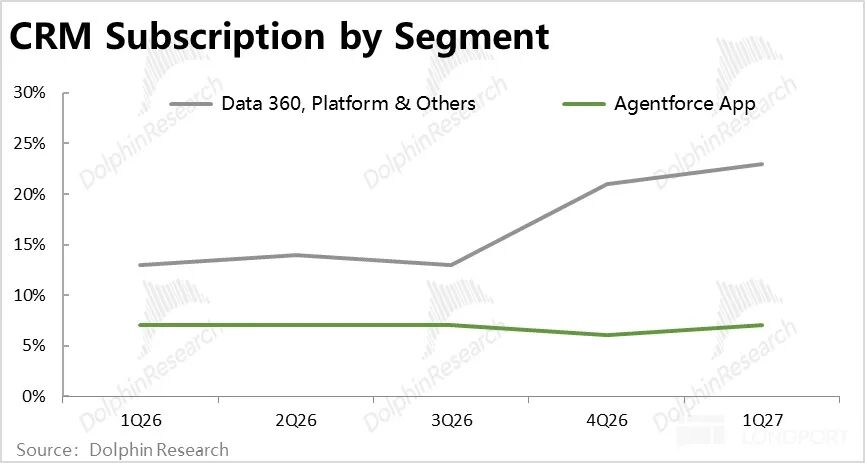
Breaking down the business lines, Salesforce adjusted its disclosure metrics this quarter, dividing them into two main segments: 1) the more traditional Agentforce Apps segment, which grew 7% YoY at CC, showing little change from previous quarters; and 2) the more PaaS-oriented Data and Platform segment, which saw revenue increase by 23% YoY at CC, slightly accelerating by 2 pcts from the previous quarter, a decent performance. Yet, excluding Informatica's contribution, the true growth rate was only around 10%.
From all perspectives, the AI business has yet to demonstrate a significant boost to overall revenue growth.
2. AI Benefits Mid- and Upstream More, with Steady ARR Growth: The separately disclosed annualized revenue from AI-related Agentforce & Data reached $3.4 billion this quarter, up $500 million quarter-over-quarter (QoQ), a modest increase. Among this, the application-oriented Agentforce contributed about one-third, with the remaining two-thirds coming from mid-tier data and platform businesses. This aligns with the current understanding that AI benefits the mid- and upstream sectors more significantly while offering limited or even negative benefits to end-user applications.
As of this quarter, AI-related revenue accounted for 8% of total revenue, up from 6.8% last quarter, continuing to rise slightly. However, the benefits of AI are limited if they cannot translate into accelerated overall company growth, merely representing an internal shift from non-AI to AI businesses.
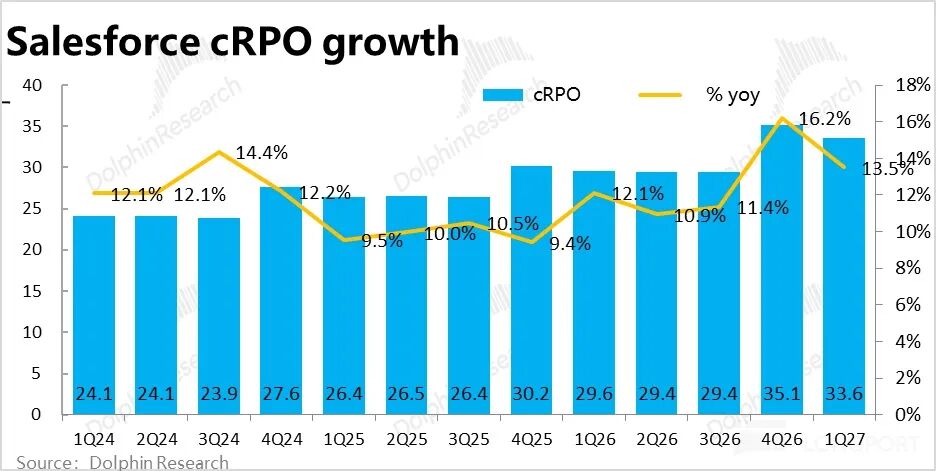
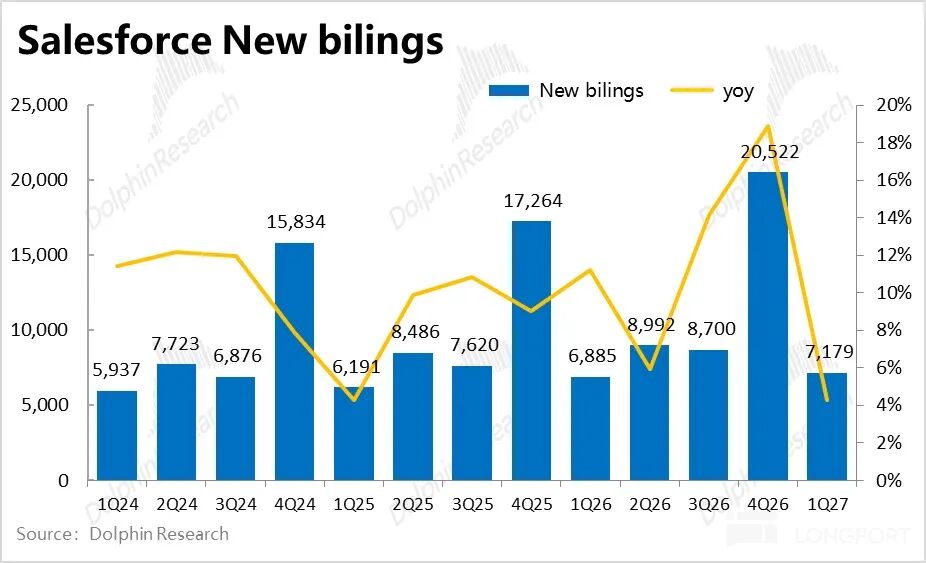
3. Leading Indicators Remain Flat: The core metric, current remaining performance obligations (cRPO), stood at $33.6 billion this quarter, up 13% YoY at CC, matching the previous quarter's growth rate. However, new orders this quarter amounted to only about $7.2 billion, a sharp decline from the previous quarter's $20.5 billion, with YoY growth in new orders at just 4%, the lowest since 1Q25.
This similarly indicates that despite ongoing AI & Agent feature rollouts, user demand for Salesforce's services remains tepid.
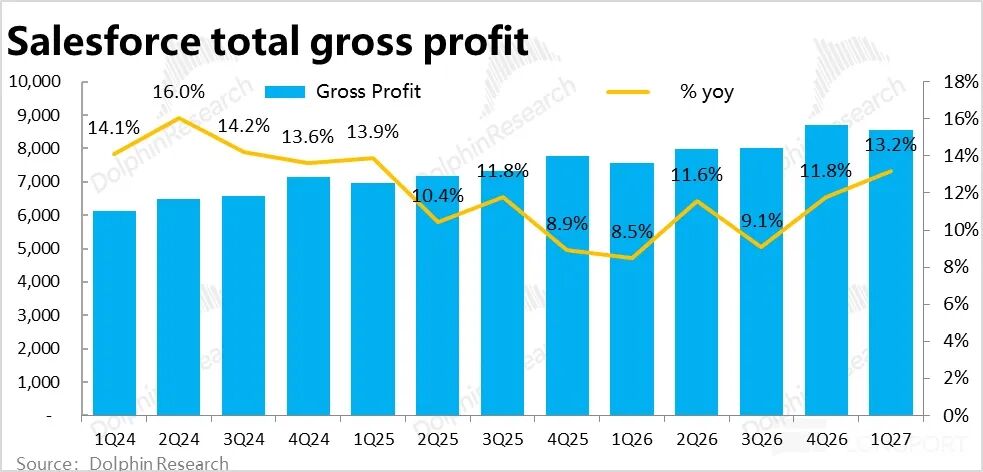
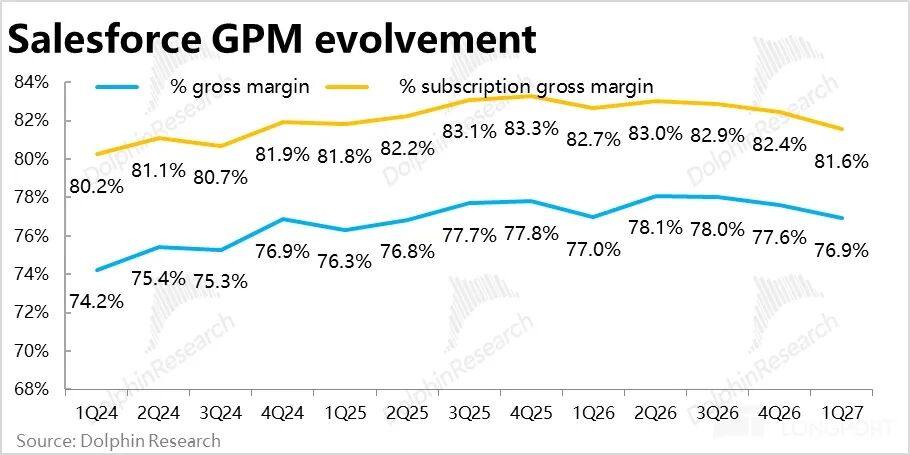
4. Gross Margin Continues to Decline: With lackluster revenue growth, gross margins continued to trend downward. The overall gross margin this quarter was 76.9%, declining for four consecutive quarters sequentially and down 0.1 pct YoY.
The gross margin for the core subscription business declined more sharply, at 81.6%, down 1.1 pcts YoY. This suggests that the AI business's gross margin is likely lower than traditional businesses (unsurprising, given higher computing costs), implying that even if the AI business scale grows significantly, it may not bring proportional profit growth.
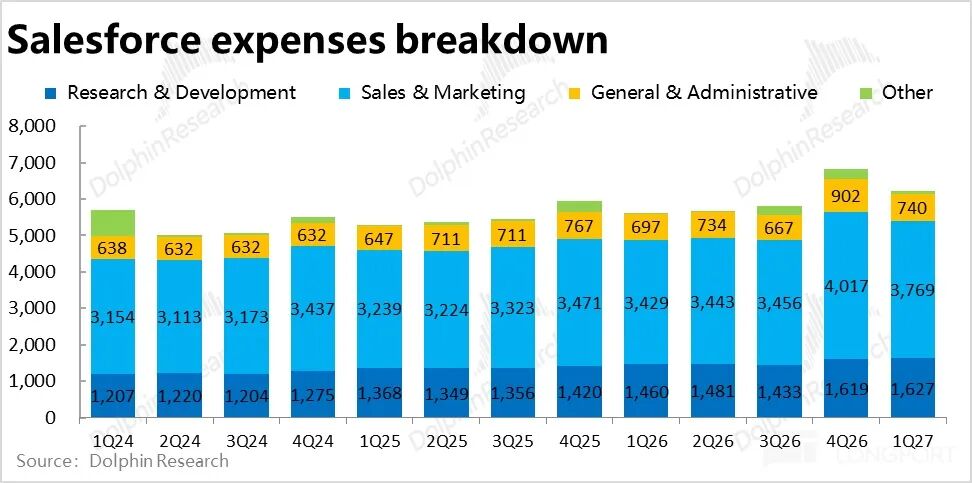
5. Cost Controls Maintain Profits, but Cash Flow is Weak: Fortunately, expense control was strong this quarter, with total expenses around $6.2 billion, up about 10.6% YoY, below revenue and gross profit growth rates. Specifically, marketing expense growth was less than 10%, below market expectations of 12%.
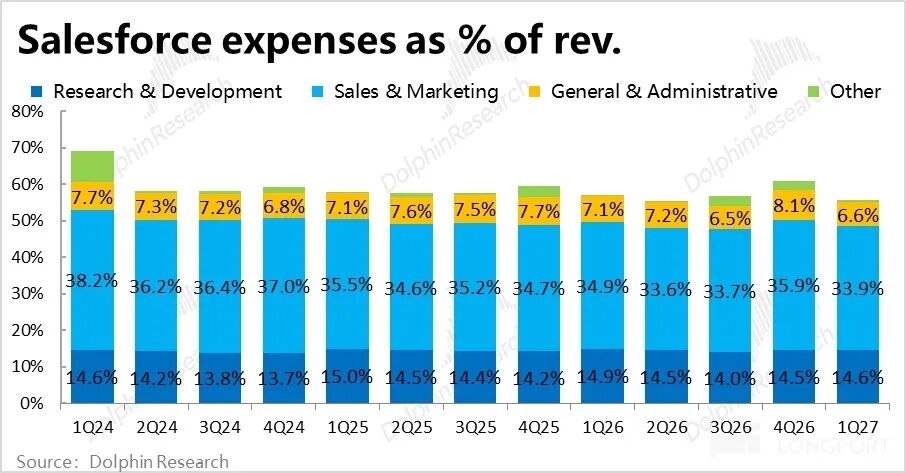
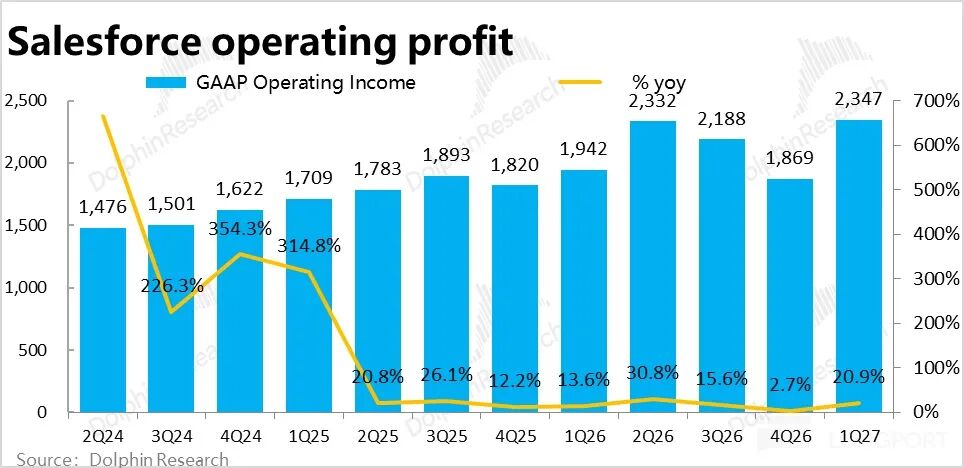
Thus, despite a roughly 0.1 pct YoY decline in gross margin, the operating profit margin under GAAP increased YoY due to a 1.4 pct narrowing in the expense ratio, resulting in operating profit of about $2.35 billion, up nearly 21% YoY, about 9% higher than expected. Operating profit performance was decent.
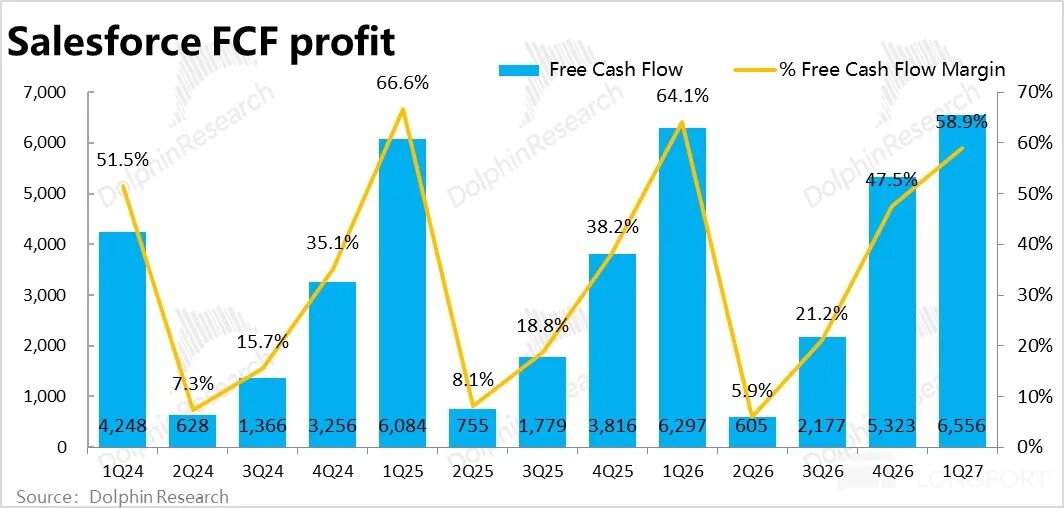
However, free cash flow, which the market focuses on more, grew only 3% YoY this quarter, far below market expectations of around 8%. The discrepancy between cash flow and operating profit growth was mainly due to fewer new orders this quarter, with more revenue recognized being a consumption of previously deferred revenue, not generating cash flow.
6. Massive Shareholder Returns: As we've emphasized multiple times, with difficult-to-improve performance, shareholder returns are one of the main means to maintain investor appeal. This quarter, Salesforce spent $25 billion on shareholder returns, compared to just $14.3 billion for the entire FY26.
Of this, about $27.1 billion was used for share repurchases, reducing the total share count by about 10% YoY this quarter, with less than $400 million used for dividends. While this quarter's situation is unlikely to be the norm, compared to the company's current market cap of about $145 billion, the shareholder return rate for just this quarter reached 17%.
Dolphin Research View:
1. Key Takeaways from the Analysis:
a. After excluding FX and consolidation impacts, true revenue growth hovers in the low teens (~10%), stagnant. This reflects that revenue from AI-related businesses still cannot substantially drive overall company growth. While data and platform businesses show stronger growth and logically benefit more from AI currently, their actual pulling effect is also limited.
b. Meanwhile, due to higher costs in AI-related businesses, gross margins are declining despite lackluster revenue growth, with profits under pressure earlier, resulting in a lose-lose situation of no growth and no profit.
2. Guidance and Outlook:
In the short term, Salesforce guides for revenue growth of 10% YoY at CC next quarter, a 2 pct deceleration from this quarter, below market expectations. Notably, consolidation contributions alone account for over 4 pcts of this growth, implying organic business growth is less than 6%. Meanwhile, cRPO is guided to grow 13% YoY (at CC), unchanged from this quarter.
Together, these imply that AI will still not bring noticeable revenue growth acceleration next quarter.
At the profit level, Salesforce guides for a median GAAP diluted EPS of $1.75, implying a YoY decline of over 10%, far below market expectations of roughly flat YoY growth. Next quarter will similarly see no significant growth acceleration and profit pressure.
In the medium term, for FY27, Salesforce slightly raised the lower bound of its revenue guidance but still implies revenue growth of only 10%~11%, suggesting deceleration in subsequent quarters. This is mainly because there will be no more consolidation benefits by Q4, but based on company communications, organic business growth (excluding M&A) may accelerate in FY27.
Changes in FY27 guidance mainly relate to profit expectations, with the GAAP operating margin lowered (revised downward) from 20.9% to 20.6%. Cash flow growth guidance was more sharply reduced from 9%~10% to 4%~5%, implying continued pressure on margins from AI investments.
3. Overall Assessment:
Salesforce's advantage remains its not-high valuation, supported by massive buybacks to sustain its valuation floor, leaving limited room for further pure valuation declines.
However, both from this quarter's performance and market research, customer interest in Salesforce's AI and other products is low, for reasons including: most enterprises' overall IT budgets have not increased, with most increments allocated to AI-related areas, thus encroaching on budgets for SaaS products like Salesforce; regarding Agents, some enterprises prefer more flexible options like Claude Code directly rather than third-party customized Agents like those from Salesforce; the company's products, especially mid-tier services like Platform, lack obvious pricing attractiveness, etc.
Below is a detailed analysis:
I. Subtle Metric Adjustments, Rising Importance of Mid-Tier
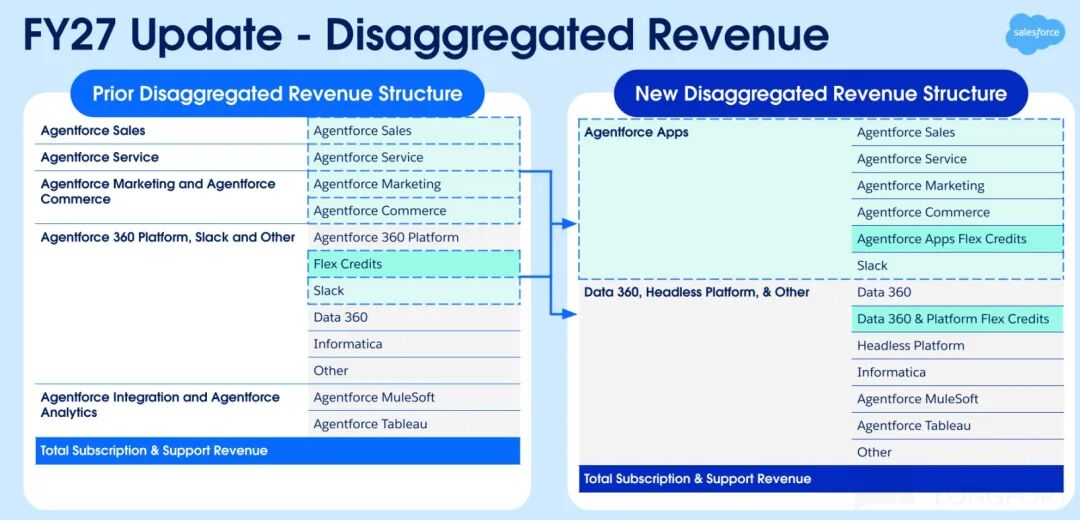
Starting from FY27, Salesforce also made subtle adjustments to its financial disclosure metrics. The main change was consolidating the segmented disclosure method for core subscription revenue from five previous segments—Sales, Service, Marketing & Commerce, Platform, and Analytics—into two main blocks: Agentforce Apps and Data 360 & Platform & Others.
Specifically, Agentforce Apps are more SaaS-oriented, directly user-facing applications including original Sales, Service, Slack, etc. Data 360 & Platform are more PaaS-oriented, mainly providing mid-tier platform and data services, including Data 360, the recently launched Headless Platform, and previously acquired businesses like Informatica and MuleSoft.
Dolphin Research believes this adjustment aims to more clearly distinguish traditional, slower-growing SaaS applications from faster-growing data and platform businesses in the AI era, hoping the market will focus more on tracking the latter.
II. Revenue Growth Remains 'Stagnant,' with No AI Benefits Reflected
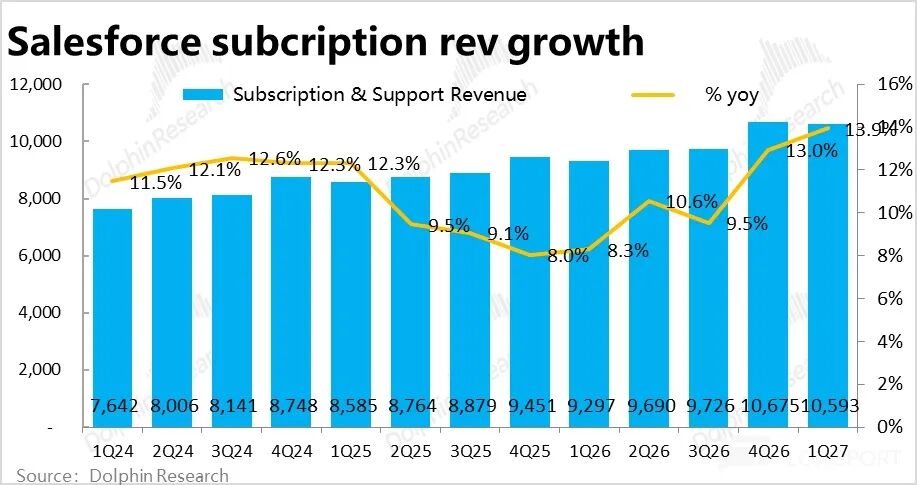
On the growth front, subscription revenue, Salesforce's core business this quarter, was about $10.6 billion, up 12% YoY at CC, slightly accelerating by 1 pct from the previous quarter. However, as disclosed, Informatica's consolidation had a more significant revenue-pulling effect this quarter than last, so the true growth rate was roughly flat after excluding this impact.
As mentioned earlier, Salesforce adjusted its disclosure metrics for subscription business segmented revenue this quarter. Under the new metrics, application-oriented Agentforce Apps revenue grew 7% YoY at CC, showing little change from previous quarters, so AI and Agents' pulling effect on traditional businesses remains negligible.
Meanwhile, the more PaaS-oriented data and platform segment saw revenue increase by 23% YoY at CC this quarter, continuing to slightly accelerate from the previous quarter's 21%, appearing decent. However, excluding Informatica's contribution, true growth was only around 10%, similarly showing no obvious AI-driven pulling effect.
Combined with about $540 million in expert services revenue, total company revenue was about $10.6 billion this quarter, up 12% YoY at CC, accelerating by 1 pct from the previous quarter. Excluding consolidation benefits, true growth was nearly 9% vs. last quarter's ~8%.
III. New Order Growth Hits Record Low
Among leading indicators, current remaining performance obligations (cRPO) stood at $33.6 billion this quarter, up 13% YoY at CC, matching the previous quarter's growth rate. However, new orders this quarter amounted to only about $7.2 billion, a sharp decline from the previous quarter's $20.5 billion, with YoY growth in new orders at just 4%, the lowest since 1Q25. This similarly indicates weak demand for Salesforce's services.
IV. Lackluster Growth, with Margin Pressure
With lackluster revenue growth, or possibly due to the rising proportion of AI business, Salesforce's gross margin continued to show a clear downward trend. The overall gross margin this quarter was 76.9%, declining for four consecutive quarters sequentially and down 0.1 pct YoY.
In fact, the gross margin for the core subscription business declined more sharply (with some improvement in gross losses from expert services revenue this quarter), at 81.6%, down 1.1 pcts YoY. Dolphin Research believes this may be due to the combined impact of lower gross margins in AI-related businesses and their rising revenue share.
We believe the underlying reason is that AI businesses require higher computing costs, while revenue pricing for related businesses has not fully shifted from seat-based to usage-based, leading to a mismatch between costs and revenue.
Due to the above, total gross profit was about $8.56 billion this quarter, up 13.2% YoY, slightly below market expectations.
V. Cost Control Preserves Profits, but Cash Flow is Poor
Fortunately, Salesforce excelled in expense control this quarter, with total expenditures of approximately $6.2 billion, representing a year-on-year increase of about 10.6%, which is lower than the growth rates of revenue and gross profit. Specifically, marketing expenses increased by nearly 10% year-on-year, lower than the market expectation of 12%. Administrative expenses rose by about 6%, while R&D expenses grew at a slightly higher rate of 11.4%.
Overall, except for the slightly higher growth in R&D spending due to the need to develop new AI functionalities, other expenses were relatively restrained.
Therefore, despite a year-on-year decrease in gross profit margin of approximately 0.1 percentage points, the operating profit margin under GAAP increased by about 1.3 percentage points year-on-year due to a 1.4 percentage point narrowing in the expense ratio. Operating profit reached approximately $2.35 billion, up nearly 21% year-on-year, exceeding expectations by about 9%.
However, the free cash flow, which the market is more concerned about, only increased by 3% year-on-year this quarter, far below the market expectation of about 8% growth. The difference between the growth rates of cash flow and operating profit is mainly due to the relatively small number of new orders received this quarter, as mentioned earlier, resulting in less new cash inflow.
- END -
// Reprint Authorization
This article represents an original piece authored by Dolphin Research. Any reprinting is strictly contingent upon obtaining prior authorization.
// Disclaimer and General Disclosure Notice
This report is crafted for the purpose of providing general, comprehensive data, intended for the broad readership and data reference of users associated with Dolphin Research and its affiliated entities. It does not cater to the specific investment objectives, product preferences, risk tolerance levels, financial circumstances, or unique needs of any individual recipient. Investors are strongly advised to engage with independent professional advisors prior to making any investment decisions based on the insights presented in this report. Any individual who opts to make investment decisions utilizing or referring to the content or information delineated in this report does so at their own risk. Dolphin Research disclaims any direct or indirect liability or losses that may ensue from the utilization of the data contained within this report. The information and data featured in this report are sourced from publicly accessible materials and are presented solely for reference purposes. Dolphin Research endeavors to ensure, yet does not guarantee, the reliability, accuracy, and completeness of the pertinent information and data.
The information cited or opinions expressed in this report shall not, under any jurisdiction, be deemed or interpreted as an offer to sell securities, an invitation to purchase or sell securities, nor shall it constitute advice, a quotation, or a recommendation concerning relevant securities or associated financial instruments. The information, tools, and materials encompassed in this report are not intended for, nor proposed to be, distributed to jurisdictions where such distribution, publication, provision, or utilization would contravene applicable laws or regulations, or necessitate Dolphin Research and/or its subsidiaries or affiliated companies to adhere to any registration or licensing requirements in such jurisdictions, or to citizens or residents thereof.
This report solely mirrors the personal perspectives, insights, and analytical methodologies of the respective creators and does not represent the official stance of Dolphin Research and/or its affiliated institutions.
This report is produced by Dolphin Research, with exclusive copyright ownership vested in Dolphin Research. Without the prior written consent of Dolphin Research, no institution or individual shall (i) engage in the creation, copying, reproduction, duplication, forwarding, or generation of any form of copies or reproductions in any manner, and/or (ii) directly or indirectly redistribute or transfer to other unauthorized individuals. Dolphin Research reserves all pertinent rights.
-
Ofilm Teams Up with ADSensE to Propel Large-Scale Deployment of All-Solid-State LiDAR Powered by ADS6311 Chip!
-
![]()
Loss of 2.5 Billion Yet Facing Strong Demand for Shares? Another Battle for Control of Lianchuang Electronics
-
![]()
Huawei’s Enjoy Series Flies Off the Shelves, Prompting Xiaomi to Double Down on Budget Smartphones
-
![]()
Beijing Hyundai's Top Executive Criticizes Industry Disorder: Certain Brands Treat Customers as Beta Testers
-
![]()
The domestic mobile phone market has declined for five consecutive quarters! Huawei defies the trend with significant growth: maintains its top market share
-
Annual Revenue Surpasses 3 Billion: An Automotive Trim 'Little Giant' Makes Its Debut on the Beijing Stock Exchange
-
![]()
The Space Force Wants to Spend $30 Billion on Rocket Launches: Is Trump Doubling Down, and Is SpaceX the Big Winner?
-
![]()
Going Crazy! One out of Every Three Plug-in Hybrids Sold in Europe is a Chinese Vehicle