Salesforce: AI Agent Deployment 'Challenging'—Has This SaaS Giant Become a Value Play?
 12/05 2025
 774
774
On the morning of December 4, following the market close, SaaS leader Salesforce unveiled its financial results for the third quarter of fiscal year 2026 (ending October 31). The quarterly performance fell short of robustness, with most key metrics missing market forecasts. However, there was a silver lining as leading indicators (cRPO and new contracts) exhibited a slight uptick from a low base. The standout was the company's projection of significant growth improvement in the next quarter, primarily attributed to the integration of Informatica. Here are the specifics:
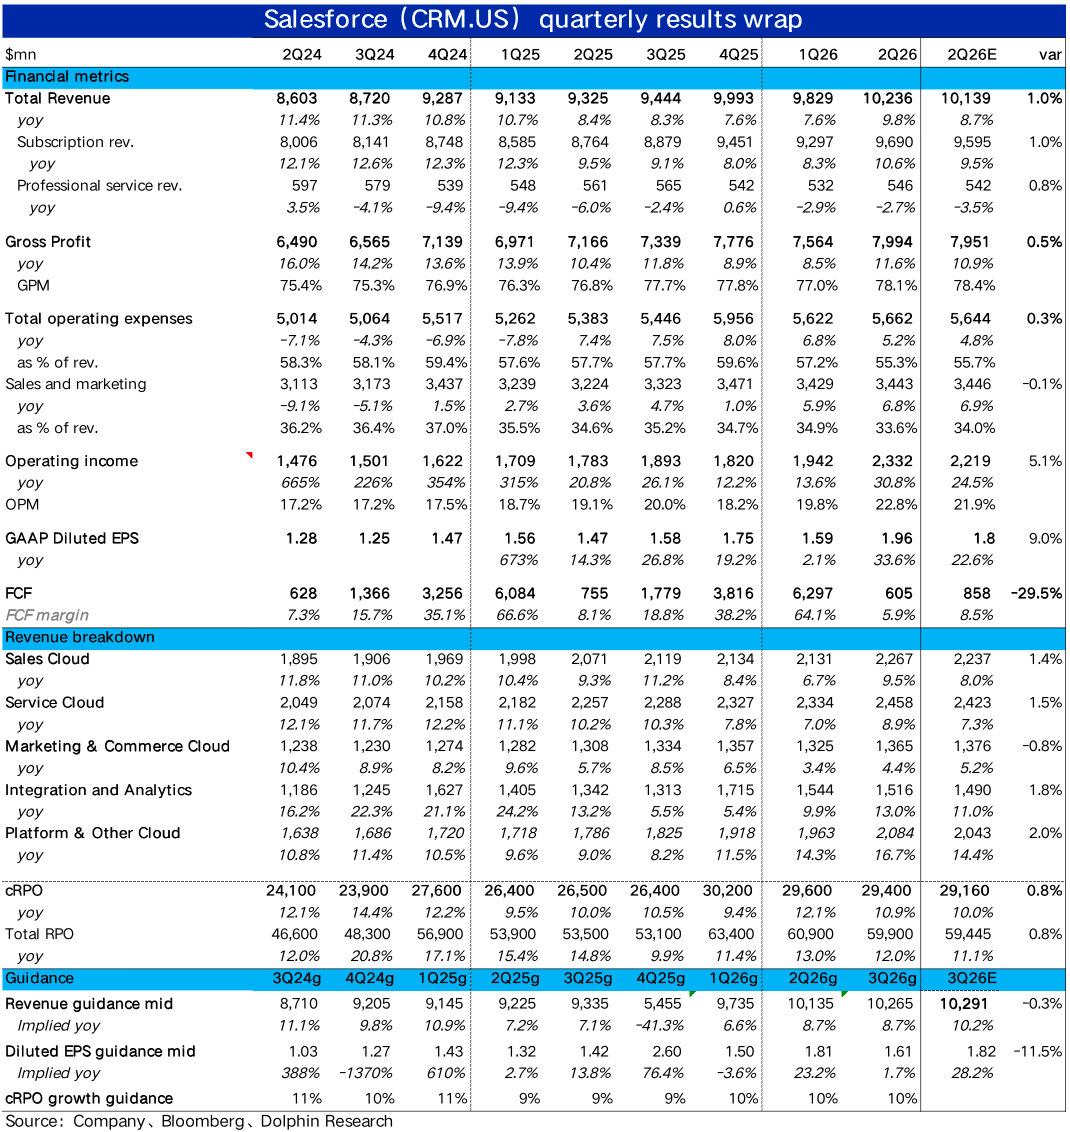
1. Overall revenue growth decelerated, yet the AI business held relatively steady: Quarterly core subscription revenue reached approximately $9.73 billion, marking a 9.5% year-over-year increase—a further slowdown of 1.1 percentage points from the prior quarter and slightly below market expectations.
Delving into the business segments, traditional business growth continued to lag, while the service cloud and platform cloud, more intricately linked to AI Agents, demonstrated robust performance.
Among these, the customer service cloud, where AI Agents are most extensively utilized, witnessed a 9% year-over-year revenue surge, with the growth rate marginally improving by 0.1 percentage points sequentially. Although not a dramatic acceleration, it was still noteworthy compared to other decelerating business lines.
The platform cloud, serving as the bedrock for Agentforce services, fared even better, with a 19.5% revenue increase this quarter—marking the fifth consecutive quarter of acceleration (from around 8% to nearly 20%). Despite no significant single-quarter spike, the cumulative growth underscored the positive impact of AI Agents on driving expansion.
2. Leading indicators displayed resilience: In contrast to the still-slowing revenue growth, leading indicators like cRPO and new contracts exhibited greater resilience.
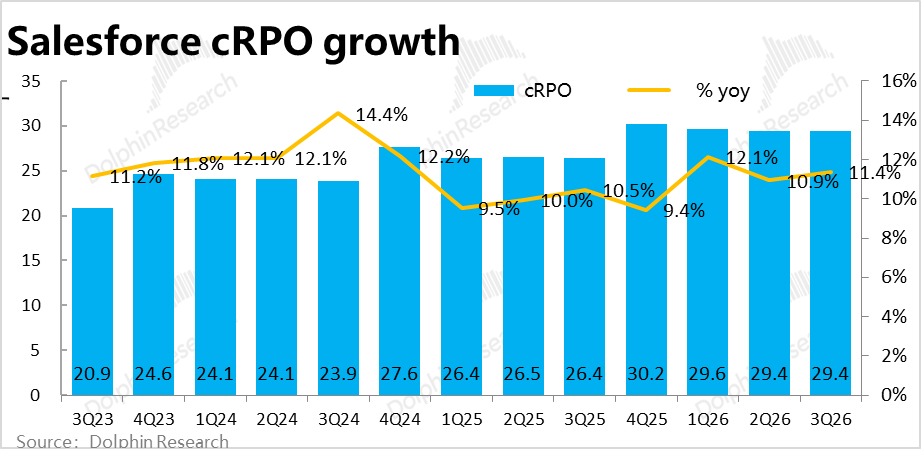
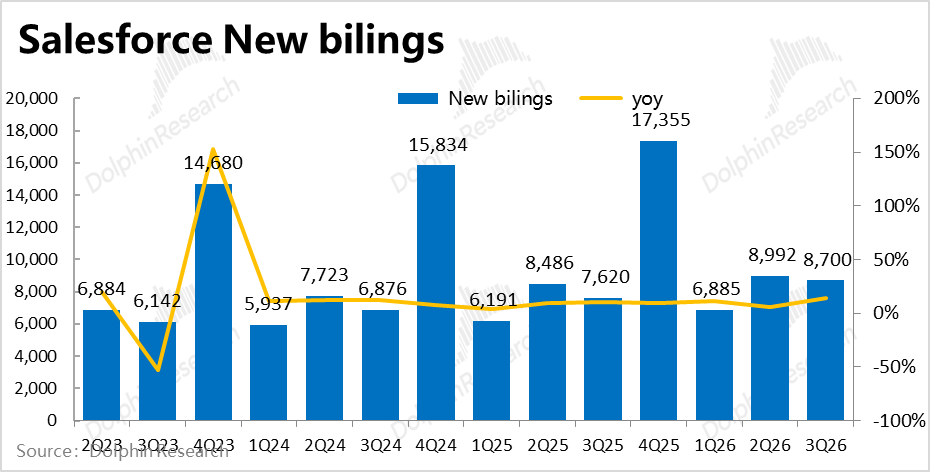
This quarter, the nominal year-over-year growth rate of cRPO (short-term unfulfilled balance) reached 11.4%, up by 0.5 percentage points from the previous quarter. The value of new contracts signed this quarter stood at $87 million, a 14% year-over-year increase.
However, sequentially, the cRPO balance remained flat at $29.4 billion compared to the prior quarter. Similarly, the value of new contracts signed this quarter slightly dipped from $89.9 million in the previous quarter.
Thus, the higher growth rates of cRPO and new contracts were more attributable to the low base in the same period last year and did not yet signify a substantial improvement in the truest sense. Nonetheless, compared to the continued deceleration in revenue growth this quarter, they at least hinted at potential improvement in the next quarter.
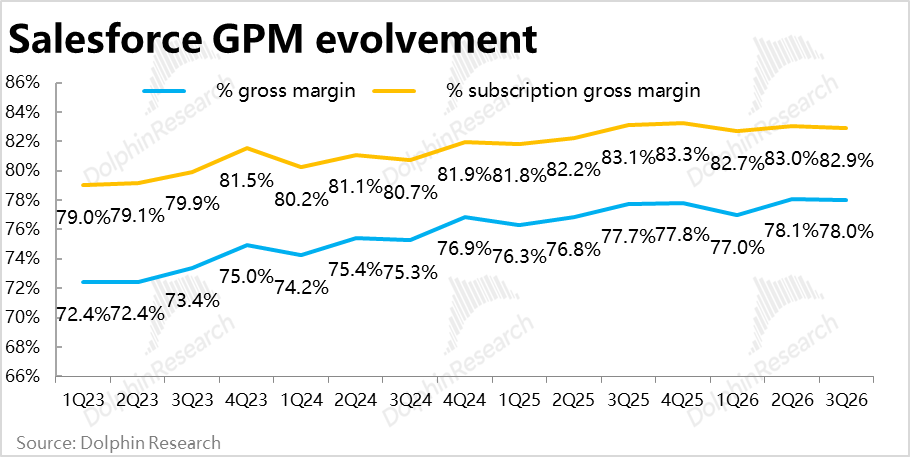
3. Will the trend of gross margin expansion halt due to AI investments? Owing to the generally lower gross margins of AI businesses, the gross margin for subscription services this quarter was 82.9%—starting to decline both year-over-year and sequentially, thereby ending the trend of continuous gross margin expansion since fiscal year 2021. Even with the company's widespread price hikes for its products in August, they could not fully counterbalance this impact.
Additionally, the gross loss rate for the professional services business slightly widened to -10.7% this quarter. Gross margins for both businesses declined, but due to the rising proportion of the higher-margin subscription business in the overall structure, the company's overall gross margin still saw a slight year-over-year increase but declined sequentially.
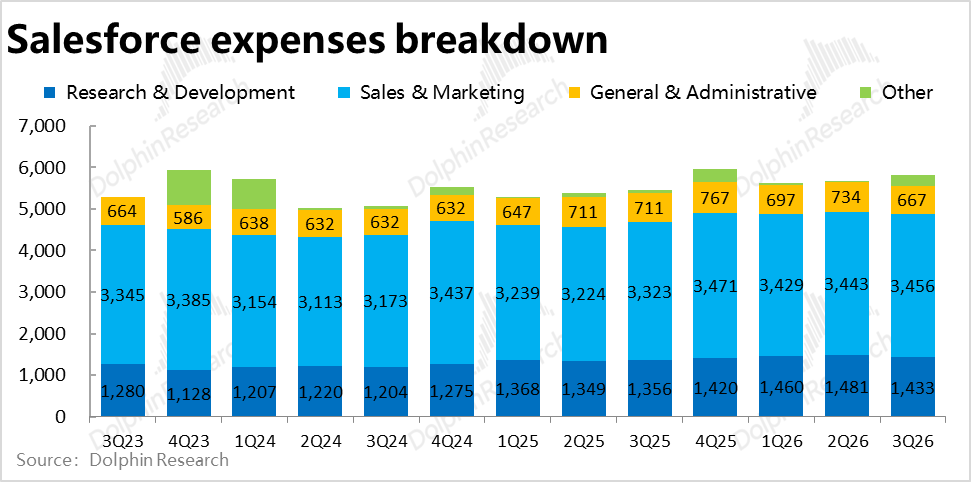
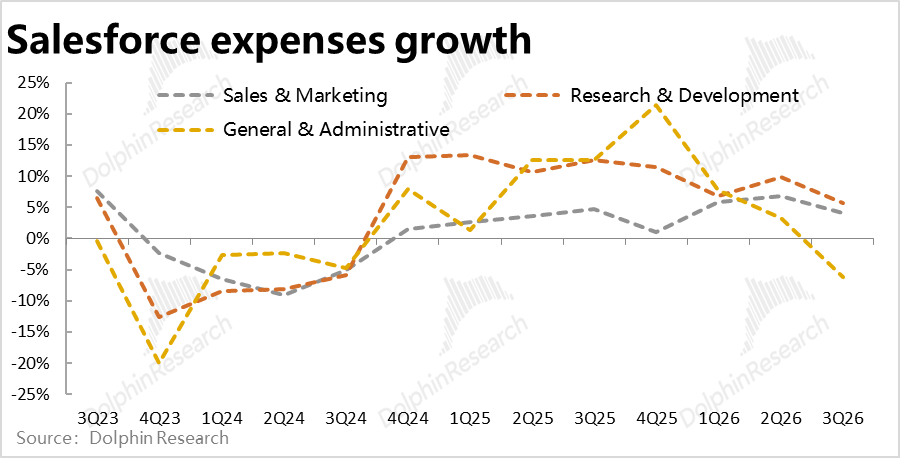
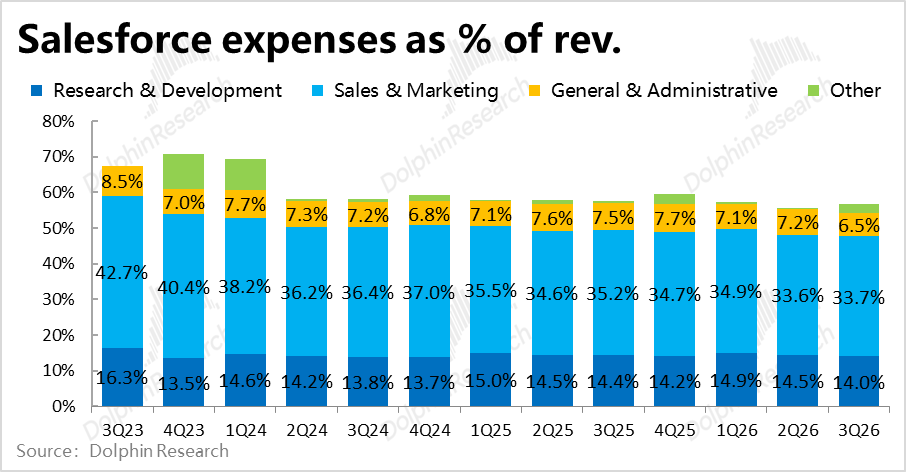
4. Cost control remained exemplary: Salesforce's total operating expenses this quarter amounted to $5.82 billion, a 6.8% year-over-year increase—slightly accelerating from the previous quarter but slightly below market expectations. Among these, marketing and R&D expenses both rose by only a mid-single-digit percentage year-over-year, while administrative expenses even declined by about 6% year-over-year. It is evident that the company's expense investments did not significantly escalate due to the development of new businesses like Agentforce.
Considering only the aforementioned three expenses, they increased by just 3.1% year-over-year, as $260 million in restructuring expenses (presumably due to the acquisition of Informatica) dampened the contribution of cost control.
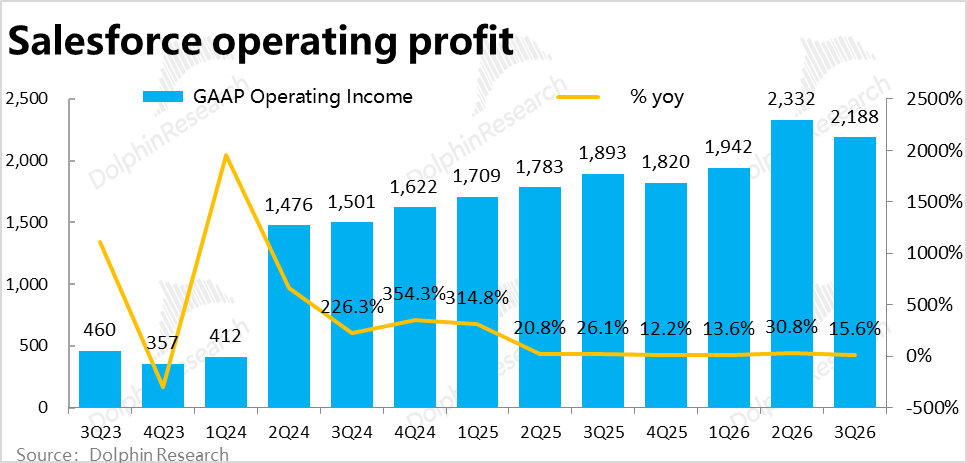
5. Profit growth remained robust, albeit with signs of marginal weakening: As the gross margin was still increasing year-over-year and cost control remained effective, the GAAP operating profit margin this quarter reached 21.3%—still up by 1.3 percentage points year-over-year. The year-over-year growth rate of operating profit was still 15.6%, representing solid profit growth.
However, marginally, with the gross margin starting to decline sequentially, the magnitude of the operating profit margin increase also significantly narrowed from 4 percentage points in the previous quarter, indicating a marginal weakening trend. Actual profit was also slightly lower than sell-side expectations.
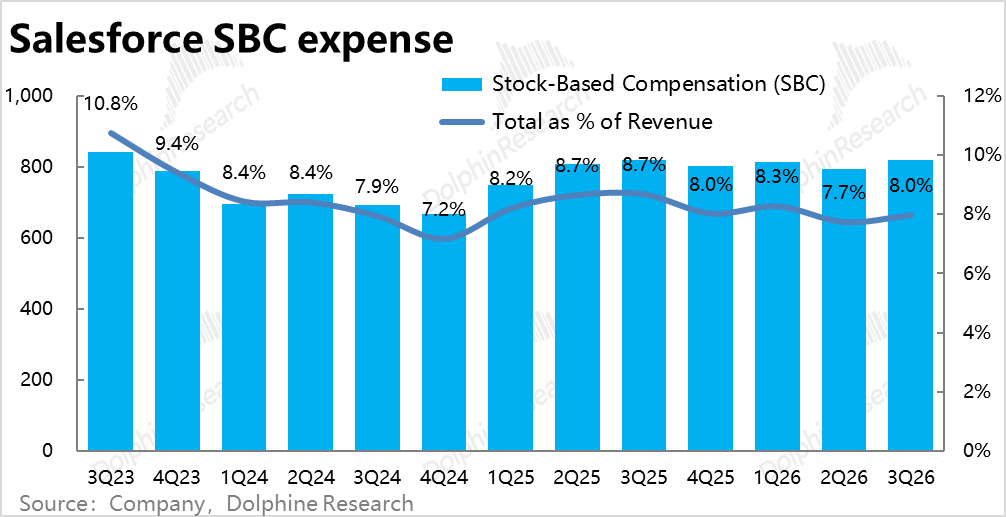
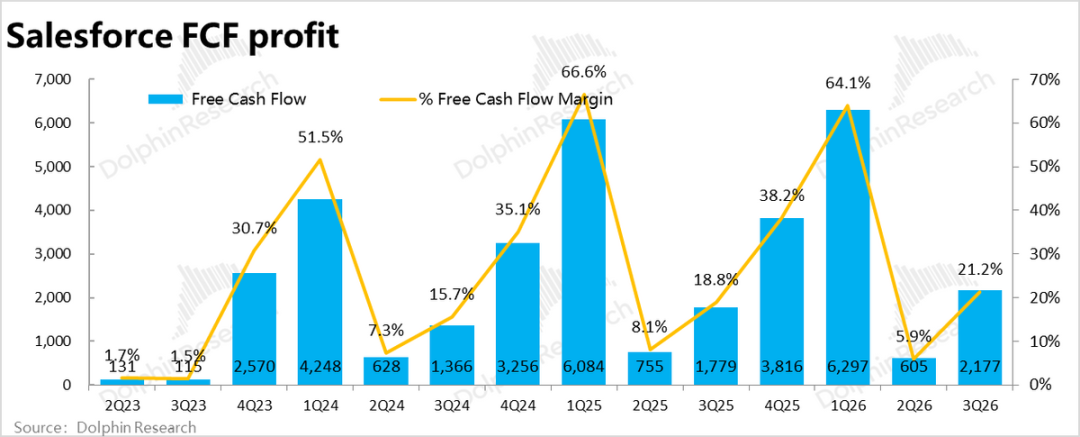
Excluding non-cash expenses (such as stock-based compensation expenses and amortization and depreciation impacts from mergers and acquisitions), the company's more closely watched free cash flow was $2.18 billion this quarter—roughly in line with operating profit. The cash flow profit margin was 21%, also slightly lower than market expectations of 22%.
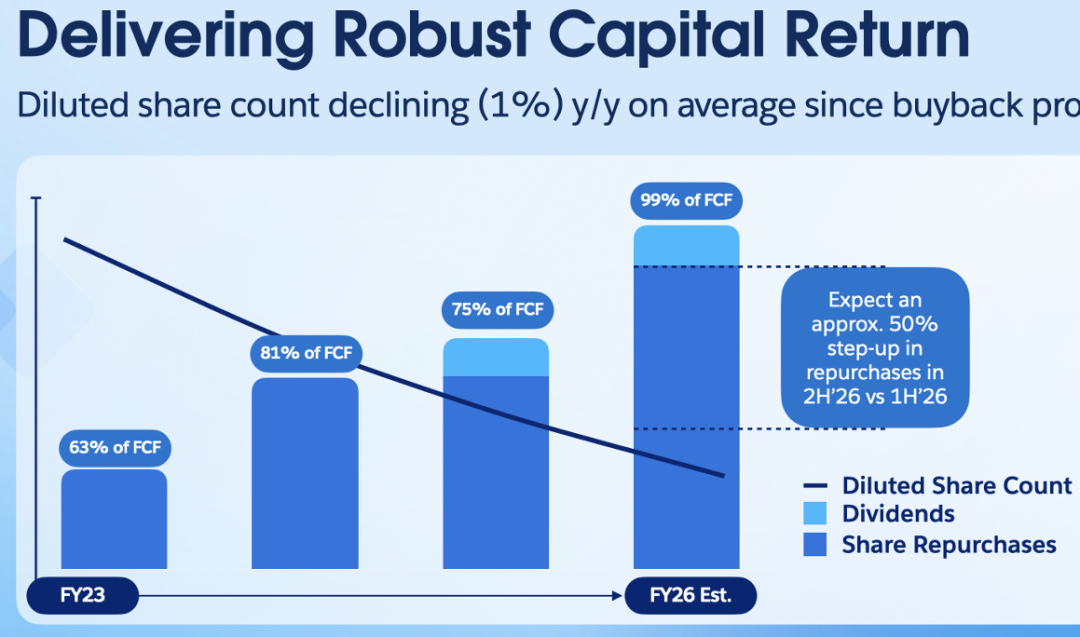
6. Shareholder returns surged as promised: As pledged at the previous Dreamforce conference, shareholder returns significantly increased in the second half of the fiscal year. This quarter, the company returned a total of $4.2 billion to shareholders through repurchases and dividends—equivalent to about 1.8% of the company's current market value in a single quarter, which is quite substantial.
Dolphin Research View:
As observed above, Salesforce's quarterly performance was clearly not robust. It fell short of market expectations in nearly all aspects (except cost control). In terms of trends, revenue growth continued to decelerate, and the gross margin also started to marginally weaken. Although cost control remained effective and profit growth was still solid, the gap between profit growth and revenue growth narrowed due to the gross margin decline caused by AI investments.
Judging solely by this quarter's performance, it can be said to have reinforced the market's perception of the company's biggest issue—sluggish growth with no signs of acceleration.
It can only be said that this quarter's performance reflects past scenarios, and future prospects and outlooks are always more pivotal. The leading indicators of cRPO and new contracts, while not particularly strong, at least suggest potential stabilization and recovery in subsequent revenue growth.
Structurally, while traditional businesses are 'deteriorating,' the platform cloud and service cloud related to AI have indeed shown relatively better performance, maintaining the vision that AI Agents may drive another acceleration in the company's growth.
Let's take a closer look at the subsequent guidance and outlook:
1) In the short-term outlook, the company projected revenue growth to increase to 11%-12% next quarter and cRPO growth to increase to 15%—both representing significant accelerations from this quarter and indeed suggesting a potential rebound in growth.
However, a more detailed examination reveals that the improvement in growth rates is primarily due to the integration of Informatica, contributing 3 percentage points and 4 percentage points to revenue and cRPO growth rates, respectively. Excluding this impact, revenue and cRPO growth rates do not show much acceleration compared to this quarter. Therefore, the guidance implicitly suggests that the company's existing business growth will stabilize and no longer decelerate, but there is no substantial acceleration observed yet.
The true highlight in the guidance is that the company raised its full-year fiscal year 2026 free cash flow growth expectation to 13%-14% year-over-year. Based on the midpoint of the guidance, it implies that free cash flow next quarter could exceed $5 billion, a 32% year-over-year increase—significantly higher than this quarter's growth and also higher than the current market expectation of $4.8 billion (which may also include integration impacts, but the company did not disclose the specific impact).
Overall, growth is expected to largely stabilize next quarter, while profits will see significant improvement.
2) Additionally, the company provided two key long-term outlooks at the Dreamforce conference in October. First, as seen in the chart below, the company's disclosed NNAOV (Net-new Annual Order Value, referring to the net contract amount added in the current year after excluding lost old contracts) gradually improved after negative growth in fiscal years 2023-2025 and is currently showing signs of breaking above the 10% growth rate. As a leading indicator, the company expects this to translate into another acceleration in revenue growth within the next 12-18 months.

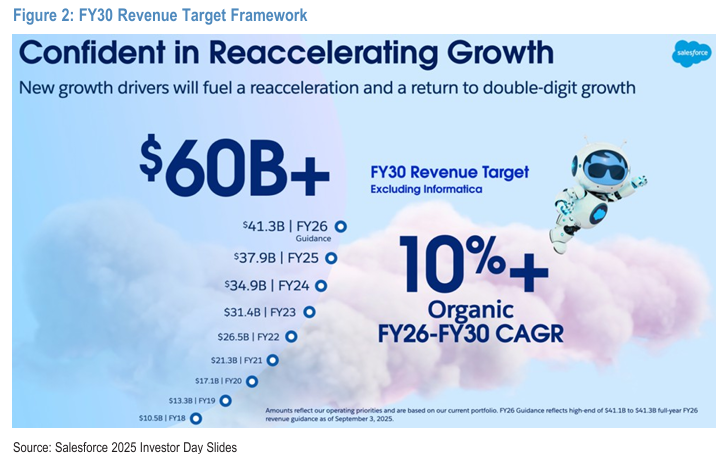
From a longer-term perspective, the company set a revenue target of $60 billion by fiscal year 2030 (excluding the impact of integrating Informatica)—implying a compound annual revenue growth rate of about 10% from fiscal years 2026-2030. While not significantly accelerating from current levels, it at least counters market concerns that the company's subsequent growth will continue to decelerate and may eventually only slightly exceed the mid-single-digit GDP growth rate.
At the same time, the company expects its adjusted operating profit margin to reach about 40% by fiscal year 2030—up about 5 percentage points from the expected level in fiscal year 2026. Based on this guidance, it implies a GAAP after-tax operating profit of about $18 billion in fiscal year 2030. Assuming a mature steady-state PE of 15x, it corresponds to a market value of about $270 billion—representing about a 20% upside from the current market value. From this perspective, the upside is not significant.
Additionally, as mentioned earlier, the company announced that it would increase shareholder returns in the second half of the fiscal year, planning to return almost all free cash flow to shareholders through repurchases or dividends in fiscal year 2026. Based on a total repurchase amount of about $14 billion in fiscal year 2026, it corresponds to about 6.3% of the current market value.
A more detailed value analysis has been published in the same-named article in the 'Dynamic - Investment Research (In-Depth)' section of the Changqiao App.
Here is a detailed interpretation:
I. Brief Introduction to Salesforce's Business & Revenue
Salesforce is the pioneer that first introduced the concept of SaaS (Software-as-a-Service) in the CRM (Client Relationship Management) industry across the United States and globally. The hallmark of this model is its adoption of cloud services instead of localized deployment and its use of a subscription-based payment model rather than outright purchase.
Therefore, Salesforce's business and revenue structure primarily consist of two categories: ① Over 95% of revenue comes from various types of SaaS service subscription income; ② The remaining small portion, about 5%, comes from expert service income such as project consulting and product training.
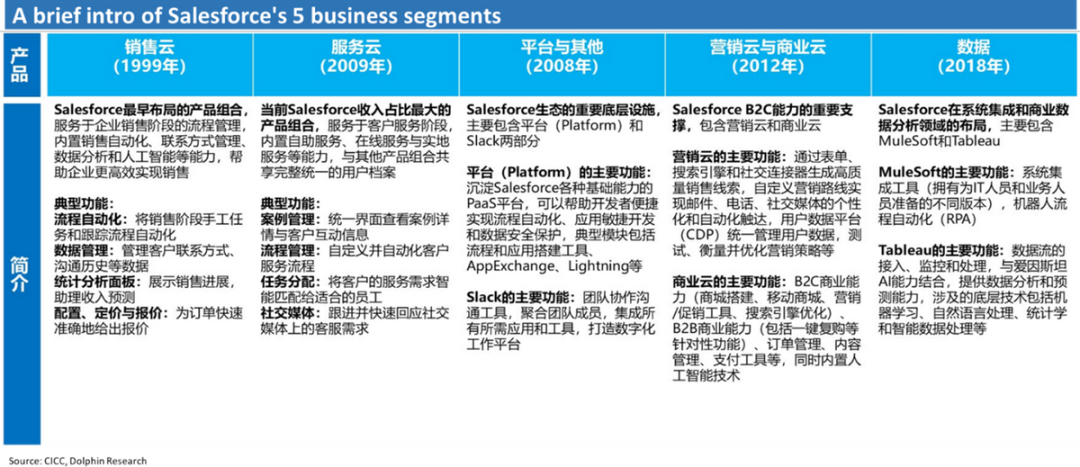
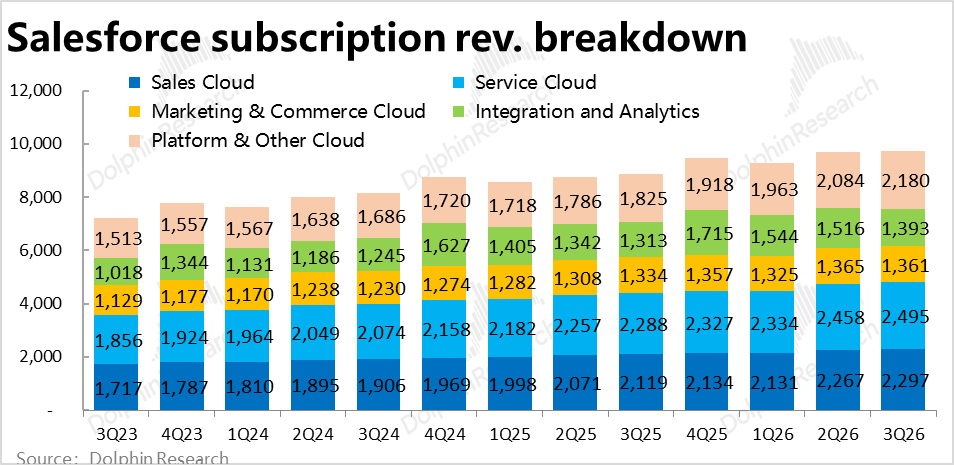
Further breaking it down, the subscription income, which constitutes the majority, is composed of five major SaaS service categories, with roughly equivalent revenue volumes for each major segment, including:
① Sales Cloud: The cornerstone of CRM and the company's earliest business, mainly providing various process management tools for the enterprise sales stage, such as customer contact, quoting, and order signing functions.
② Service Cloud: Another core business of the company, mainly encompassing various functions related to customer service, such as customer information management and online customer service.
③ Marketing & Commerce Cloud: The marketing cloud provides systematic marketing functions through various channels such as search, social media, and email; the commerce cloud mainly provides virtual mall construction, order management, payment, and other functions required for e-commerce.
④ Integration & Analytics: Salesforce's internally integrated database services and business analysis tools, primarily consisting of MuleSoft and Tableau.
⑤ Platform Cloud (Platform & others): The infrastructure and services that other SaaS services of Salesforce rely on, similar to PaaS (Platform-as-a-Service). It also includes team collaboration SaaS services akin to Microsoft Teams, such as Slack.
II. Traditional Businesses Continue to Weaken, While Agentforce-Related Businesses Excel
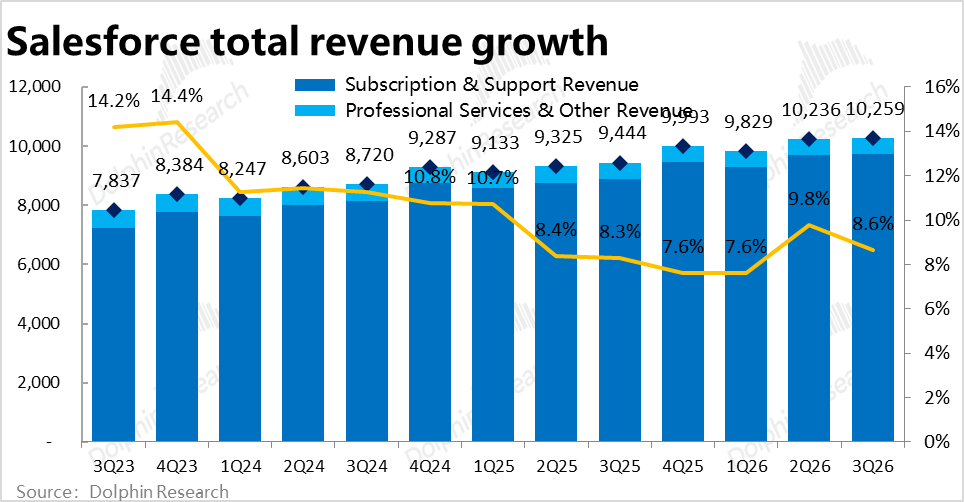
In terms of growth, Salesforce's core subscription revenue this quarter was approximately $9.73 billion, a 9.5% year-over-year increase—slowing down by another 1.1 percentage points from the previous quarter and slightly below market expectations. Looking back, growth remains quite sluggish, with no signs of acceleration but further deceleration instead.
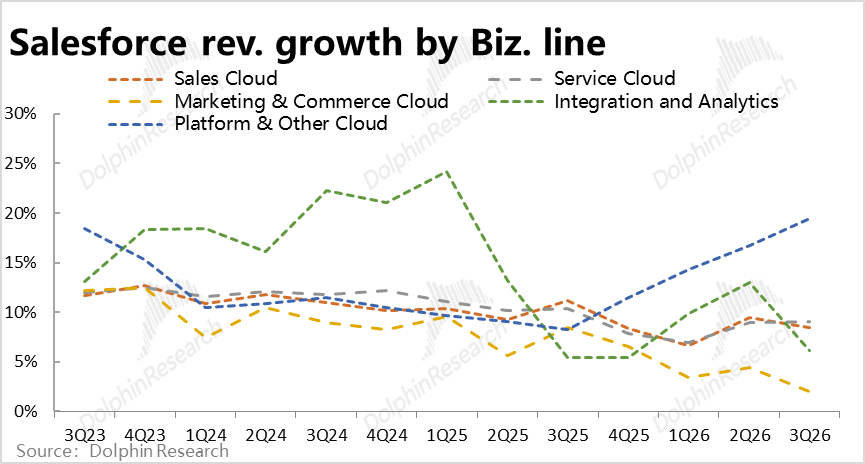
However, breaking it down by business segments, traditional businesses continued to decelerate, while the performance of service cloud and platform cloud, more intricately linked to AI Agents, was robust:
1) Among traditional businesses, commerce & marketing cloud growth remained the weakest, up only 2% year-over-year—slowing down by 2 percentage points. The foundational sales cloud grew 8.4%, also decelerating by about 1 percentage point. The analytics business (Integration & Analytics) grew 6%, showing a significant slowdown.
2) The customer service cloud, where AI Agents are most extensively utilized, and the platform cloud, which serves as the foundation for all Agentforce services, performed well. Among these, the service cloud grew 9%, with the growth rate marginally improving by 0.1 percentage points sequentially. While not particularly strong, it was still noteworthy compared to the decelerating growth of other business lines.
The platform cloud segment exhibited even stronger performance, with revenue surging by 19.5% this quarter. This marks the fifth consecutive quarter of accelerating growth, with the rate climbing from approximately 8% to nearly 20%. Although the acceleration in each individual quarter wasn't particularly dramatic (i.e., not explosive), the continuous cumulative acceleration still underscores the positive impact of AI Agents in driving business expansion.

In this quarter, revenue from professional services reached approximately $530 million, with the year-on-year decline widening to 5.7%, indicating a continued weakening trend. Overall, Salesforce's total revenue amounted to roughly $10.26 billion, representing an 8.6% increase year-on-year, or 8% when excluding the positive impact of exchange rates. Growth continued to decelerate and fell slightly short of market expectations.
II. Compared to Weakening Revenue, Leading Indicators Remain Relatively Robust
In contrast to the overall weakening revenue in the current quarter, leading indicators that reflect future growth prospects showed relatively better, albeit still not robust, growth. Specifically, the nominal year-on-year growth rate of cRPO (short-term unfulfilled balance) reached 11.4% this quarter, accelerating by 0.5 percentage points from the previous quarter. However, the cRPO balance remained unchanged at $29.4 billion compared to the previous quarter.
Similarly, the value of newly signed contracts (new bilings) this quarter stood at $87 million, up 14% year-on-year, indicating a significant increase in growth. Nevertheless, it was slightly lower than the $89.9 million recorded in the previous quarter.
Overall, the higher growth rates of cRPO and newly signed contracts were largely attributable to the lower base in the same period last year and are not considered a substantial improvement. However, when compared to the continued slowdown in revenue growth, they still appeared more favorable.
III. Will the Trend of Increasing Gross Profit Margins, Which Has Lasted Nearly Five Years, End Due to AI Investments?
In terms of gross profit, the gross profit margin of the core subscription business this quarter was 82.9%, showing a decline both year-on-year and sequentially. This marks the end of the continuous upward trend in gross profit margins since fiscal year 21. Although the company implemented across-the-board price increases for its product line in August, it failed to prevent the decline in gross profit margins, which was likely primarily due to the impact of higher-cost AI services and related investments.
Meanwhile, the gross loss rate of the professional services business slightly increased to -10.7% this quarter. Since the gross profit margins of both the subscription business and the services business deteriorated this quarter, but were partially offset by the structural increase in the proportion of the higher-margin subscription business, the company's overall gross profit margin stood at 78% this quarter. It continued to increase year-on-year but declined sequentially.
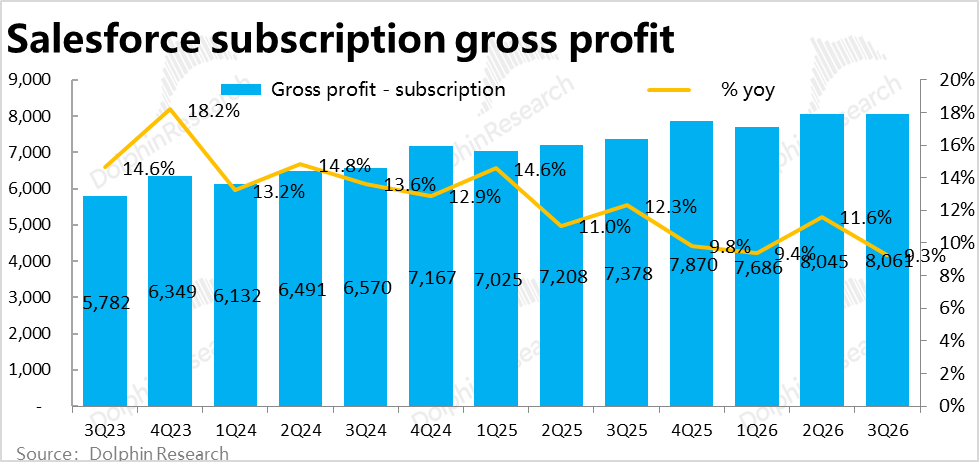
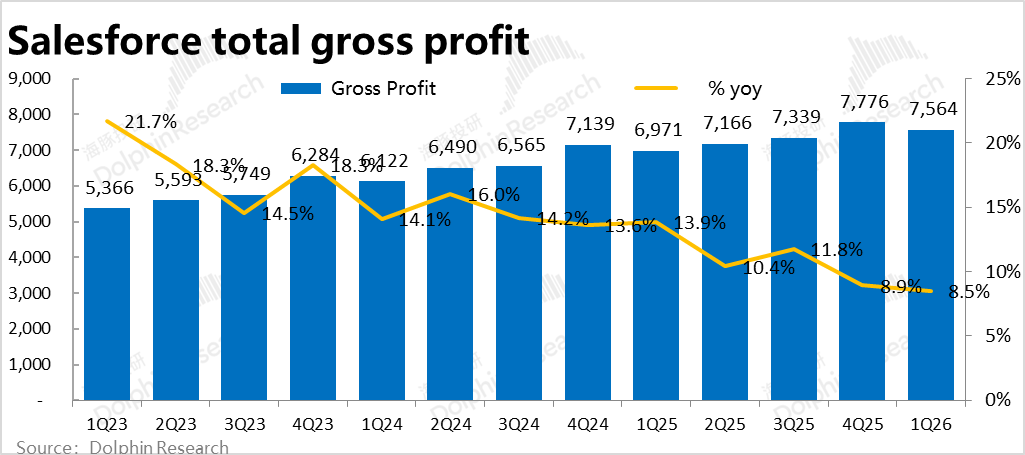
Due to the fading of the gross profit margin's amplification effect, the company's overall gross profit reached approximately $8 billion this quarter, representing only a 9.1% increase year-on-year.
IV. Cost Control Remains Very Limited
In terms of expenses, Salesforce's total operating expenses this quarter amounted to $5.82 billion, up 6.8% year-on-year. This represents a slight acceleration from the previous quarter but is slightly lower than market expectations and below the growth rates of revenue and gross profit. In other words, expense investment did not significantly increase due to the development of new businesses like Agentforce, and cost control (with operating expense ratios down 1 percentage point year-on-year) offset the impact of weakening gross profit margins.
Specifically, marketing expenses, the largest component, reached $3.46 billion, up 4% year-on-year; R&D expenses increased by 5.7% year-on-year, while administrative expenses decreased by 6.2% year-on-year. The year-on-year growth rates of all expense items significantly declined from the previous quarter.
If only considering the above three expense items, the actual year-on-year growth was merely 3.1%. However, $260 million in restructuring expenses (presumably from the acquisition of Informatica) were recognized this quarter, weakening the effect of cost control.
V. Profits Continue to Outpace Revenue, but the Leading Margin Narrows
In terms of profit performance, since the gross profit margin continued to increase year-on-year and cost control remained effective, the operating profit margin under GAAP reached 21.3% this quarter, still up 1.3 percentage points year-on-year. Consequently, operating profit increased by 15.6% year-on-year this quarter. Compared to single-digit revenue growth, profit growth was still deemed acceptable.
However, in terms of marginal trends, with the gross profit margin starting to decline sequentially, the increase in the operating profit margin also significantly narrowed from 4 percentage points in the previous quarter. Ultimately, GAAP operating profit amounted to $2.19 billion, slightly lower than sell-side expectations.
Excluding non-cash expenses (such as equity incentive fees and amortization and depreciation impacts from mergers and acquisitions), the company's more closely watched free cash flow reached $2.18 billion this quarter, roughly on par with operating profit, with a cash flow profit margin of 21%, also slightly lower than market expectations of 22%.
- END -
// Reprint Authorization
This article is an original piece by Dolphin Research. Authorization is required for reprinting.
// Disclaimer and General Disclosure
This report is intended solely for general comprehensive data purposes, catering to the general viewing and data reference needs of users of Dolphin Research and its affiliated institutions. It does not take into account the specific investment objectives, investment product preferences, risk tolerance, financial situation, or special needs of any individual receiving this report. Investors must consult with independent professional advisors before making investment decisions based on this report. Any person making investment decisions using or referring to the content or information mentioned in this report assumes their own risks. Dolphin Research shall not be liable for any direct or indirect responsibilities or losses that may arise from using the data contained in this report. The information and data in this report are based on publicly available sources and are for reference purposes only. Dolphin Research strives for, but does not guarantee, the reliability, accuracy, and completeness of the information and data.
The information or views mentioned in this report shall not, under any jurisdiction, be regarded as or considered an offer to sell securities or an invitation to buy or sell securities, nor shall they constitute recommendations, inquiries, or endorsements of relevant securities or related financial instruments. The information, tools, and data in this report are not intended for, or intended to be distributed to, jurisdictions where distribution, publication, provision, or use of such information, tools, and data conflicts with applicable laws or regulations, or where Dolphin Research and/or its subsidiaries or affiliated companies are required to comply with any registration or licensing requirements in such jurisdictions, or to citizens or residents of such jurisdictions.
This report only reflects the personal views, insights, and analytical methods of the relevant authors and does not represent the stance of Dolphin Research and/or its affiliated institutions.
This report is produced by Dolphin Research, and the copyright is solely owned by Dolphin Research. Without the prior written consent of Dolphin Research, no institution or individual may (i) produce, copy, reproduce, duplicate, forward, or distribute in any form copies or reproductions, and/or (ii) directly or indirectly redistribute or transfer to other unauthorized persons. Dolphin Research reserves all related rights.
-
![]()
Li Shufu's Lesson in 'Abstract' Thinking: With Speed Dividends Peaking, What Will Drive China's Auto Industry Through the Next Two Decades?
-
![]()
World’s Pioneering! Automated Production Line for Million-Scale Volume Holographic Waveguides Launched in Tianjin
-
![]()
Cars Can't Be Made with the 'Quick Buck' Mentality: Li Shufu's Candid yet Impactful Remarks
-
![]()
Can You Snag a Complete Trio of Digital Gadgets for 10,000 Yuan? AI Recommendation Showdown: How Trustworthy Are Doubao, DS, Qianwen, Kimi, and Yuanbao?
-
![]()
DingTalk Undergoes Leadership Overhaul Amid Alibaba’s AI Strategy Unveiling
-
![]()
Revealing the Myth of the '10 Billion Subsidy': Pinduoduo Faces Heightened Scrutiny with Its '100 Billion Initiative'
-
![]()
Yousu's '70,000-Character Long Essay' Resonates with Alibaba Executives' 'Cultural Awareness'
-
Analysis | SpaceX is about to land on Nasdaq. Where is the breakthrough point for China's commercial aerospace?