Coreweave: Computing Power Sales Soar, But Profits Falter—Is Nvidia's 'Foot Soldier' Fighting for Survival?
 05/09 2026
 601
601
AI cloud unicorn CoreWeave unveiled its Q1 2026 financial results after the U.S. stock market closed on May 8. The report paints a familiar picture: robust business and revenue growth, yet profit declines that underperform even lowered expectations. This trend suggests the company may be trapped in a vicious cycle of rising revenues but widening losses, exacerbating investor concerns about its ability to achieve sustainable profitability in the medium to long term. Key highlights include:
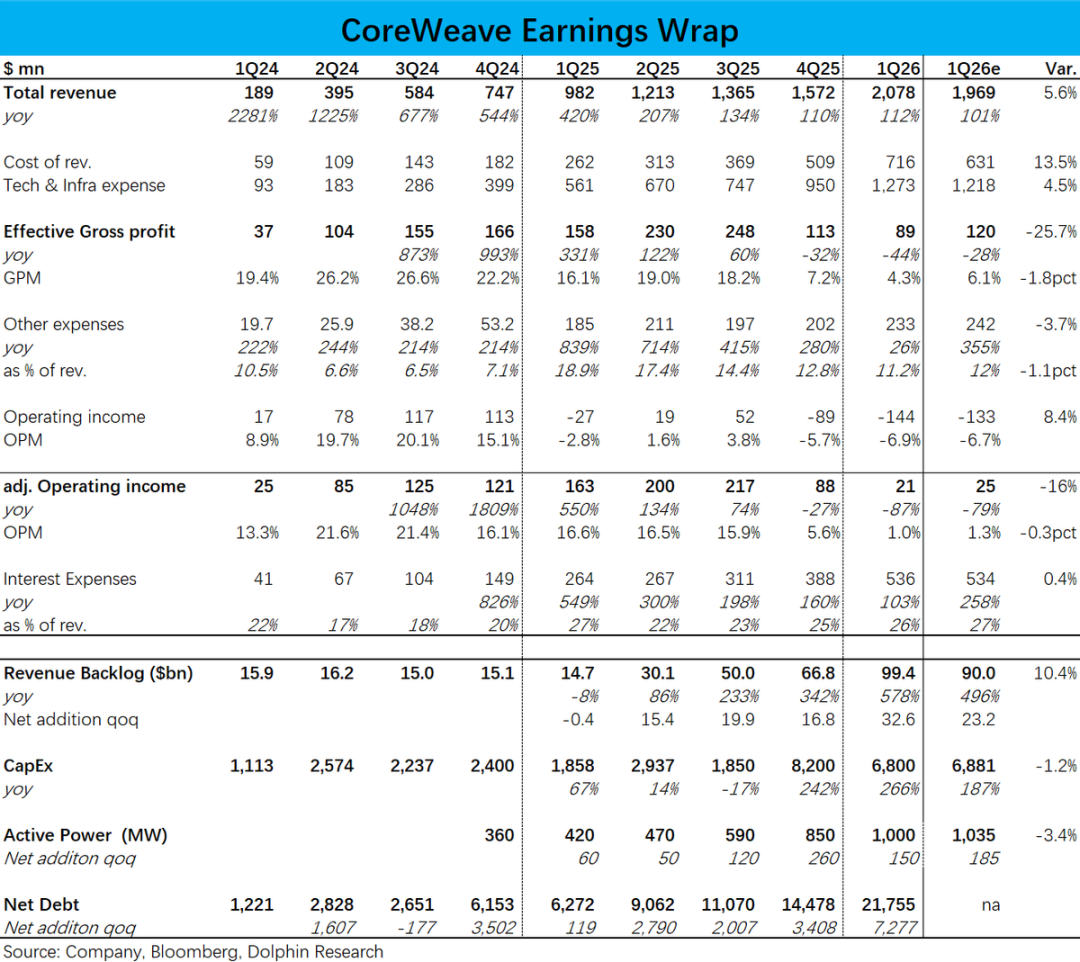
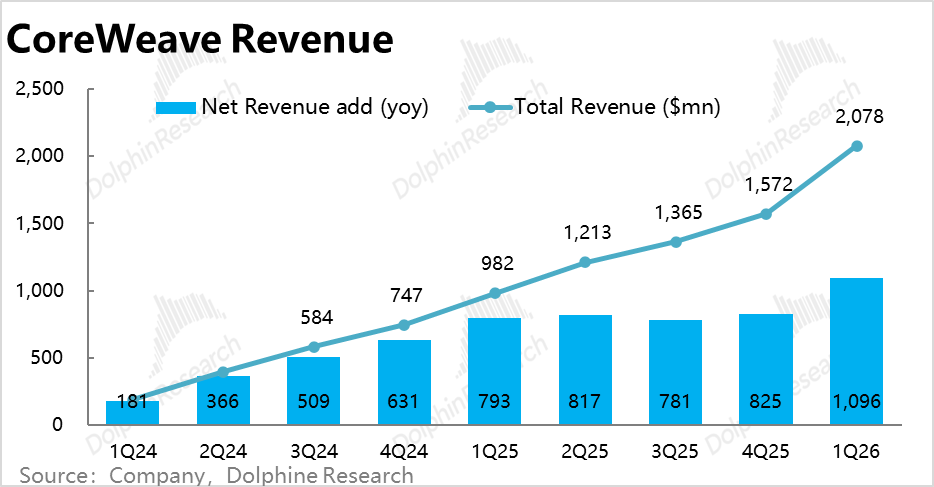
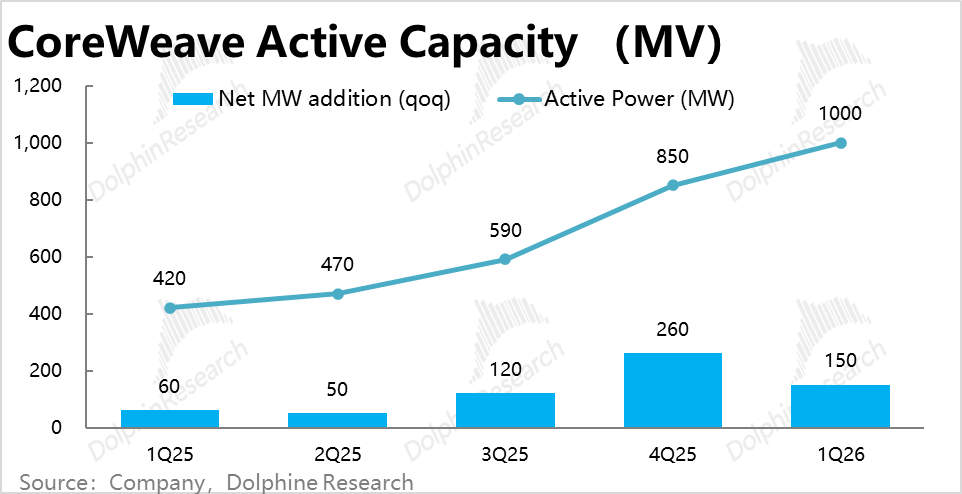
1. Record Revenue Growth: CoreWeave reported nearly $2.08 billion in revenue, surpassing market expectations of $1.97 billion and its prior guidance range of $1.9–2 billion. Year-over-year net revenue growth reached nearly $1.1 billion, another all-time high. The driving force behind this growth—deployed computing power (Active Power)—hit 1,000 MW this quarter, aligning with market forecasts. While the net increase of 150 MW marked a slowdown from the previous quarter, this was anticipated due to reduced capital expenditure (Capex) guidance compared to Q4 2025.
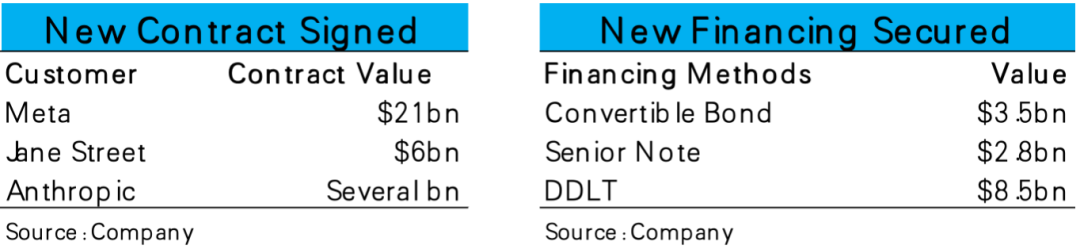
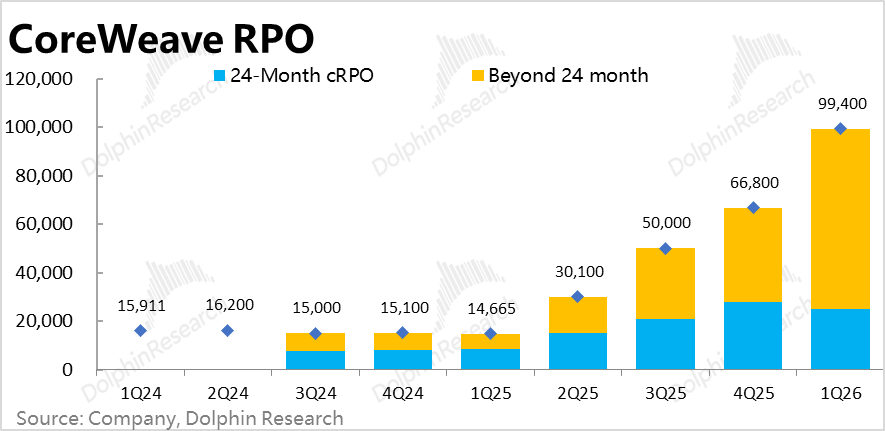
2. $30 Billion in New Orders and Customer Base Diversification: Remaining Performance Obligations (RPO) soared to $99.4 billion, a net increase of $33 billion from the previous quarter, marking the highest single-quarter new order volume. This aligns with previously disclosed deals, including $21 billion from Meta, $6 billion from Jane Street, and several billion from Anthropic. Structurally, RPO balances within 24 months declined, with all new additions extending beyond 24 months, implying most contracts won’t materialize until after 2027. Critically, CoreWeave now holds agreements with all four leading AI model providers, reducing its reliance on OpenAI as a primary client.
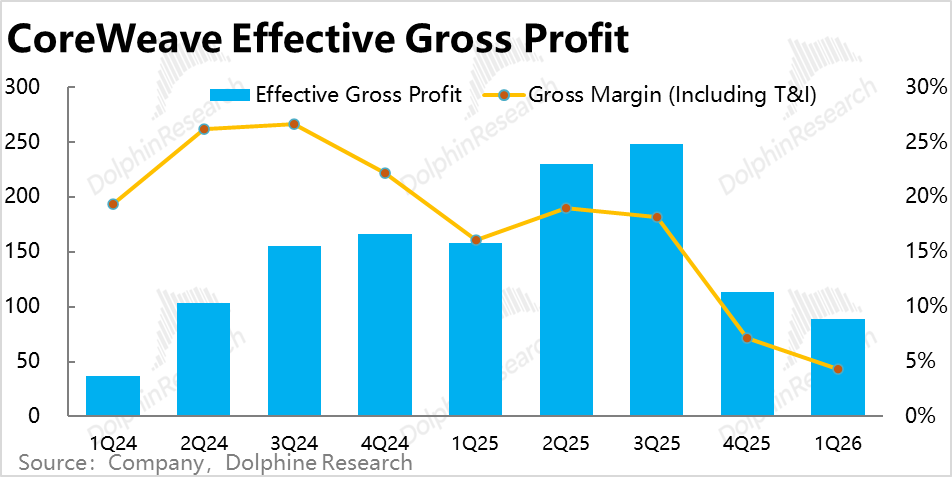
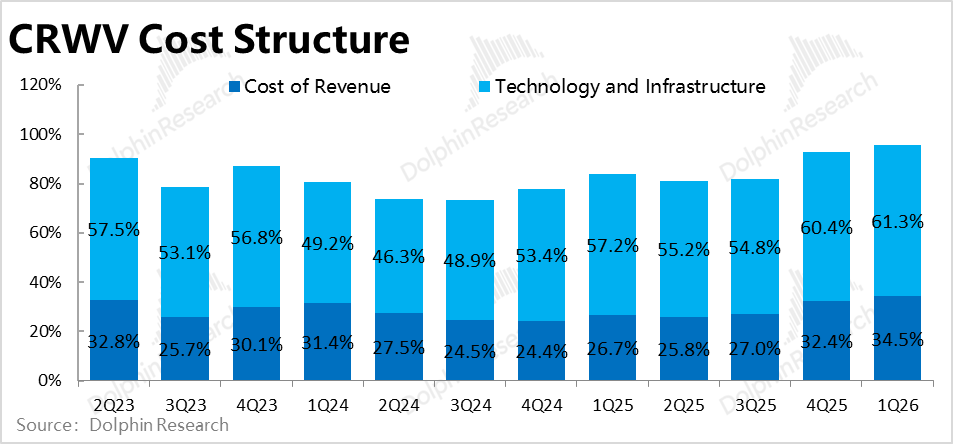
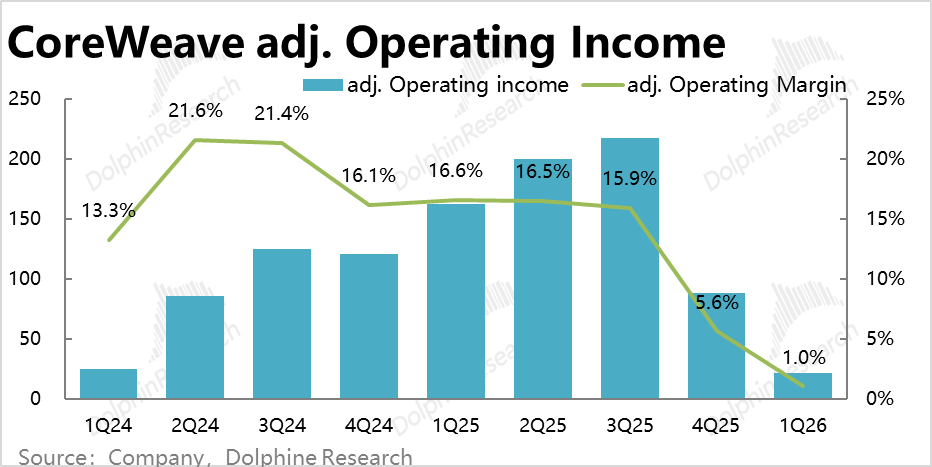
3. Profitability Pressures Mount: Despite accelerated revenue growth, profit margins deteriorated sharply. Adjusted operating losses widened to $144 million this quarter, up from $89 million last quarter, exceeding expectations. The primary culprit was gross margin compression, with the “true” gross margin (excluding revenue costs and Tech & Infra expenses) plummeting to 4.3%, down from 7.2% last quarter and below market forecasts of 6%. This reflects the intense margin pressure cloud providers face amid soaring upstream hardware costs, particularly for newer entrants like CoreWeave.
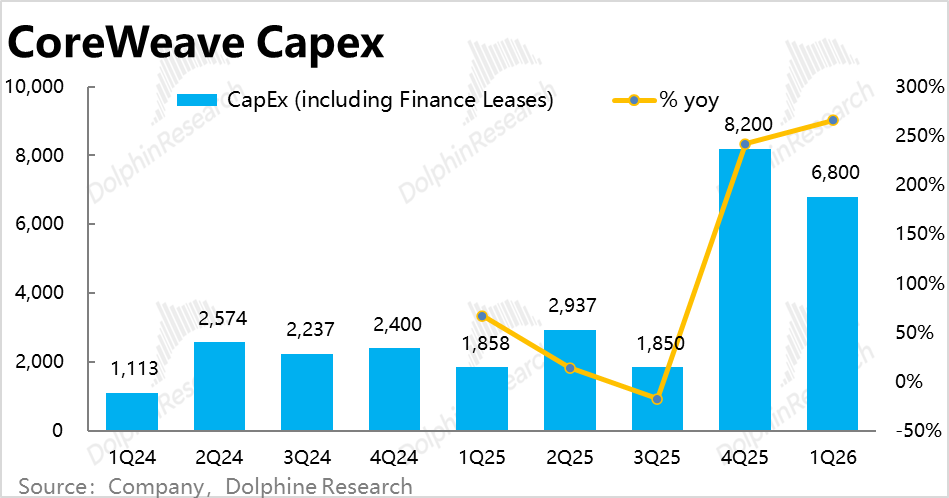
4. Capex Growth Accelerates: Capex investments reached $6.8 billion this quarter, within the $6–7 billion guidance range but down from $8.2 billion last quarter. While both Capex and deployed computing power declined quarter-over-quarter, the pace of decline differed: computing power fell 42% month-on-month, while Capex dropped less than 20%. This suggests rising Capex per unit of computing power, likely due to hardware price hikes or timing mismatches (investments made this quarter correspond to future deployments). This trend aligns with the worse-than-expected gross margin decline.
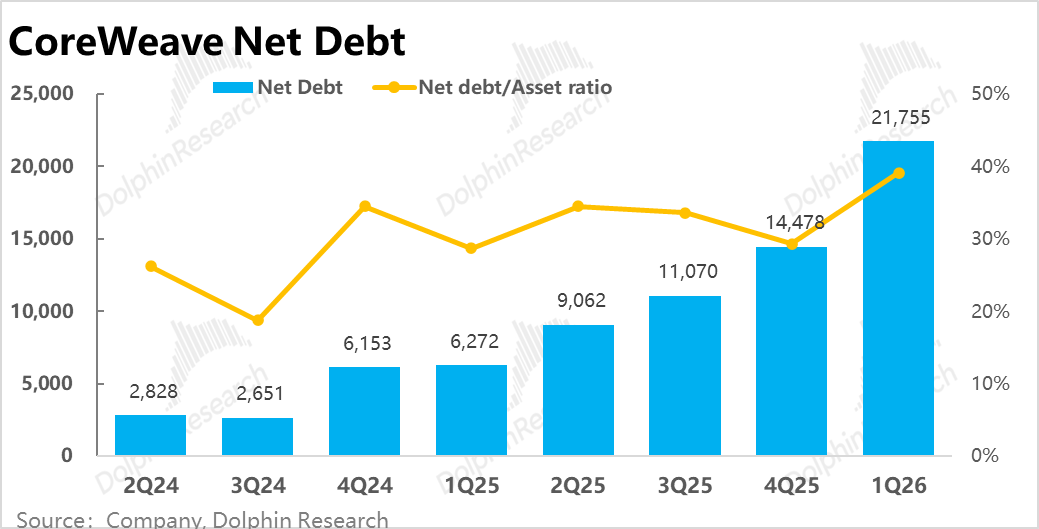
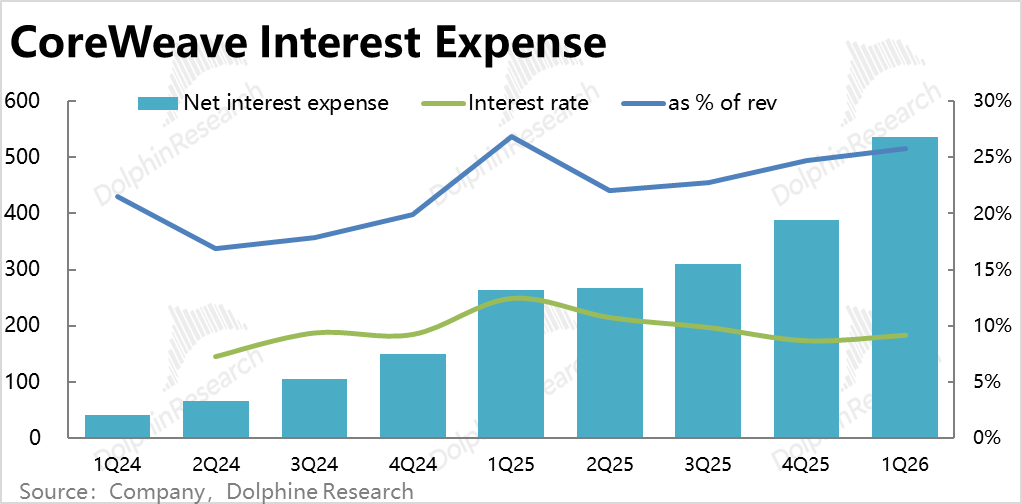
5. Debt Pressures Escalate: Rising Capex and massive investment demands pushed net debt to nearly $21.8 billion, a $7.3 billion increase from the previous quarter, with the debt-to-asset ratio climbing to 39%. Interest expenses surged to $540 million, up from $390 million last quarter, with revenue allocation rising from 25% to 26%. With average profit margins hovering around 9–10%, the financial strain from computing power investments and eroding profits is becoming unsustainable.
Dolphin Research Analysis
1. Q1 Performance: A Mixed Bag
CoreWeave’s Q1 results were a study in contrasts. On the positive side, revenue growth exceeded expectations, and the company secured multiple large-scale orders, diversifying its customer base. On the negative side, gross margin declines due to business expansion were worse than anticipated, and financing debt rose further to fund Capex. These challenges are interconnected: in the short to medium term, scaling operations amplifies profit and financing pressures, making it impossible to achieve immediate gains on both fronts. Consequently, the stock price remained stable post-earnings, suggesting investors view the quarter’s performance as neutral rather than poor. The industry takeaway? Upstream equipment price hikes are driving up computing power costs, while surging demand is boosting revenue per unit. For cloud providers, pricing power and cost advantages in equipment procurement will define core competitiveness. For CoreWeave, cost increases currently outpace price hikes.
2. Guidance Concerns
The earnings report’s bigger issue lies in its forward-looking guidance. The company projects Q2 revenue of $2.45–2.6 billion, a modest increase from Q1 and below market expectations of $2.7–2.8 billion. Capex guidance for Q2 stands at $7–9 billion, also a slight uptick. Given full-year 2026 revenue expectations of $12–13 billion, with less than $4.7 billion generated in H1, Q3 and Q4 revenues must average nearly $4 billion per quarter—a daunting target. This raises doubts about whether the company can accelerate growth in H2 to meet annual goals, particularly after a lackluster H1 computing power ramp-up. On profits, Q2 adjusted operating profit is expected to hit $30–90 million, implying a 2.4% margin, up from 1% in Q1. While margin improvements are anticipated as computing power utilization rises, the absolute profit levels remain too low to alleviate concerns.
3. Recent Developments and Investment Logic
CoreWeave’s investment appeal has improved recently, reflected in its stock price rebounding 100% from its lows after a 65% peak-to-trough decline. The earlier correction stemmed from market skepticism about the ROI of massive Capex investments in cloud computing—whether demand would justify the scale of computing power builds and whether AI business margins could cover soaring costs. Newer cloud providers like CoreWeave and Oracle faced heightened risks due to their smaller scale, weaker technical capabilities, and limited capital. Recent improvements stem from industry and company-specific factors:
a. Large Order Wins: Since April, CoreWeave has announced several major deals, including an additional $21 billion order from Meta over 6–7 years (on top of an existing $14 billion contract), $6 billion from Jane Street, and several billion from Anthropic. Beyond driving revenue growth, these deals cement Meta as a top client and diversify CoreWeave’s customer base, reducing reliance on the OpenAI + Microsoft ecosystem (now accounting for <40% of total RPO). The company now partners with all four leading AI model providers.
b. $15 Billion in New Funding: CoreWeave plans to raise $3.5 billion via convertible bonds, $2.8 billion through Senior Notes, and has secured $8.5 billion in new loan agreements. This $15 billion funding infusion ensures Capex support for at least the next year. Critically, the interest rate on its new DDLT loan is SOFR+225bps (floating) and 5.9% (fixed), significantly lower than its current ~10% average rate. Given that interest expenses now consume nearly 30% of revenue, lower borrowing costs will materially improve profit margins.
4. Macro Outlook vs. Short-Term Volatility
From a macro perspective, CoreWeave is in an improvement cycle, as evidenced by its stock price recovery. However, after significant gains, issues like slower-than-expected computing power ramp-ups—leading to lower revenue guidance—have introduced short-term volatility. As a high-beta, speculative stock, such fluctuations are expected. For a deeper valuation analysis, refer to the “Dynamic-Depth” section of the Changqiao App.
In summary, CoreWeave has immense long-term potential (with computing power demand potentially driving revenues into the tens or even hundreds of billions). However, based on current deliverables, it remains a high-risk investment without a clear valuation floor.
Detailed Analysis
I. Record Revenue and Order Growth
1. CoreWeave generated nearly $2.08 billion in Q1 revenue, up 112% year-over-year, exceeding market expectations of $1.97 billion and its prior guidance of $1.9–2 billion. The net year-over-year increase reflects accelerating growth. Deployed computing power reached 1,000 MW, a 150 MW increase from Q4 2025, though the growth rate slowed due to seasonal factors and reduced Capex. Revenue per MW rose from ~$8.7 million to ~$9 million, likely driven by price hikes from high demand and improved utilization of newly built capacity.
2. RPO surged to $99.4 billion, a $33 billion net increase from Q4 2025, marking another record for single-quarter new orders. This aligns with reported deals from Meta, Jane Street, and Anthropic. Structurally, RPO balances within 24 months declined, with all new additions exceeding 24 months, implying most contracts won’t activate until after 2027.
II. Profitability Challenges Persist
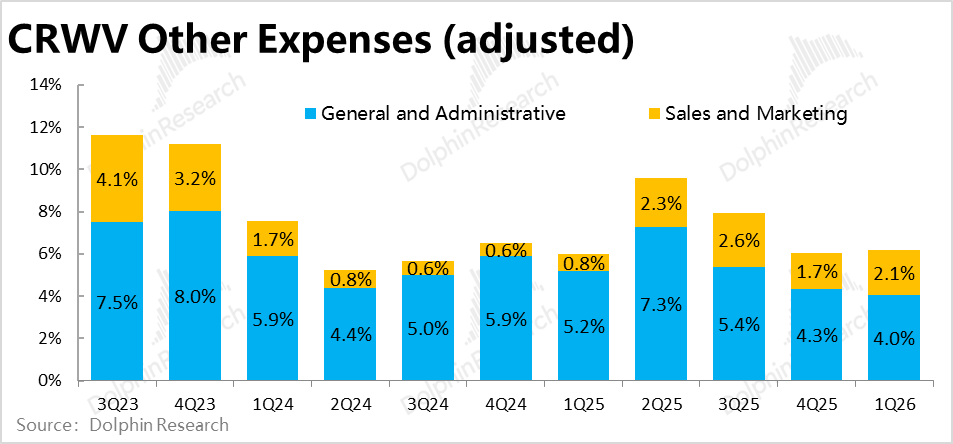
Despite robust revenue growth, profit pressures intensified. The “true” gross margin fell to 4.3% this quarter, down from 7.2% in Q4 2025 and below market expectations of 6%. Direct data center operating costs (e.g., rent, energy) rose sharply, while Tech & Infra expenses increased moderately. Marketing and management expenses remained low due to CoreWeave’s focus on a few AI giants, leaving gross margin declines as the primary driver of operating profit deterioration. Adjusted operating losses widened to $144 million (vs. $89 million in Q4 2025), reflecting the strain of soaring upstream hardware costs and AI business scaling.
III. Escalating Balance Sheet Pressures
In tandem with the company's business expansion, capital expenditures (Capex) for this quarter amounted to 6.8 billion yuan, aligning with the company's prior guidance range of 6 to 7 billion yuan. This represents a decrease from the 8.2 billion yuan recorded in the previous quarter, reflecting the reduced computing power deployed this quarter compared to the last. Nevertheless, Capex investment still soared to nearly 330% of the quarterly revenue.
In response to the substantial Capex requirements, net debt surged to nearly 21.8 billion yuan this quarter, marking a quarter-on-quarter increase of nearly 7.3 billion yuan. Consequently, the debt ratio (as a percentage of total assets) climbed to 39%. As a result, interest expenses also rose, reaching nearly 540 million yuan, up from 390 million yuan in the previous quarter, with the proportion of income increasing from 25% to 26%.
It is clear that the strain on the company's balance sheet is intensifying, and the impact of debt on profit margins is becoming increasingly pronounced and severe.
- END -
// Reprint Authorization
This article is an original work by Dolphin Research. Prior authorization is required for any reprints.
// Disclaimer and General Disclosure Notice
This report is intended solely for general comprehensive data purposes, designed for the general reading and data reference of users of Dolphin Research and its affiliated institutions. It does not consider the specific investment objectives, investment product preferences, risk tolerance, financial situation, or special needs of any individual receiving this report. Investors must consult with an independent professional advisor before making any investment decisions based on this report. Any person making investment decisions based on or referring to the content or information mentioned in this report shall bear their own risks. Dolphin Research shall not be held liable for any direct or indirect responsibility or loss that may arise from the use of the data contained in this report. The information and data in this report are based on publicly available sources and are for reference purposes only. Dolphin Research strives to ensure, but does not guarantee, the reliability, accuracy, and completeness of the relevant information and data.
The information mentioned or views expressed in this report shall not, under any jurisdiction, be considered or construed as an offer to sell securities or an invitation to buy or sell securities, nor shall it constitute advice, solicitation, or recommendation regarding securities or related financial instruments. The information, tools, and materials contained in this report are not intended for or designed to be distributed to individuals or residents in jurisdictions where the distribution, publication, provision, or use of such information, tools, and materials would contravene applicable laws or regulations, or would require Dolphin Research and/or its subsidiaries or affiliated companies to comply with any registration or licensing requirements in such jurisdictions.
This report solely reflects the personal views, insights, and analytical methods of the relevant creators and does not represent the stance of Dolphin Research and/or its affiliated institutions.
This report is produced by Dolphin Research, and the copyright is exclusively owned by Dolphin Research. Without the prior written consent of Dolphin Research, no institution or individual shall (i) make, copy, reproduce, duplicate, forward, or create any form of copies or reproductions in any manner, and/or (ii) directly or indirectly redistribute or transfer to other unauthorized persons. Dolphin Research reserves all relevant rights.
-
![]()
AI Giants Start Borrowing to Fuel Computing Power Race
-
ByteDance Initiates Largest B2B Structural Adjustment, This Time It's Truly Different
-
![]()
Let's Talk About Kingsoft Office's Mid-Year Outlook and the True Strength of Its AI-Powered Office Solutions
-
Despite 150 Million Users, Struggles Persist: AIShige Faces Tough Competition from Seedance and Kling in AI Video Monetization
-
![]()
Ensuring Safe Gear Shifting in the Automotive Industry: Transitioning from 'Product Oversight' to 'Full-Chain Governance'
-
![]()
Net Profit Soars to $133.7 Billion! Azure Revenue Tops $100 Billion, with AI Fueling Microsoft's Growth
-
![]()
Before 6G Hits the Market, the U.S. Forges a 'Rules Alliance': What Challenges Await Chinese IoT Enterprises?
-
![]()
Intelligent Driving's 'Little Blue Light' Faces Ban: Night Glare and Cut-in Risks Prompt Official Action