What is the recovery timeline for Microsoft after the breakup?
 05/09 2026
 507
507
After the U.S. stock market closed on April 30, Microsoft released its earnings report for the third quarter of fiscal year 26, which ended in March. Overall, Microsoft's performance this quarter remained steady, with most core metrics surpassing market expectations but lacking meaningful highlights. Here are the details:
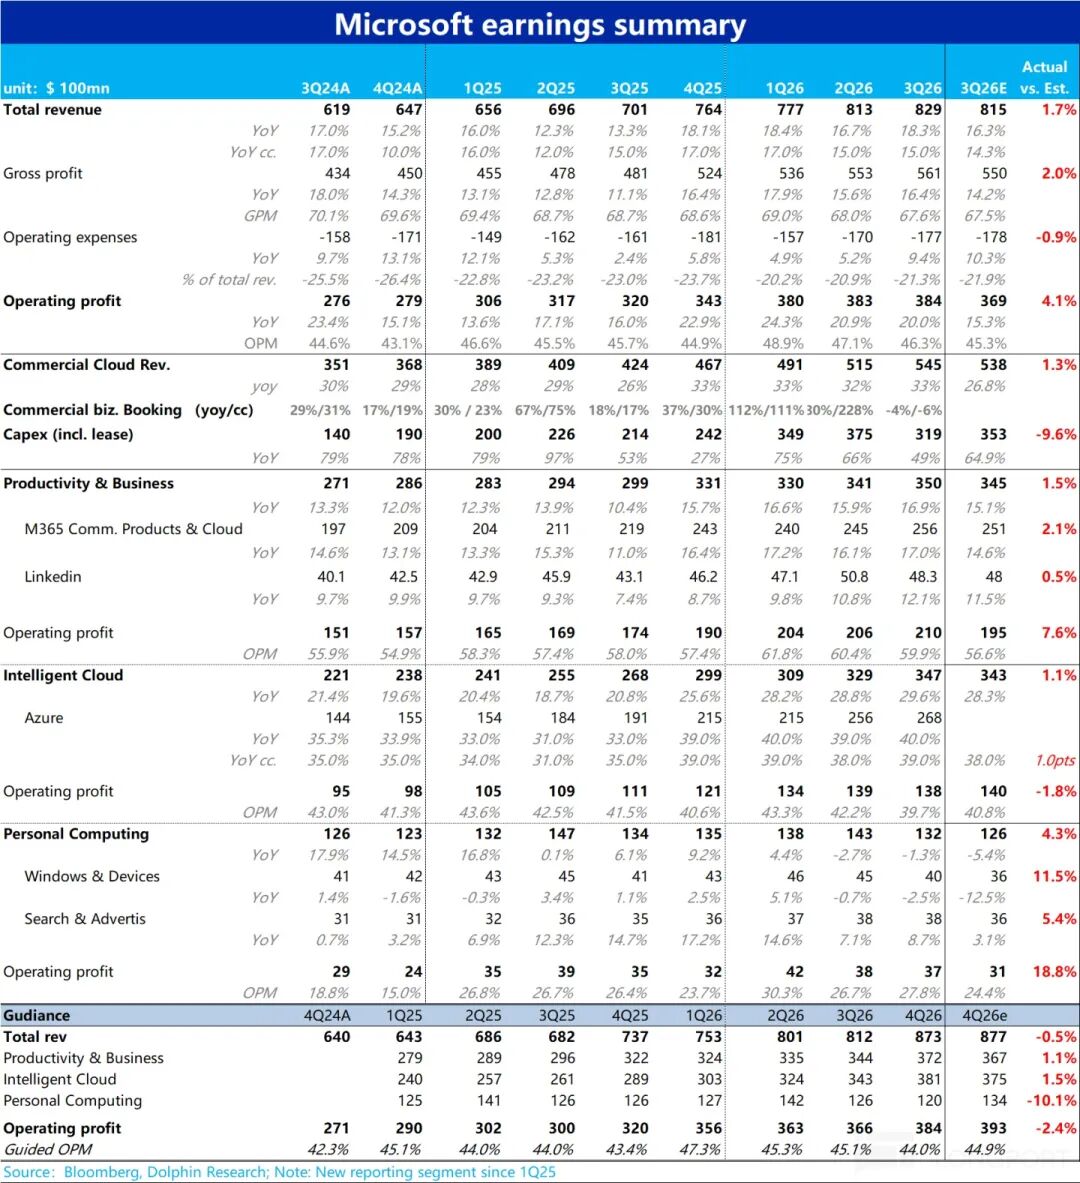
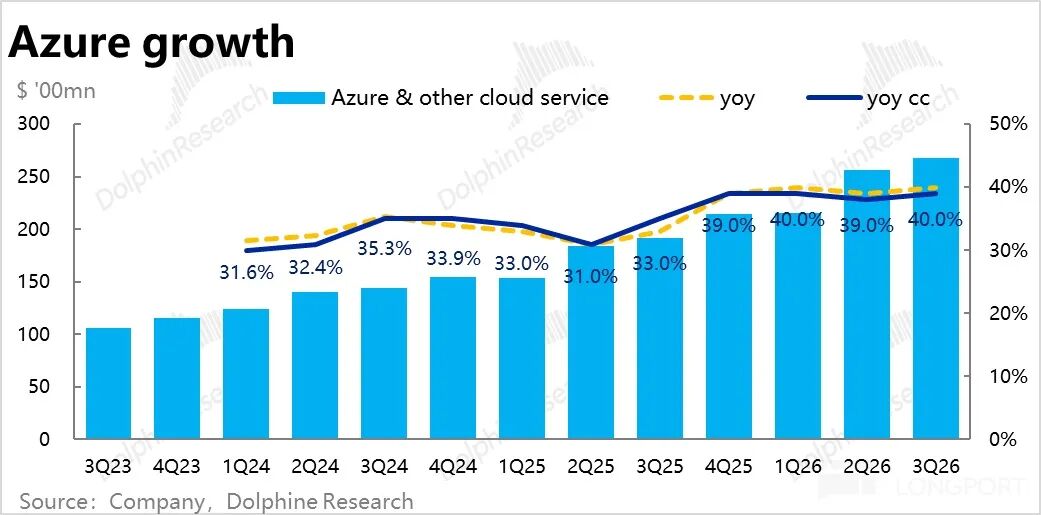
1. Azure reaccelerates but offers no surprises: The highly anticipated Azure business saw a 40% YoY revenue increase this quarter, or 39% excluding foreign exchange impacts, accelerating by 1 percentage point (pct) from the previous quarter. While reacceleration is a positive signal, Azure still underperformed compared to the strong acceleration of AWS and GCP this quarter.
Dolphin Research believes the primary reason is the further decoupling of Microsoft's cooperation with OpenAI, as OAI shifted compute orders to other cloud service providers (CSPs). Another factor is Microsoft's stated priority of allocating compute supply to first-party (1P) products (e.g., Copilot) and internal development (proprietary models).
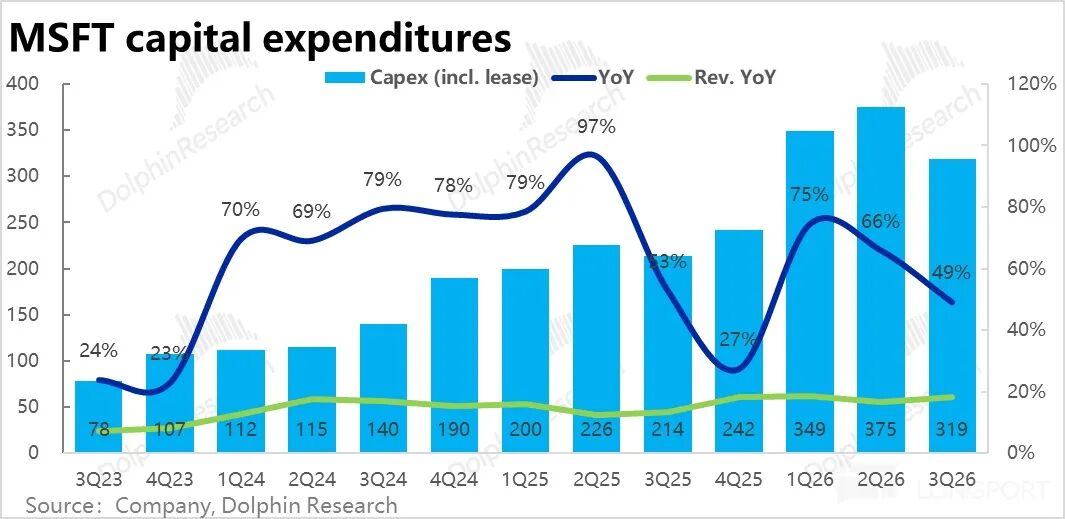
2. Capex decreases unexpectedly, aligning with Azure growth: Corresponding to Azure's plateauing growth, downgraded cooperation with OpenAI, and reduced new orders, Microsoft's actual Capex (including leases) this quarter was $31.9 billion, a month-on-month decrease (quarter-over-quarter) decrease of over $5 billion and below market expectations.
This reflects Microsoft's dynamic matching of investment intensity with front-end demand. As the company expects Azure growth to reaccelerate in the second half of the year, Microsoft guided next quarter's Capex to rise to $40 billion, with full-year FY26 Capex reaching as high as $190 billion. This implies an average quarterly expenditure (spending) of over $50 billion for the remaining three quarters, a substantial increase.
3. Office business sustains growth through price hikes: The core Office business (including enterprise and consumer versions) in the Productivity segment maintained stable seat growth and relied on price increases to sustain revenue growth this quarter.
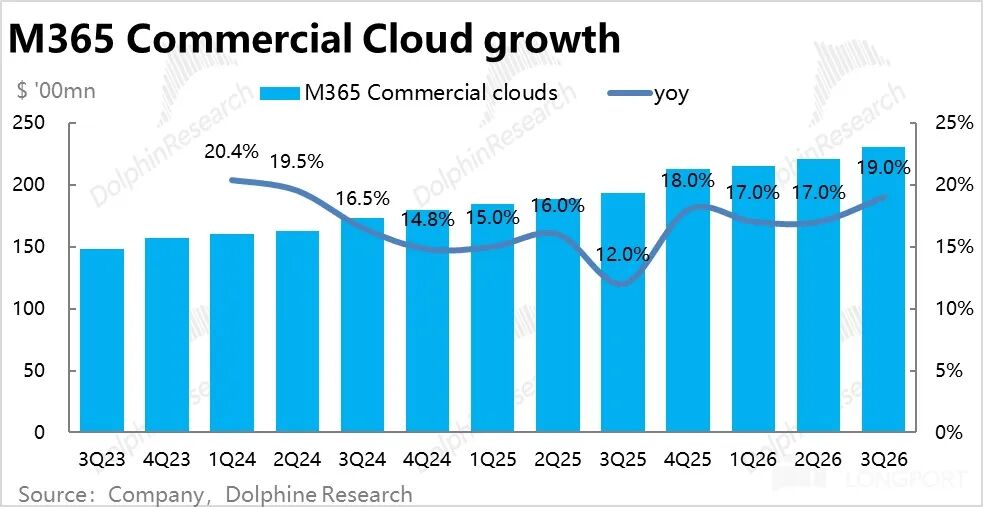
Specifically, revenue from commercial Microsoft 365 cloud services, the second most important segment, grew 19% YoY, accelerating by 2 pcts from the previous quarter. However, excluding foreign exchange benefits, the true sequential revenue acceleration was 1 pct.
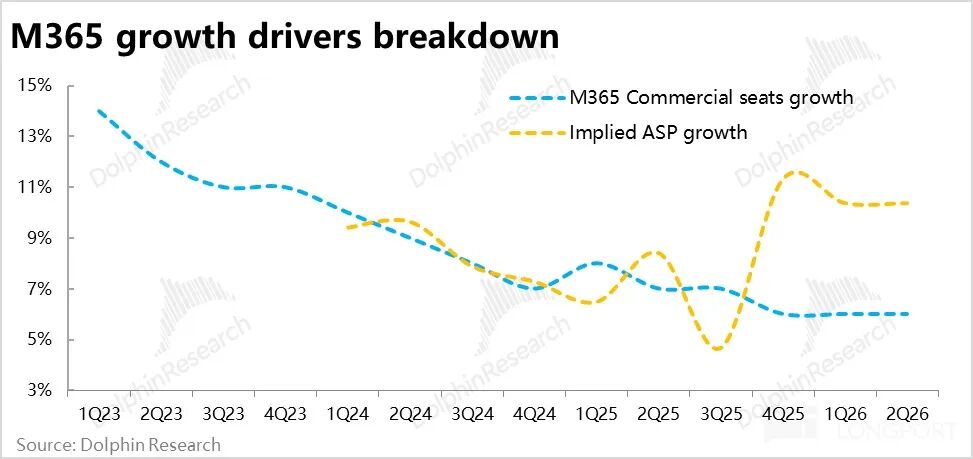
Breaking it down by volume and price, the number of commercial M365 subscription seats increased 6% YoY, flat from the previous quarter. The implied YoY increase in average revenue per user was about 12%, likely driven by product mix upgrades and foreign exchange tailwinds.
However, other business lines generally experienced weak growth, so the Productivity segment's overall growth rate, excluding foreign exchange impacts, was 13%, slightly slowing by 1 pct from the previous quarter.
4. Personal business remains weak but outperforms low expectations: Growth in the Personal segment remained sluggish this quarter, with revenue declining -1% YoY—better than the previously guided -5% decline and exceeding low expectations.
This was primarily due to a 2.5% decline in Windows and hardware revenue, less severe than the previously guided 10% decline. This aligns with market research showing actual PC shipments increased 2%~4% YoY in Q1, indicating less weakness than feared.
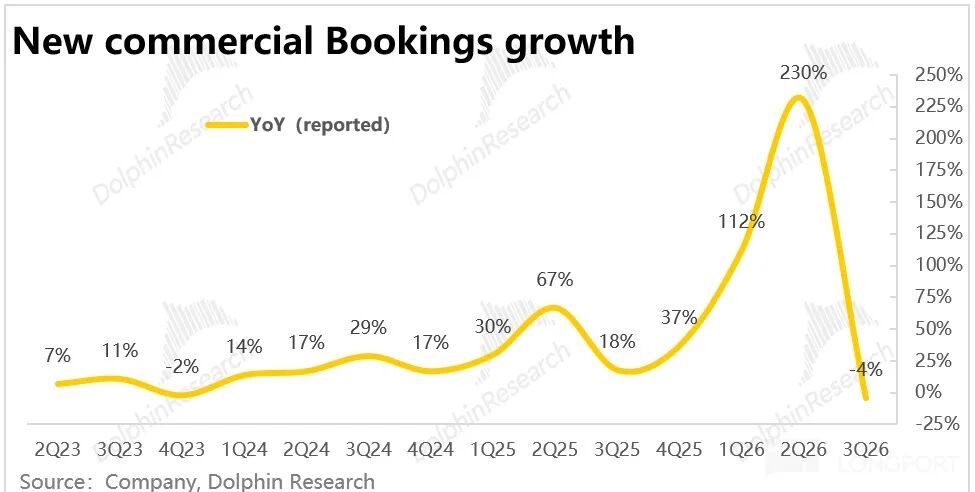
5. OpenAI order shifts? New contract growth turns negative: The value of newly signed enterprise contracts declined 4% YoY this quarter, a sharp contrast to the 230% YoY surge in the previous quarter. We attribute this mainly to the impact of OAI no longer placing large new orders with Microsoft after renegotiating cooperation agreements. Excluding OAI orders, new contract value increased about 7% YoY this quarter.
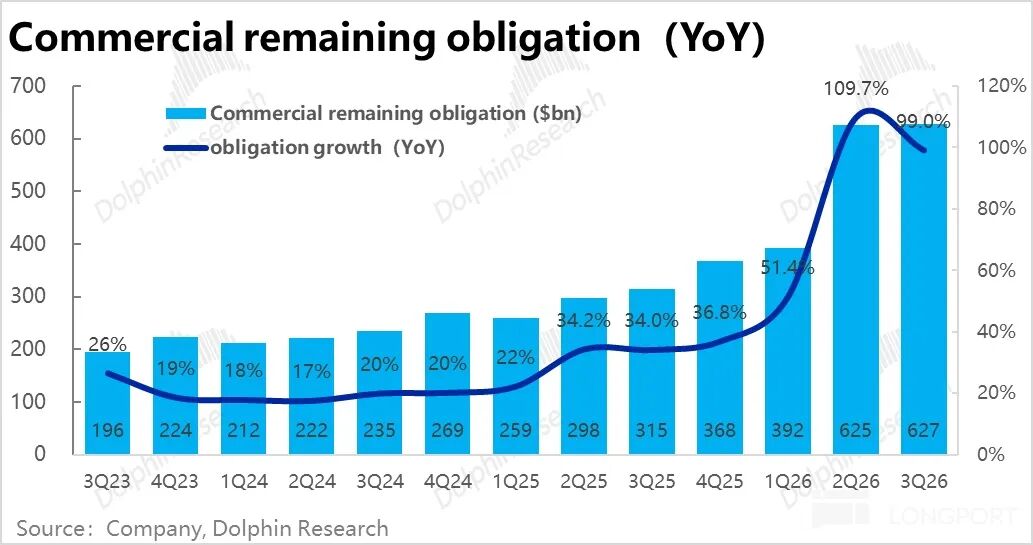
Similarly, the company disclosed that the remaining performance obligation (RPO) for enterprise contracts was $627 billion, increasing by only $2 billion sequentially. Excluding OAI orders, RPO grew 29% YoY, according to the company.
Thus, after losing OAI as a major client, Microsoft faces challenges in securing new orders.
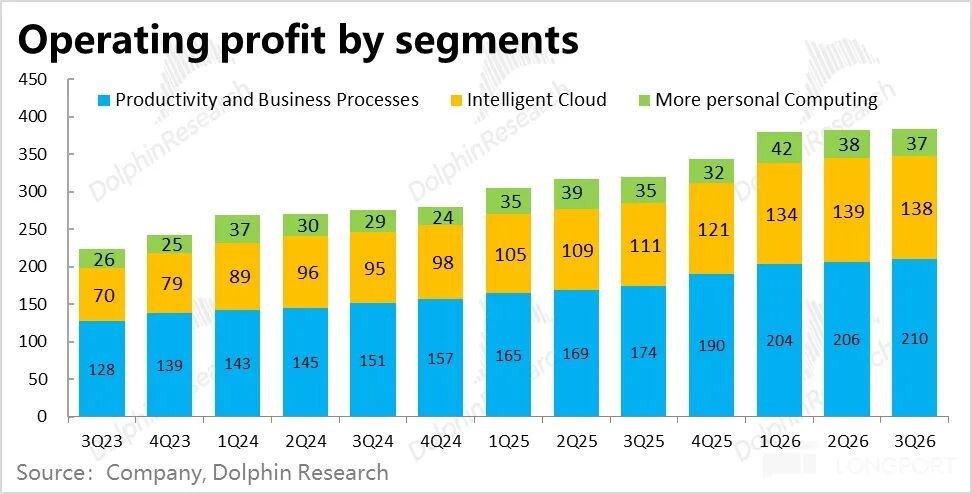
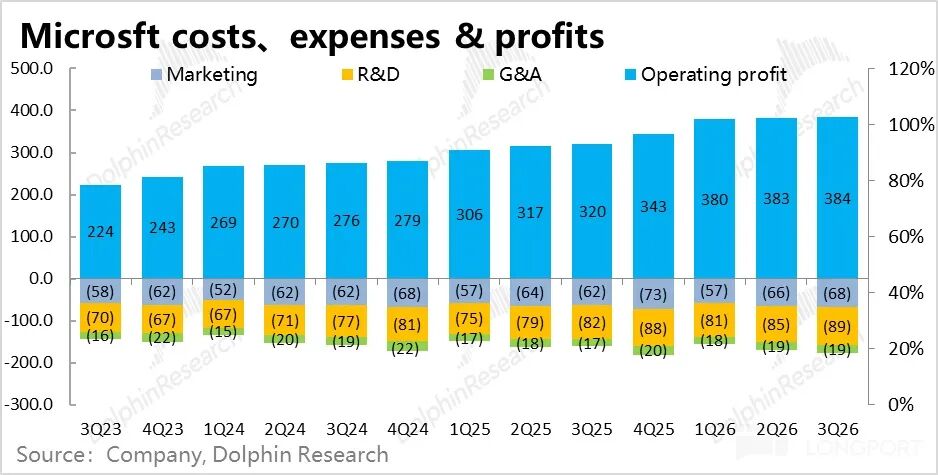
6. Profits remain unimpressive: Overall operating profit this quarter was $39.4 billion, up 20% YoY. At first glance, this significantly outpaces revenue growth, indicating rising profit margins. However, excluding foreign exchange benefits, actual operating profit growth was 16%, only slightly outpacing the 15% revenue growth, meaning profit margins remained roughly flat YoY.
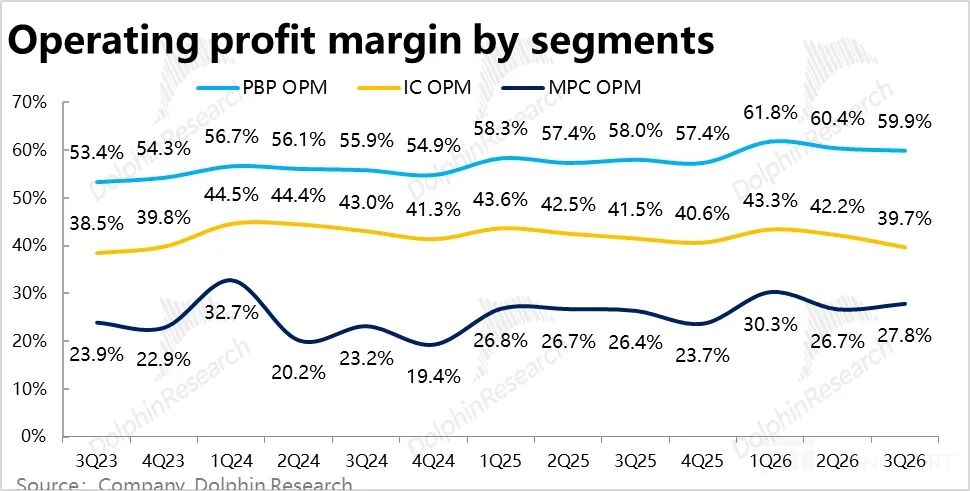
By segment, the operating margin for the Intelligent Cloud segment was 39.7%, down 1.8 pcts YoY—a sharper decline than the 0.3-pct drop in the previous quarter. Capex investments increasingly pressure cloud segment margins. Meanwhile, operating margins for the Productivity Processes and Personal Computing segments saw slight improvements this quarter, excluding foreign exchange benefits.
7. Gross margin faces significant pressure, with expenses offsetting to some extent: The overall gross margin this quarter was 67.6%, down 1.1 pcts YoY—a larger decline than the 0.7-pct drop in the previous quarter. This was entirely due to margin contraction in the Intelligent Cloud segment (down a full 5 pcts YoY), while the other two segments maintained or slightly improved margins.
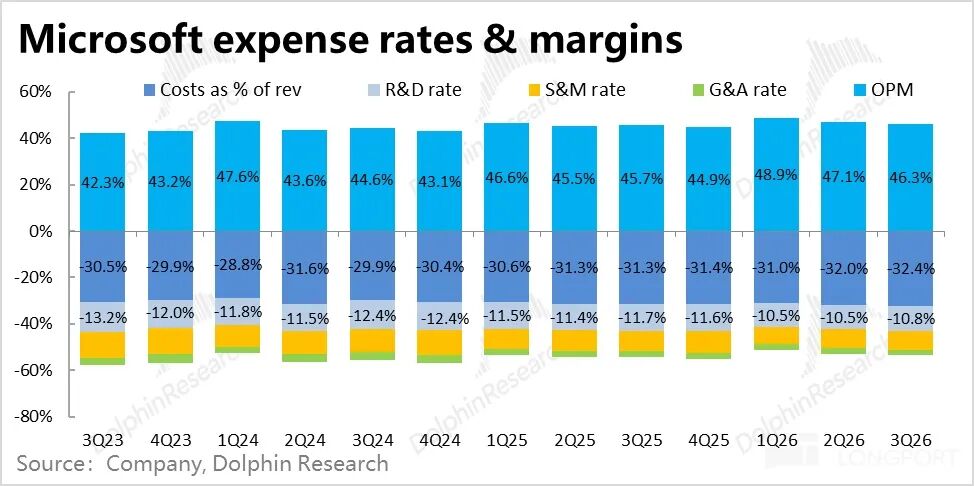
This quarter, cost control remained the primary means of offsetting margin pressure. Total operating expenses grew just 9.4% YoY (or 8% excluding foreign exchange impacts), well below revenue growth, reducing the expense ratio by about 1.7 pcts YoY. However, expense growth accelerated this quarter compared to the previous quarter's 5%, primarily due to increased marketing and administrative spending.
Dolphin Research's Viewpoints:
1. Steady but unimpressive performance: Overall, Microsoft's quarterly results were neither outstanding nor disappointing. While most metrics surpassed expectations, the lack of true highlights is concerning. In a competitive landscape where stagnation equates to regression, Microsoft's performance trails behind key rivals Google and Amazon.
For Dolphin Research, several unexpected and valuable insights from this earnings report include: a) The significant and immediate impact of the downgraded cooperation with OpenAI on securing new orders; b) The Intelligent Cloud segment's gross margin declined a full 5 pcts YoY, far worse than AWS's margin contraction.
2. Azure growth guidance improves:
1) First, the company guided next quarter's total revenue growth to range between 13%~15%, with foreign exchange tailwinds reducing to 1 pct. At the upper end of the guidance (constant currency growth of 14%), this represents a 1-pct slowdown from this quarter.
Notably, Azure's constant currency growth is guided at 39%~40%—flat or slightly accelerating from this quarter, continue (continuing) the positive trend but with only marginal improvement. Meanwhile, the company expects Azure growth to further accelerate in the second half of FY26, a promising direction that warrants monitoring for actual improvement.
Dolphin Research believes this guidance is largely achievable, given the substantial planned Capex increases and the company's stated commitment to dynamically optimize (increase) compute supply for third-party (3P) businesses.
Revenue growth guidance for the Productivity segment is centered at 12%, broadly in line with expectations. However, guidance for the Personal Computing segment appears overly conservative, implying a 10% YoY revenue decline—significantly worse than expected.
2) On profits, the upper end of the company's guidance range suggests about $38.8 billion in operating profit, below market expectations of $39.3 billion. At the upper end, implied profit growth is 13%, lagging revenue growth and indicating greater margin pressure next quarter than this quarter.
At the midpoint of guidance, the implied overall operating margin of 44% would decline 0.9 pcts YoY, reflecting expected cost pressures—guidance calls for costs to grow 22%~23% YoY (including about 1.2 pcts in restructuring expenses), significantly outpacing revenue growth. Expense growth is expected to remain low at around 7%.
3. Transformation pains become increasingly evident:
Historically, Microsoft's investment thesis has been closely tied to its partnership with OpenAI. However, since Microsoft and OpenAI renegotiated and signed a new cooperation agreement in October 2025 (as discussed in detail in our previous earnings review, "Is Microsoft Still Attractive After 'Drifting Apart' from OpenAI?"), the relationship has undergone further changes, including:
a. Microsoft no longer exclusively holds distribution and usage rights for OpenAI's products and models—Amazon has also gained these rights.
b. Microsoft remains OAI's "primary" compute supplier, but OpenAI is clearly reducing its reliance on Microsoft by allocating more new orders to other partners like Oracle, Amazon, and CoreWeave.
c. Microsoft can still use OpenAI's models and other IP until 2032 and no longer needs to share revenue with OpenAI when distributing its IP, which benefits Microsoft's gross margins.
d. Conversely, OpenAI's revenue sharing with Microsoft (as a shareholder) will terminate in 2030, and a new maximum cumulative sharing cap has been agreed upon (not disclosed).
Thus, one key reason for Microsoft's recent underperformance is the downgraded partnership with OpenAI—short-term impacts include Azure growth hitting a bottleneck, while mid-to-long-term implications see Microsoft losing the large language model (LLM) advantage it had when exclusively tied to OpenAI, as well as lacking an edge in ASIC chips.
Compared to Google, which excels in all three core capabilities (LLMs, cloud, and chips), and Amazon, which possesses cloud and chip capabilities, Microsoft now appears the least competitive. Hence, Microsoft faces high urgency to develop a "decent" proprietary LLM or ASIC chip.
Another issue is the shifting focus of AI development—from primarily serving consumer (C-end) users and monetizing through e-commerce and advertising to targeting enterprise (B-end) users and monetizing through productivity enhancements. Consequently, AI's primary threat has shifted from industries like search, e-commerce, and OTA to work software.
Thus, beyond weakening cloud competitiveness, Microsoft's Productivity Processes segment now risks becoming a potential victim of AI displacement. These are major issues for Microsoft's current investment thesis.
4. Microsoft's countermeasures: Clearly, Microsoft is not sitting idle. In addition to long-term measures like increasing Capex to allocate more compute to Azure for revenue generation and striving to develop proprietary LLMs and improve ASIC chips, Microsoft has taken immediate actions:
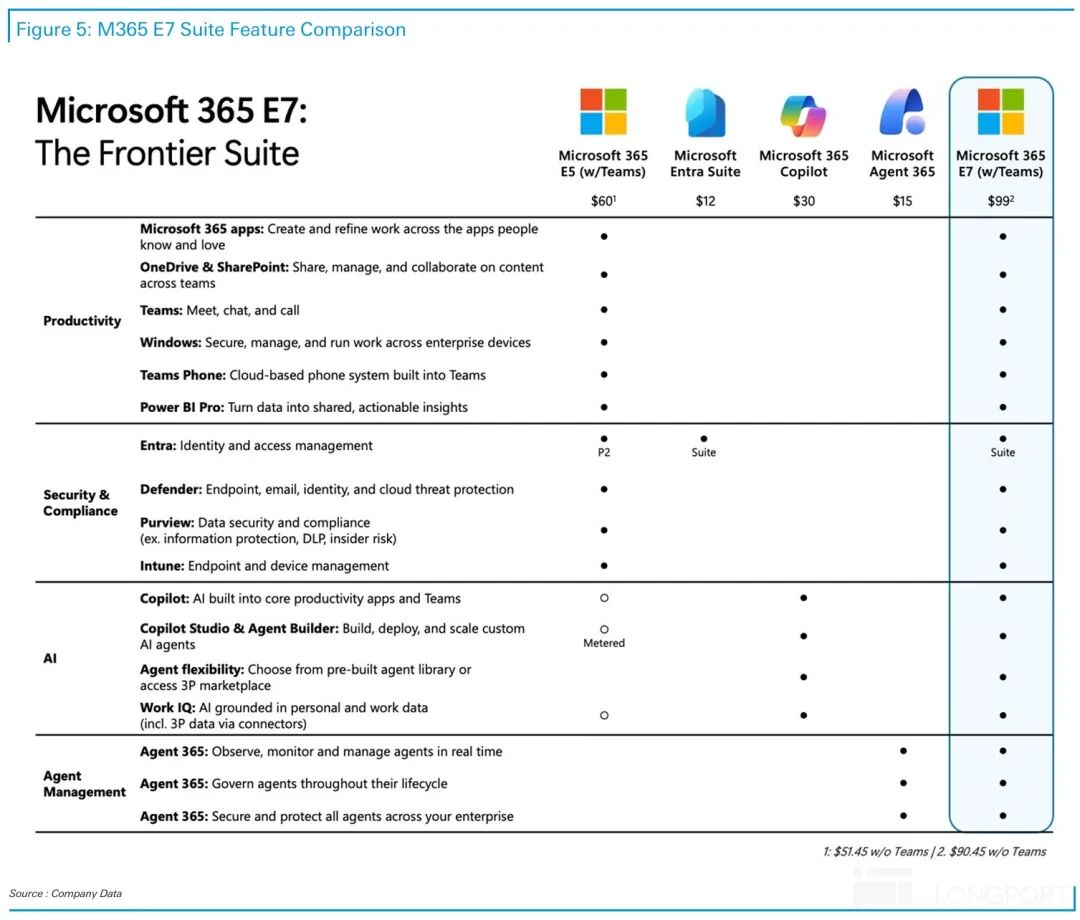
One effective move is the launch of the M365 E7 suite, positioned above the existing top-tier E5 suite. In addition to E5's features, E7 includes built-in Copilot, Agent 365, Entra, and other add-ons. The base pricing increases from $60 (E5) to $99—a price hike exceeding 50%.
Besides introducing E7, Microsoft will implement broad price increases for other existing products starting July 1. Specific pricing adjustments are shown below.
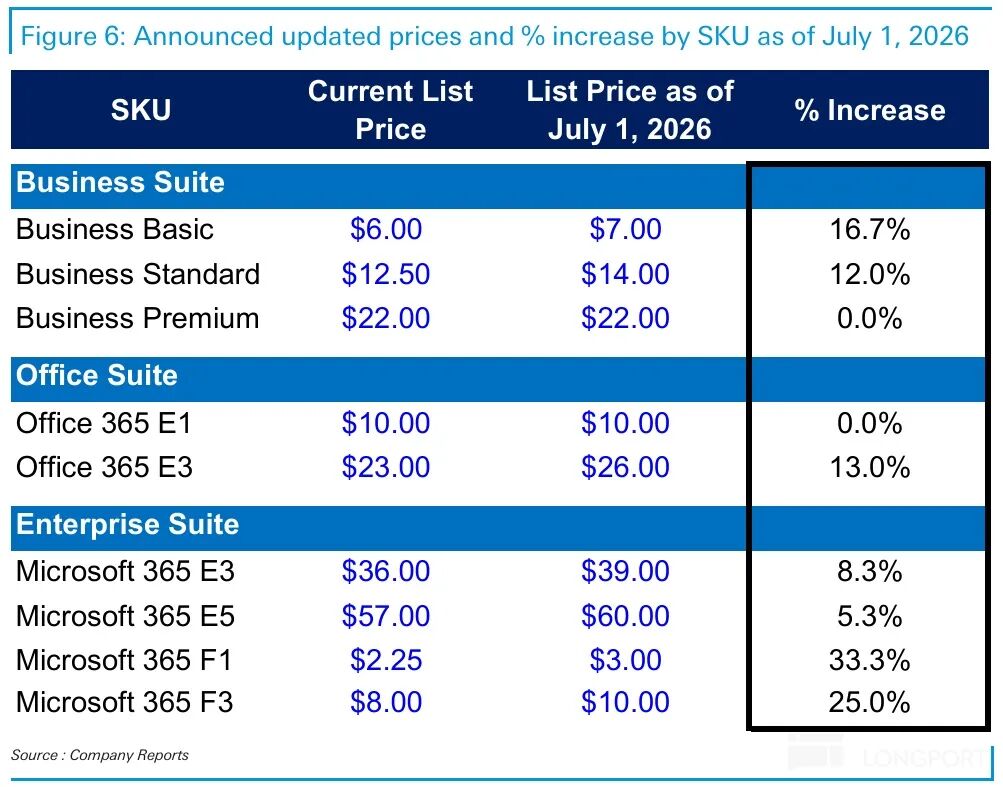
A more detailed value analysis has been published in the Longbridge App's 「 dynamic - depth 」 (Dynamic-In-Depth) section under an article with the same title.
Below is a detailed earnings review:
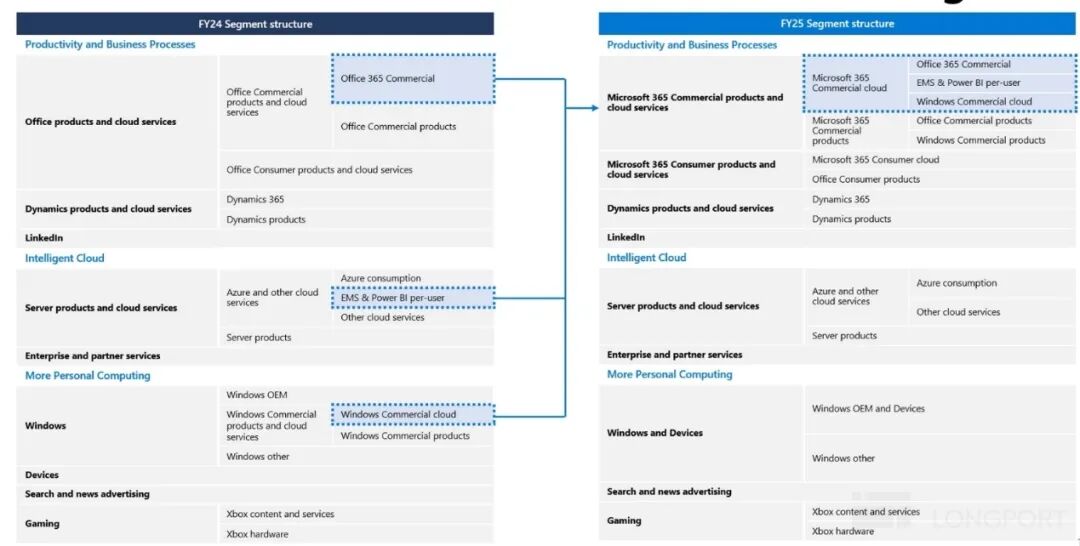
I. Overview of Changes in Earnings Disclosure Metrics
Starting in FY25, Microsoft made significant adjustments to its earnings disclosure structure. The overall approach was to consolidate various enterprise-oriented 365 services, including Commercial Office 365, Windows 365, and Security 365, into the Productivity & Processes (PBP) segment from their original segments. For specific adjustments and Dolphin Research's insights, please refer to our Q1FY25 review. The following is a brief summary:
II. Segment Performance: All Slightly Better Than Expected but Lacking Highlights
1.1 Azure growth stabilizes but still underperforms: The core Azure business saw revenue grow 40% YoY this quarter, or 39% excluding foreign exchange impacts—a slight acceleration of 1 pct from the previous quarter, meeting market expectations. This marks a small improvement after Azure's prior growth slowdown. However, compared to AWS and GCP, which saw significant acceleration this quarter, Azure still underperformed.
Dolphin Research attributes this primarily to the further decoupling of Microsoft's cooperation with OpenAI and OAI shifting some compute orders to other CSPs.
Of course, the company's stated allocation of more compute to 1P proprietary businesses and internal R&D, resulting in insufficient capacity for external leasing, is also likely a factor. With OAI no longer bound to Microsoft and potentially becoming a direct competitor, Microsoft urgently needs to develop a "first-tier" proprietary LLM.
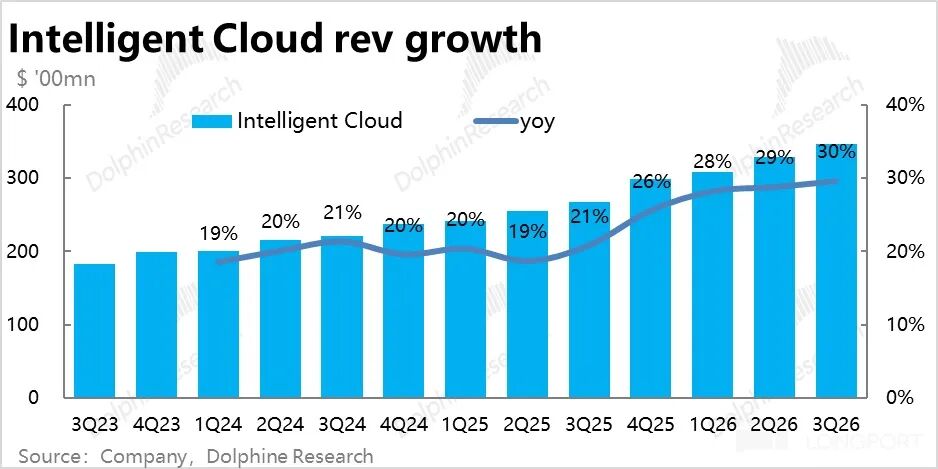
Meanwhile, the Intelligent Cloud segment's revenue grew about 30% YoY this quarter, also accelerating slightly by 1 pct sequentially—primarily driven by foreign exchange benefits.
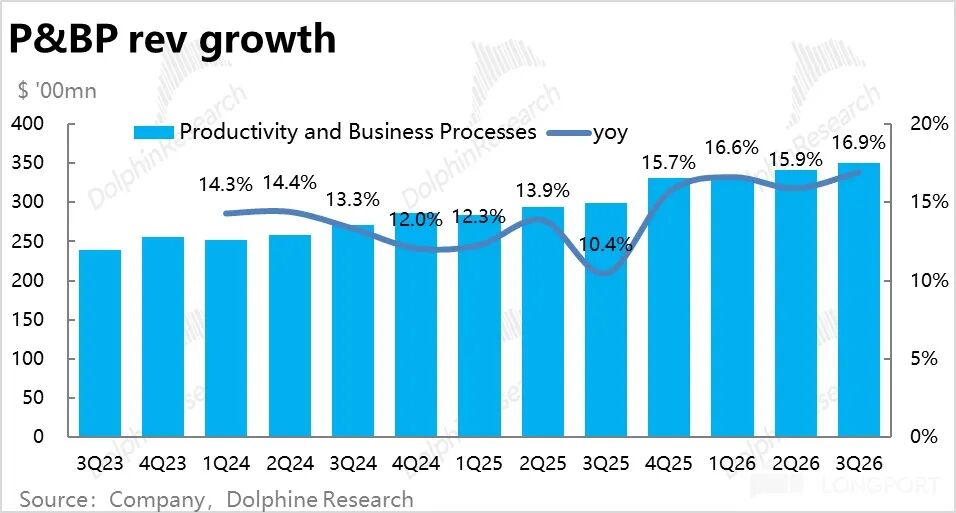
1.2 The growth of the Productivity segment has slowed down steadily and is still driven by price increases.
The revenue of the second most important Microsoft 365 Commercial Cloud increased by 19% this quarter, accelerating by 2 percentage points compared to the previous quarter. However, after excluding the positive impact of exchange rates, the actual quarter-on-quarter acceleration in revenue was only 1 percentage point.
Breaking down the driving factors of price and volume, the number of subscribed seats for commercial M365 increased by 6% year-on-year this quarter, consistent with the previous quarter. Therefore, the increase in growth rate this quarter is entirely driven by the rise in the average price per customer, which increased by 12% year-on-year. This is likely due to product structure upgrades (such as from E3 to E5) or the impact of additional subscriptions (such as Copilot).
However, overall, since the revenue growth of Office 365 has not fundamentally accelerated, it can be inferred that value-added services such as Copilot have not been widely adopted.
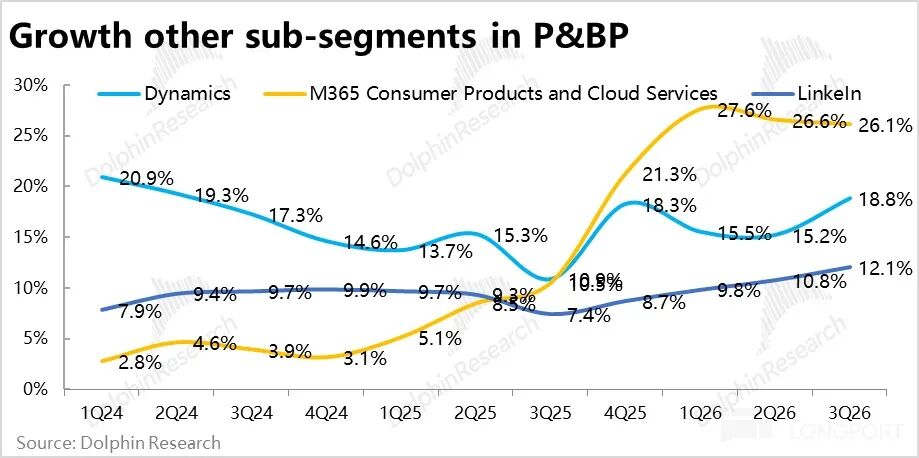
Among other businesses in the Productivity segment, Dynamics 365 experienced a growth rate of 22%, showing a significant acceleration from the previous quarter. However, this was mainly due to favorable exchange rates, as the growth rate remained at 17% on a constant currency basis, unchanged from the previous quarter. LinkedIn continued to experience sluggish growth, with a 9% increase on a constant currency basis this quarter, slowing down by another 1 percentage point from the previous quarter.
The revenue of the consumer M365 business maintained a growth rate of approximately 26% this quarter due to previous price increases. The number of users increased by 7% year-on-year, an improvement of 1 percentage point from the previous quarter. However, it is worth noting that this price increase began in the fourth quarter of the previous fiscal year, so the favorable cycle of the price increase will end by the next quarter (unless there are new price increases).
Overall, after excluding the positive impact of exchange rates, the growth of various businesses in the Productivity Process segment remained generally stable or slightly decelerated. Therefore, the overall growth rate of the Productivity segment, after excluding the impact of exchange rates, was 13%, slightly slowing down by 1 percentage point from the previous quarter.
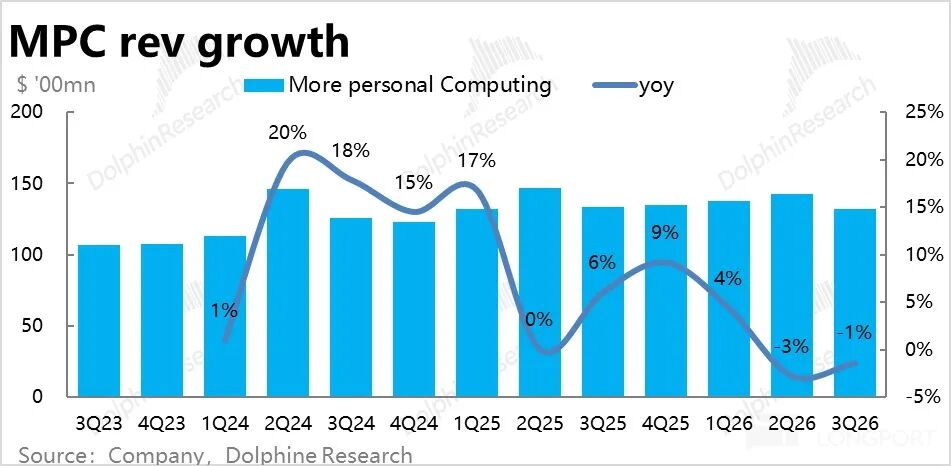
1.3 Personal Business: Overall Poor Performance, but Not as Bad as Guidance Suggested
The growth of the personal segment remained sluggish this quarter, but it performed significantly better than the overly conservative guidance provided earlier. Actual revenue declined by -1% year-on-year, compared to the market expectation of -5%.
Specifically: 1) The businesses that performed better than expected were mainly Windows systems and hardware. Compared to the overly conservative guidance of -10%, actual revenue only declined by 2.5%, which is generally consistent with market research data.
2) The growth rate of advertising revenue, after excluding media buying, was 12%, or 9% after excluding the impact of exchange rates, remaining unchanged from the previous quarter. However, advertising revenue still grew by more than 20% year-on-year within the year.
3) In the gaming segment, sales of Xbox consoles and other hardware performed poorly, with revenue declining by 33% year-on-year, while gaming content also decreased by 5%, showing similarly poor performance.

IV. Lost OpenAI as a Major Customer? New Order Amount Declines Year-on-Year
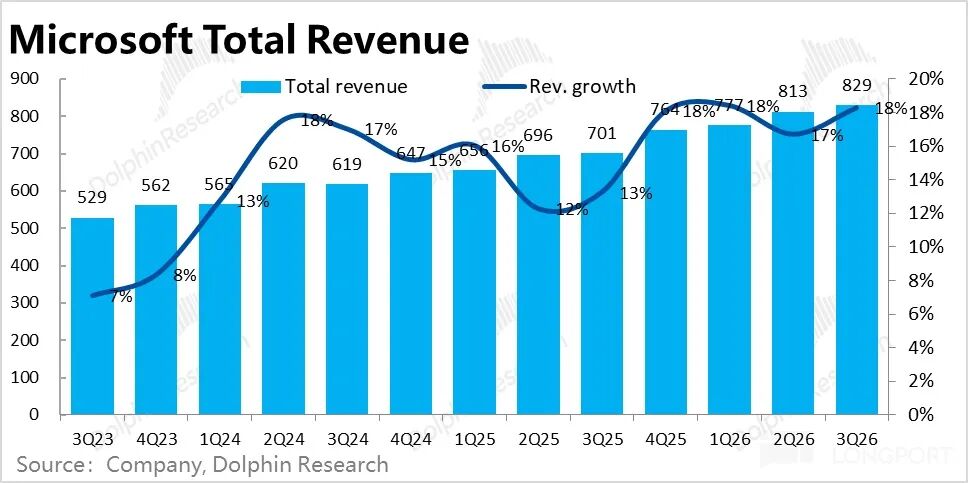
Summarizing the performance of each segment above, Microsoft's total revenue for the quarter was $82.9 billion, up 18% year-on-year, slightly higher than the sell-side consensus expectation of 16.3%. However, after excluding the positive impact of exchange rates, the actual revenue growth rate was 15%, basically consistent with the previous quarter. Overall, there were no significant bright spots in growth across all segments this quarter.
In contrast, there were interesting changes in leading indicators this quarter. First, the amount of newly signed enterprise contracts declined by 4% year-on-year this quarter, a sharp contrast to the 230% year-on-year surge in the previous quarter. The fundamental reason is that after Microsoft and OAI renegotiated their cooperation agreement, OAI no longer provided Microsoft with large-scale new orders. According to disclosures, excluding the impact of OAI orders, the amount of new orders increased by approximately 7% year-on-year this quarter.
Similarly, the company disclosed that the remaining balance of enterprise contracts to be fulfilled (RPO) this quarter was $627 billion, an increase of only $2 billion from the previous quarter. According to the company, if OAI's orders are excluded, RPO increased by 29% year-on-year, compared to a 99% increase when OAI's orders are included.
From these two indicators, it is evident that after 'losing' OAI as a major customer, there has been a significant impact on Microsoft's ability to secure new orders. We believe this is also one of the main reasons for the slightly sluggish growth of Azure in recent quarters.
V. Capex Investment Slows Down, Corresponding to Azure's Growth Pace
Microsoft's actual Capex (including leasing) expenditure this quarter was $31.9 billion, no longer increasing and instead decreasing by more than $5 billion from the previous quarter, also lower than the market expectation of $35 billion. We believe that the decline in Capex expenditure this quarter reflects the further downgrade of the cooperation relationship with OAI and the expectation of a reduction in the scale of orders that can be obtained from OAI in the future.
In terms of structure, equipment with short lifespans, such as GPUs/CPUs, accounts for two-thirds of the expenditure. Overall, the reduction in Capex expenditure generally corresponds to the recent changes in Azure's growth rate. Therefore, as the company expects Azure's growth to accelerate in the second half of calendar year 2026, it guides that Capex will increase to $40 billion next quarter, with an even higher guidance of $190 billion for Capex expenditure in calendar year 2026.
VI. Gross Margin Pressure Becomes More Pronounced, Expenses Still Trying to Offset
Compared to the relatively lackluster revenue performance, Microsoft's profit performance this quarter was slightly better, but still not particularly outstanding. 1) The overall operating profit for the quarter was $39.4 billion, up 20% year-on-year, significantly higher than revenue growth, indicating that profit margins are still rising. However, after excluding the positive impact of exchange rates, the actual operating profit growth rate was 16%, only slightly outpacing the 15% revenue growth rate on a constant currency basis, meaning that profit margins were essentially flat year-on-year.
2) From a segment perspective, the operating profit margin of the Intelligent Cloud segment, which is the most closely watched and bears the brunt of Capex and depreciation, was 39.7%, down 1.8 percentage points year-on-year, a significant expansion from the 0.3 percentage point decline in the previous quarter. This shows that the pressure on the cloud segment's profit margins from Capex investment is becoming more pronounced.
In contrast, the operating profit margins of the Productivity Process and Personal Computing segments both saw slight improvements this quarter after excluding the positive impact of exchange rates.
3) From a cost and expense perspective, the overall gross margin this quarter was 67.6%, down 1.1 percentage points year-on-year, with the decline also expanding from the previous quarter (0.7 percentage points). This is entirely due to the drag of the decline in the gross margin of the Intelligent Cloud segment (down a full 5 percentage points year-on-year), while the gross margins of the other two segments remained flat or slightly improved.
2) In the context of the gradually expanding decline in gross margin, the company still mainly relied on cost control to offset the pressure on profit margins this quarter. The total increase in operating expenses was only 9.4% year-on-year (8% after excluding the impact of exchange rates). On the one hand, this is still significantly lower than revenue growth, causing the expense ratio to decrease by approximately 1.7 percentage points year-on-year. However, in terms of the quarter-on-quarter trend, the expense growth rate this quarter accelerated significantly from the 5% in the previous quarter, mainly due to increases in marketing and administrative expenses. This is also partly due to the exceptionally low base in the previous year.
- END -
// Reprint Authorization
This article is an original work by Dolphin Research. Reproduction requires authorization.
// Disclaimer and General Disclosure
This report is for general comprehensive data purposes only, intended for general reading and data reference by users of Dolphin Research and its affiliated institutions. It does not take into account the specific investment objectives, investment product preferences, risk tolerance, financial status, or special needs of any individual receiving this report. Investors must consult with independent professional advisors before making investment decisions based on this report. Any person making investment decisions using or referring to the content or information in this report does so at their own risk. Dolphin Research shall not be liable for any direct or indirect responsibilities or losses that may arise from the use of the data in this report. The information and data in this report are based on publicly available sources and are for reference purposes only. Dolphin Research strives to ensure but does not guarantee the reliability, accuracy, and completeness of the information and data.
The information or opinions mentioned in this report shall not, under any jurisdiction, be construed as or deemed to be an offer to sell securities or an invitation to buy or sell securities, nor shall they constitute recommendations, inquiries, or endorsements of relevant securities or related financial instruments. The information, tools, and materials in this report are not intended for or intended to be distributed to jurisdictions where the distribution, publication, provision, or use of such information, tools, and materials contradicts applicable laws or regulations, or to citizens or residents of jurisdictions where Dolphin Research and/or its subsidiaries or affiliated companies are required to comply with any registration or licensing requirements in such jurisdictions.
This report only reflects the personal views, insights, and analytical methods of the relevant creators and does not represent the stance of Dolphin Research and/or its affiliated institutions.
This report is produced by Dolphin Research, and the copyright is solely owned by Dolphin Research. No institution or individual may, without the prior written consent of Dolphin Research, (i) make, copy, reproduce, duplicate, forward, or distribute in any form any copies or reproductions, and/or (ii) directly or indirectly redistribute or transfer to other unauthorized persons. Dolphin Research reserves all relevant rights.
-
![]()
AI Giants Start Borrowing to Fuel Computing Power Race
-
ByteDance Initiates Largest B2B Structural Adjustment, This Time It's Truly Different
-
![]()
Let's Talk About Kingsoft Office's Mid-Year Outlook and the True Strength of Its AI-Powered Office Solutions
-
Despite 150 Million Users, Struggles Persist: AIShige Faces Tough Competition from Seedance and Kling in AI Video Monetization
-
![]()
Ensuring Safe Gear Shifting in the Automotive Industry: Transitioning from 'Product Oversight' to 'Full-Chain Governance'
-
![]()
Net Profit Soars to $133.7 Billion! Azure Revenue Tops $100 Billion, with AI Fueling Microsoft's Growth
-
![]()
Before 6G Hits the Market, the U.S. Forges a 'Rules Alliance': What Challenges Await Chinese IoT Enterprises?
-
![]()
Intelligent Driving's 'Little Blue Light' Faces Ban: Night Glare and Cut-in Risks Prompt Official Action