Apple: How Long Can the Tech Giant Sustain Its Pricing Power Amid Rising Costs?
 07/31 2026
 363
363
Apple Inc. (AAPL.O) released its Q3 FY2026 earnings report (as of June 2026) after the U.S. market closed on the morning of July 31, 2026 (Beijing Time). Key highlights include:
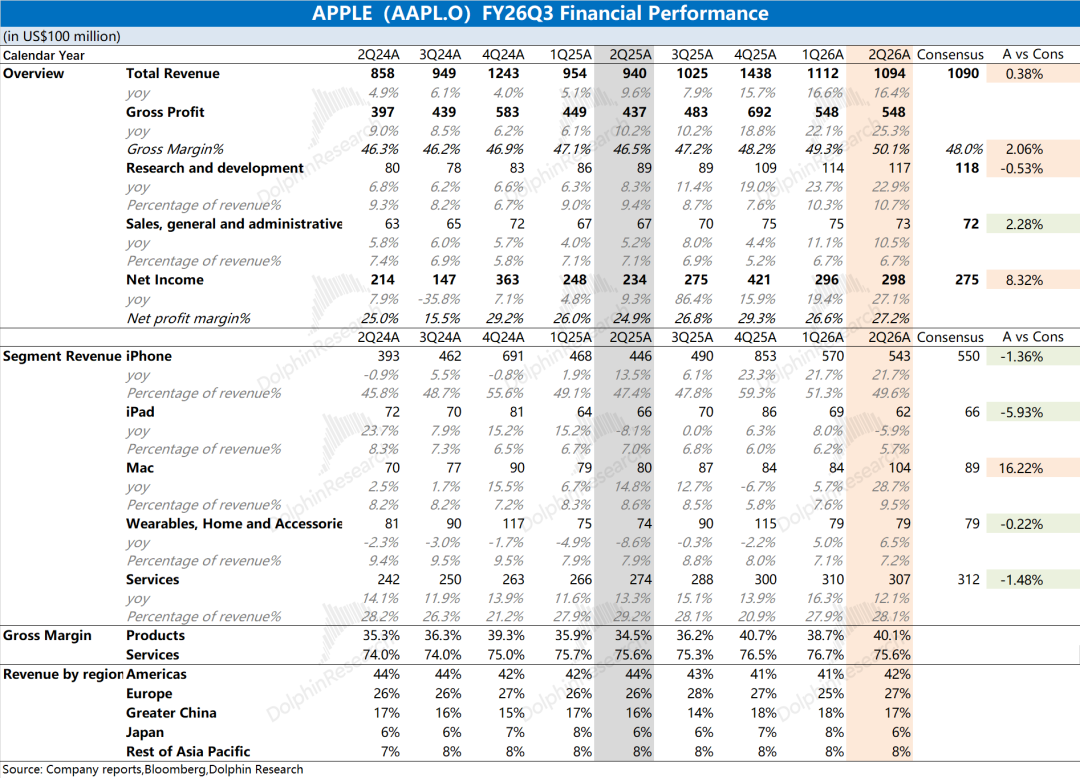
1. Overall Performance: Apple achieved $109.4 billion in revenue this quarter, up 16% YoY, aligning with market expectations ($109 billion). The growth was primarily driven by iPhone, Mac, and software services.
Apple's gross margin stood at 50.1%, up 3.6 percentage points YoY. Excluding a roughly 2% tax refund impact, the quarterly gross margin was close to market expectations (48%). Software services maintained a 75.6% gross margin, while hardware gross margin was 40.1%. After adjusting for a 2.5% tax refund impact, the actual gross margin declined by about 1 percentage point QoQ, mainly due to rising storage costs.
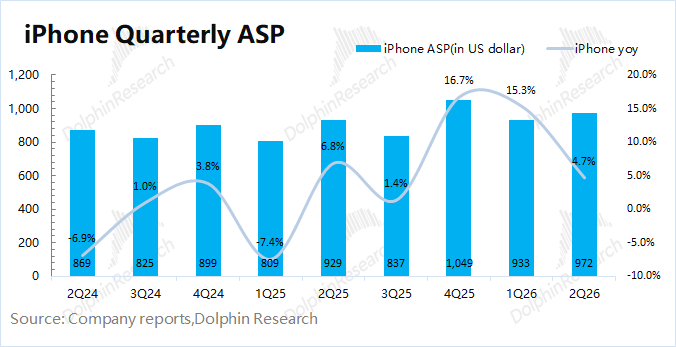
2. iPhone: iPhone revenue reached $54.3 billion, up 22% YoY, slightly below market expectations ($55 billion). The growth was fueled by strong global demand for the iPhone17 series. Dolphin Research estimates iPhone shipments grew 16% YoY, with the average selling price (ASP) rising 5%.
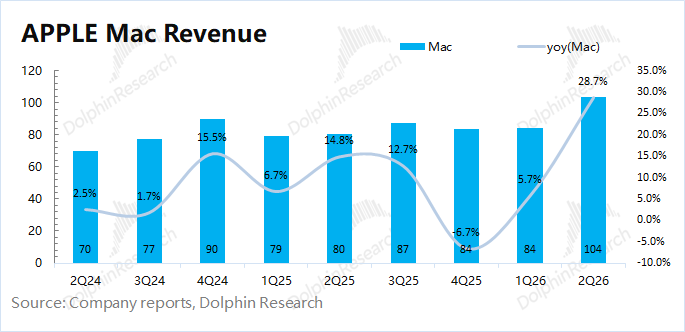
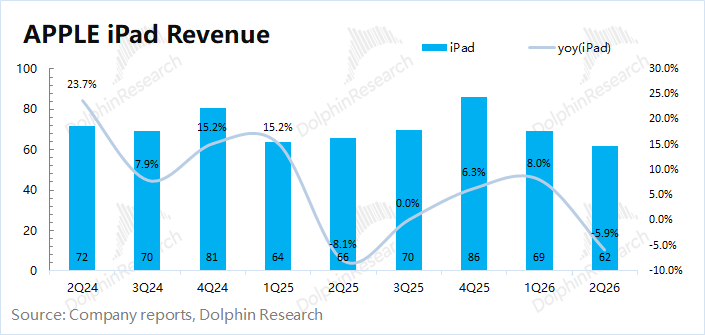
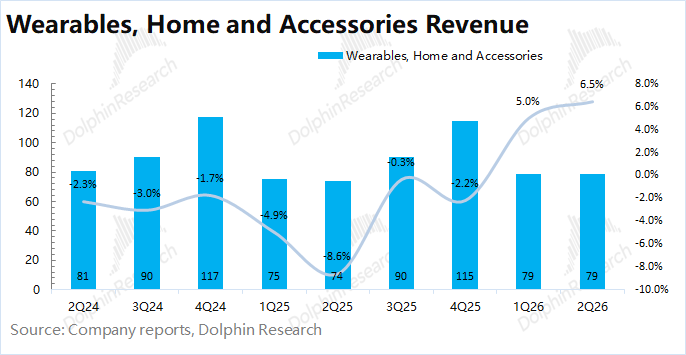
3. Other Hardware: Mac revenue surged 29% YoY, driven by the MacBook Pro and MacBook Neo. iPad revenue declined 6%, while wearables and other hardware maintained single-digit growth.
4. Software Services: Revenue from software services hit $30.7 billion, up 12% YoY but falling short of market expectations ($31.2 billion). With a 75.6% gross margin, software services contributed 28% of total revenue but generated 42% of gross profit.
5. Regional Revenue: The Americas remained Apple's largest market, accounting for over 40% of revenue, with 11% YoY growth. Greater China and Europe both achieved over 20% growth, with iPhone shipments in mainland China surging 24% YoY (IDC data).
Dolphin Research's Overall View: AI as a Safe Haven, but Growth Slows
Amid high market expectations, Apple's Q3 performance appeared "underwhelming." Revenue growth largely met expectations, while gross margins benefited from a 2% tax refund. Adjusting for this, margins hovered around 48%, in line with forecasts.
① Double-Digit Revenue Growth: Driven by the iPhone17 series. iPhone revenue surged 22% YoY, with double-digit sales growth in China and other overseas markets. Despite rising storage costs—forcing competitors to raise prices—Apple maintained iPhone17 pricing, gaining consumer favor.
② Gross Margin Expansion: Hardware gross margin reached 40.1%, including a 2.5% tax refund impact. Excluding this, hardware margins stood at ~37.6%, down 1.2 percentage points QoQ due to soaring storage costs.
Apple's focus on premium markets mitigated the impact of storage cost hikes compared to rivals, allowing better cost absorption.
Beyond Q3 data, management provided Q4 guidance: Revenue is expected to grow 9-11% YoY ($111.7-113.8 billion), with iPhone revenue up ~15%. Gross margins are projected at 47-48%, implying a 1-1.5 percentage point decline in hardware margins (due to storage costs).
With software growth stabilizing, other hardware revenue (excluding iPhone) is estimated at $23.1-25.2 billion, potentially declining YoY (vs. $24.7 billion last year). Price hikes for Mac and iPad announced in late June suggest demand was front-loaded.
Beyond Apple's earnings, markets are focused on:
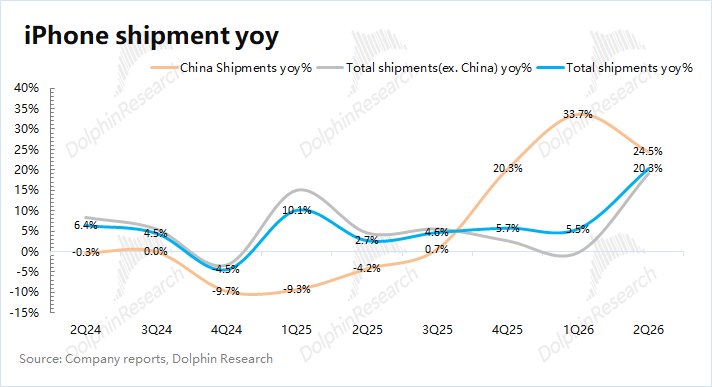
a) Strong Growth in China: Q3 performance rebounded due to surging iPhone sales in China. iPhone shipments in China rose 24% YoY, with 19% growth in other markets.
b) Resilience Amid Storage Cost Pressures: Despite rising storage costs, Apple maintained an overall gross margin of 48%, with hardware margins at 37.5% (excluding tax refunds).
This stems from Apple's supply chain prowess: ① Long-term memory procurement agreements to lock in costs; ② Cost reductions via in-house chip design; ③ Product mix optimization or selective price hikes.
c) AI Strategy: On July 15, 2026, China's Cyberspace Administration approved "Apple Intelligence" for on-device generative AI services.
Overseas, Apple integrates ChatGPT as an optional third-party model in its Apple Intelligence ecosystem. As this approach isn't feasible in China, Apple partnered with Alibaba. AI features could bolster Apple's competitiveness in China, driving upgrades and consumer spending.
Amid the recent AI correction, Apple emerged as a "safe haven" for two reasons: ① Limited capital expenditures (~$2-3 billion per quarter) while retaining control over core hardware; ② Solid earnings performance, with the iPhone17 defying industry headwinds.
Like Microsoft—which avoided raising capex and was rewarded by the market—Apple has maintained annual capex below $11 billion despite earning over $100 billion yearly. Amid concerns over AI capex sustainability, Apple's conservative approach attracted capital inflows.
Apple exhibits a clear "see-saw effect" against other "Mag 7" tech giants. On one hand, on-device AI demands more storage and computing power, but AI-driven component price hikes delay upgrades. On the other, Apple's modest capex contrasts sharply with rivals' aggressive spending.
Despite high market expectations, Apple's earnings were "underwhelming," with Q4 growth expected to slow. Its valuation, especially amid decelerating growth, appears "stretched."
Capital shifts from AI to Apple for "certainty," but management's growth slowdown warning could shake confidence. For Apple, the iPhone17 cycle succeeded, but future focus shifts to iPhone18 and AI performance. Only accelerated growth via AI can justify a breakout.
Detailed Analysis Follows
I. iPhone17-Driven Growth Acceleration
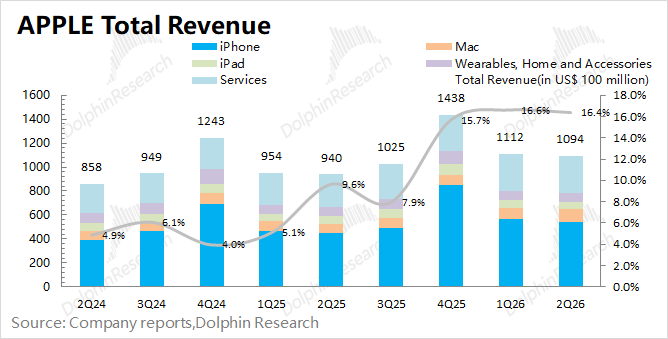
1.1 Revenue: In Q3 FY2026 (2Q26), Apple reported $109.4 billion in revenue, up 16% YoY, meeting market expectations ($109 billion). Growth was driven by iPhone and Mac.
Breakdown by Hardware and Software:
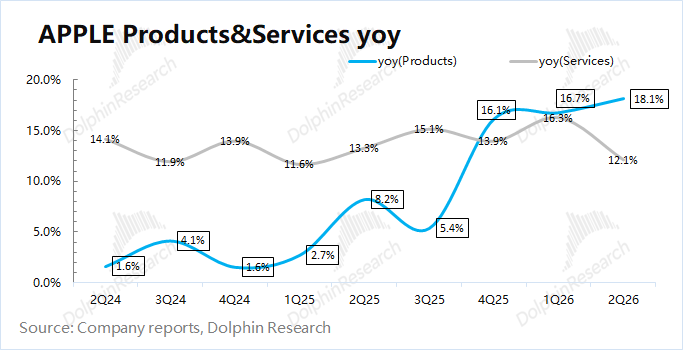
① Hardware revenue grew 18% YoY, led by iPhone and Mac. The iPhone17 series drove three consecutive quarters of >20% iPhone revenue growth.
② Software revenue rose 12% YoY, maintaining double-digit growth. Future AI applications could further accelerate growth.
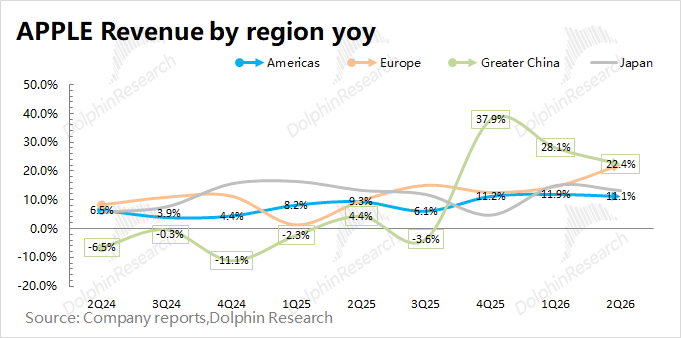
Regional Performance: All regions saw YoY growth. The Americas, Europe, and Greater China remained Apple's top revenue sources. The Americas accounted for >40% of revenue (+11% YoY), while Europe grew 22%.
Greater China maintained 22% YoY growth for the third straight quarter. Amid competitor price hikes, Apple held prices steady, boosting sales. iPhone shipments in mainland China surged 24% YoY.
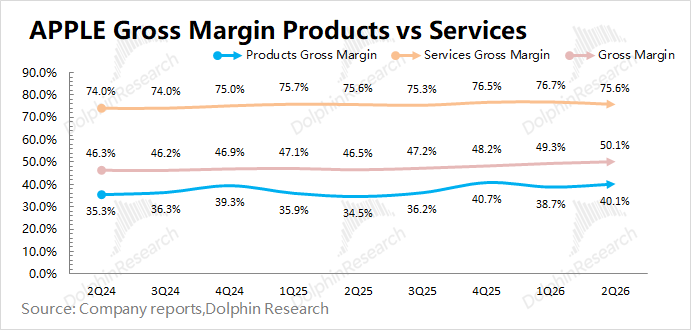
1.2 Gross Margin: Q3 FY2026 gross margin was 50.1%, up 3.6 percentage points YoY. Excluding a ~2% tax refund impact, margins aligned with market expectations (48%). The QoQ decline stemmed from rising storage costs.
Breakdown by Segment: Software margins held at 75.6%, while hardware margins were 40.1% (or ~37.6% excluding tax refunds), down ~1 percentage point QoQ due to storage costs.
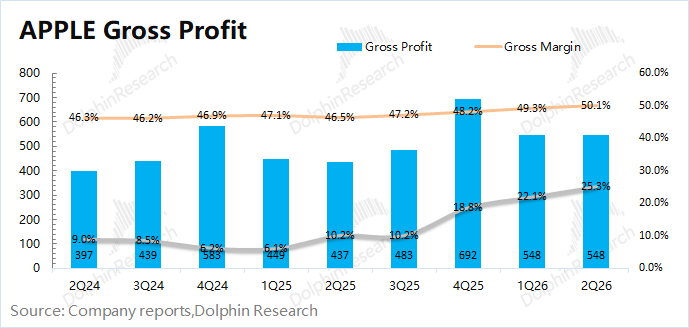
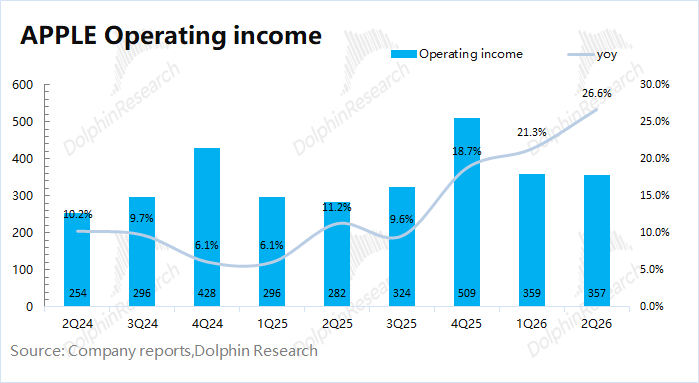
1.3 Operating Profit: Q3 FY2026 operating profit reached $35.7 billion, up 27% YoY, driven by revenue and margin growth.
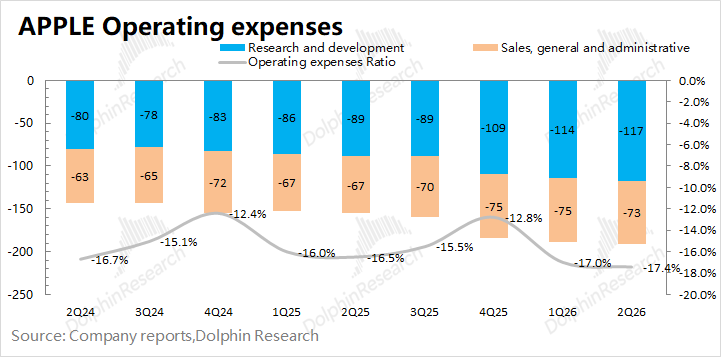
Operating expenses accounted for 17.4% of revenue (+0.9 percentage points YoY), reflecting higher R&D investment (+23% YoY).
Capital expenditures totaled just $2.46 billion, far below rivals' multi-billion-dollar quarterly AI investments. Apple's restraint attracted market capital, boosting its stock.
II. iPhone: Volume Growth Without Price Hikes
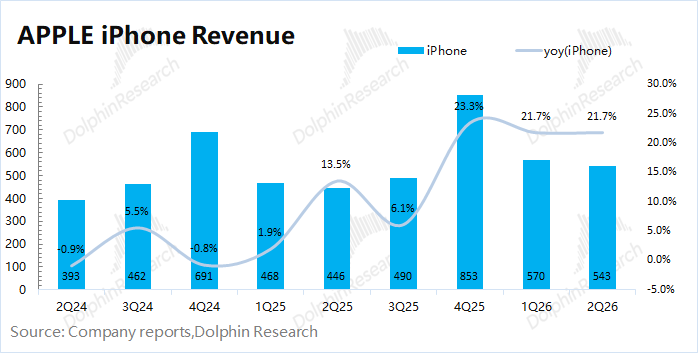
iPhone revenue hit $54.3 billion in Q3 FY2026 (+22% YoY), slightly below expectations ($55 billion). Growth was fueled by global iPhone17 demand.
Volume and Pricing Analysis:
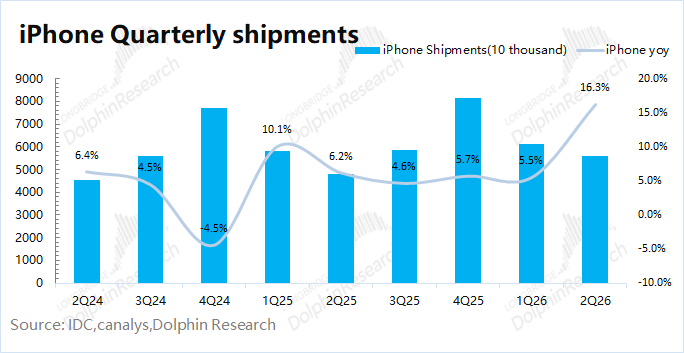
1) Shipments: Global smartphone shipments fell 6% YoY in Q2 2026 (IDC). Apple's shipments rose 16% YoY, outperforming the market.
While Android vendors raised prices, Apple held iPhone pricing steady, winning consumers. In China, iPhone sales surged 24% YoY (vs. a 4% market decline), making it the best-performing brand.
2) Average selling price of iPhones: Based on iPhone business revenue and shipment volume, the average selling price of iPhones this quarter was approximately $972, representing a year-on-year increase of 5%.
III. Other hardware besides iPhones: Mac is the only one that exceeded expectations
3.1 Mac Business
In the third quarter of FY2026 (i.e., 2Q26), Mac business revenue reached $10.4 billion, up 29% year-on-year, significantly outperforming market expectations ($8.9 billion). The growth was primarily driven by the MacBook Pro and the new MacBook Neo.
The MacBook Neo has gained popularity worldwide due to its differentiated design and cost-effectiveness, and the company is still striving to meet demand. The MacBook Air equipped with the M5 is the best-selling notebook globally. The MacBook Pro with M5 Pro and M5 Max is the top choice for professional users handling AI development and creative workflows.
The Mac stands out in high-throughput, edge inference, and various AI workloads, positioning itself as an "AI computing platform": Customers use Mac Mini as an agentic AI platform, while Mac Studio clusters are deployed locally to run cutting-edge models.
According to IDC's report, global PC market shipments remained flat year-on-year this quarter, while Apple's PC shipments increased by 8% year-on-year, outperforming the overall market. Combining company and industry data, Dolphin Research estimates that the average selling price of Macs this quarter was $1,545, up 19% year-on-year.
3.2 iPad Business
In the third quarter of FY2026 (i.e., 2Q26), iPad business revenue was $6.2 billion, down 6% year-on-year, falling short of market consensus expectations ($6.6 billion) due to the high base effect from the launch of the A16-equipped iPad in the same period last year.
3.3 Wearables and Other Hardware
In the third quarter of FY2026 (i.e., 2Q26), revenue from wearables and other hardware businesses was $7.9 billion, up 6.5% year-on-year, in line with market expectations ($7.9 billion). The growth was driven by the wearables and accessories businesses.
IV. Software Services: Maintaining Double-Digit Growth, Anticipating Apple AI
In the third quarter of FY2026 (i.e., 2Q26), software services revenue reached $30.7 billion, up 12% year-on-year, falling short of market consensus expectations ($31.2 billion). The gross profit margin for software services remained at 75.6% this quarter, with the software business contributing 28% of the company's revenue and generating 42% of its gross profit.
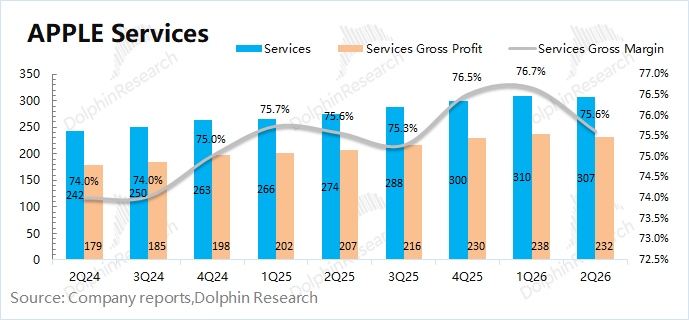
Specifically, advertising, the App Store, AppleCare, music, and video segments all set new records for the same period, while cloud and payment services also set new records. The company's number of paid subscriptions has surpassed 1.5 billion, with over 2.5 billion active devices installed, laying the foundation for sustained growth in its services business.
Apple believes that AI is not a standalone feature but rather a capability based on chip and edge AI processing, emphasizing privacy first. Given the company's current R&D growth rate, which is significantly faster than its overall growth rate, AI investment represents an additional incremental part.
The company's core philosophy is "privacy + AI based on personal context." The latest models will partially run on the edge side and partially operate on the server side in private clouds.
Apple's recent collaboration with Alibaba in AI is also expected to accelerate the rollout of Apple Intelligence across the market. Through AI empowerment, the company aims to drive growth in service revenue while also promoting demand growth at the hardware end, which is a key focus for accelerating future growth.
- END -
// Reprint Authorization
This article is an original work by Dolphin Research. Reprinting is prohibited without authorization.
// Disclaimer and General Disclosure
This report is for general comprehensive data purposes only, intended for general reading and data reference by users of Dolphin Research and its affiliated institutions. It does not take into account the specific investment objectives, investment product preferences, risk tolerance, financial situation, or special needs of any person receiving this report. Investors must consult with independent professional advisors before making investment decisions based on this report. Any person making investment decisions using or referring to the content or information mentioned in this report assumes all risks. Dolphin Research shall not be liable for any direct or indirect responsibilities or losses that may arise from the use of the data contained in this report. The information and data in this report are based on publicly available sources and are for reference purposes only. Dolphin Research strives to ensure but does not guarantee the reliability, accuracy, and completeness of the relevant information and data.
The information or opinions mentioned in this report shall not, under any jurisdiction, be regarded or construed as an offer to sell securities or an invitation to buy or sell securities, nor shall they constitute advice, inquiries, or recommendations regarding relevant securities or related financial instruments. The information, tools, and data contained in this report are not intended for or to be distributed to citizens or residents of jurisdictions where the distribution, publication, provision, or use of such information, tools, and data contradicts applicable laws or regulations or would require Dolphin Research and/or its subsidiaries or affiliated companies to comply with any registration or licensing requirements in such jurisdictions.
This report only reflects the personal views, insights, and analytical methods of the relevant contributors and does not represent the stance of Dolphin Research and/or its affiliated institutions.
This report is produced by Dolphin Research, and the copyright is solely owned by Dolphin Research. Without the prior written consent of Dolphin Research, no institution or individual may (i) make, copy, reproduce, duplicate, forward, or create any form of copies or reproductions in any manner, and/or (ii) directly or indirectly redistribute or transfer them to other unauthorized persons. Dolphin Research reserves all relevant rights.
-
![]()
Apple: How Long Can the Tech Giant Sustain Its Pricing Power Amid Rising Costs?
-
![]()
Breaking News! Tesla Considers Divesting Its China Operations
-
![]()
Foreign Media Claims Tesla Considers Selling Chinese Business to Pave Way for Merger with SpaceX
-
![]()
Meta Made the Biggest Promise, Invested the Most Money, but Ended Up with Nothing
-
![]()
Lei Jun Disrupts the Market: Xiaomi Unveils N70/N90 Dual Models, Zeroing in on Two Leading Extended-Range Rivals
-
![]()
Sales Champion Leapmotor's Quest for Scale
-
![]()
SAIC-GM and SAIC Passenger Vehicles Announce Leadership Shifts on the Same Day: 'Technical Talents' Step Forward to Steer the Course
-
![]()
BMW's Turnaround Starts with the Easy Part