June Outlook for Traditional Fuel Vehicles: Will They Rebound? China Association of Automobile Manufacturers Reports Double-Digit Growth Across Multiple Indicators in H1 2025
 07/18 2025
 781
781
The China Association of Automobile Manufacturers (CAAM) unveiled its semi-annual automobile market data slightly ahead of schedule. On the morning of July 10, the CAAM officially released the market data for the first half of 2025, painting a picture of "all green lights": "In the first half of the year, the automobile market sustained its positive momentum, with multiple economic indicators achieving double-digit year-on-year growth."
For the second half of the year, the CAAM offered a cautious yet optimistic outlook: "The 'two new' policies will continue to be implemented in an orderly manner, but the preferential policy for exempting purchase tax on new energy vehicles will face a decline. Coupled with the ongoing enrichment of new product offerings by enterprises, this will help drive automobile consumption growth." Simultaneously, the CAAM noted the increasing uncertainty of the external environment, the suspension of vehicle replacement subsidies and other trade-in incentives in some regions, fierce industry competition, and persistent pressure on overall profitability. "It is imperative to stabilize policy expectations, regulate market competition, strengthen industry self-discipline, enhance policy guidance and supervision, and foster a healthy and smooth operation of the industry."
Uninterrupted Green Lights in H1
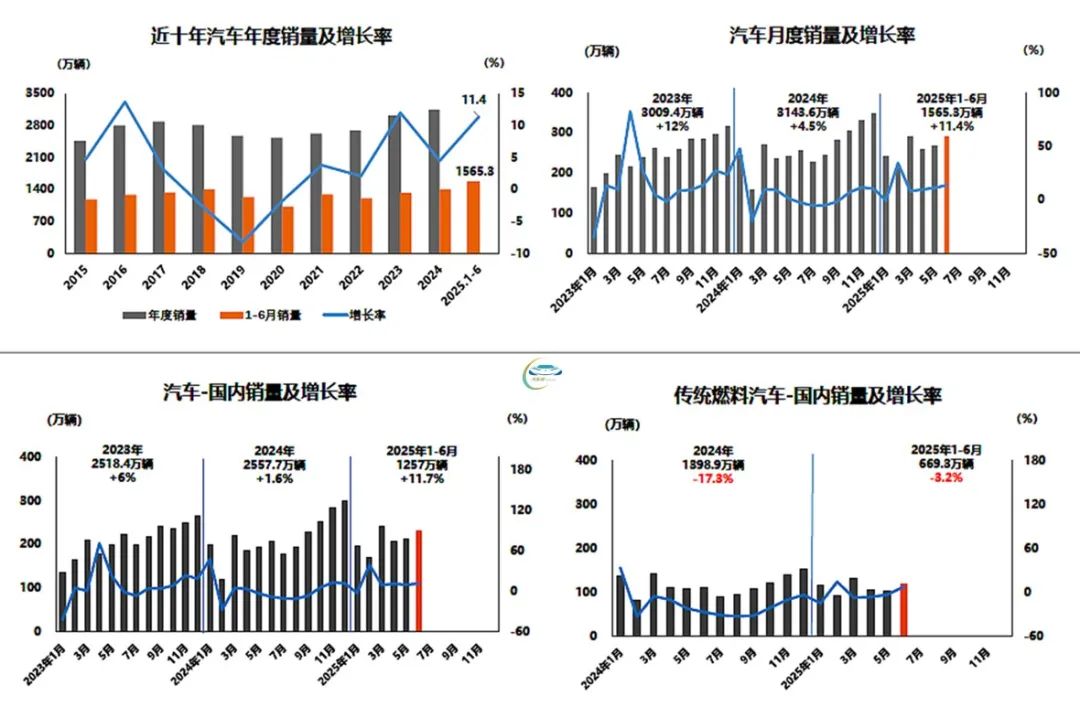
Since the beginning of 2025, the overall market trend has been one of uninterrupted growth. According to the CAAM, this is primarily due to the proactive macro policies implemented by the country, particularly the strong impetus provided by the "two new subsidies" for trade-ins and replacements of old vehicles. The data underscores this: From January to June 2025, automobile production and sales reached 15.621 million and 15.653 million vehicles, respectively, marking year-on-year increases of 12.5% and 11.4%. While the production growth rate narrowed by 0.2% compared to January-May, the sales growth rate expanded by 0.5%.
Focusing solely on June's market trend, it also recorded double-digit growth both month-on-month and year-on-year: In June, automobile production and sales stood at 2.794 million and 2.904 million vehicles, respectively, with month-on-month increases of 5.5% and 8.1%, and year-on-year increases of 11.4% and 13.8%. One notable data point: In June, domestic sales of traditional fuel vehicles hit 1.188 million units, up 14.2% month-on-month and 7.7% year-on-year. While a single month's sales do not definitively signal a "rebound" for traditional fuel vehicles, from a consumer perspective, the choice between traditional fuel and new energy vehicles remains a toss-up. Despite cumulative sales of traditional fuel vehicles from January to June amounting to 6.693 million units, a year-on-year decrease of 3.2%, their overall sales ratio still exceeds half.
Examining the two major segments of the automobile market, both passenger vehicles and commercial vehicles recorded cumulative year-on-year growth in the first half of 2025: From January to June, commercial vehicle production and sales totaled 2.099 million and 2.122 million units, respectively, with year-on-year increases of 4.7% and 2.6%. Compared to the cumulative sales of 2.068 million units in the first half of last year, sales increased by nearly 60,000 units.
Main Consumption Still Within the 100,000-200,000 Yuan Range
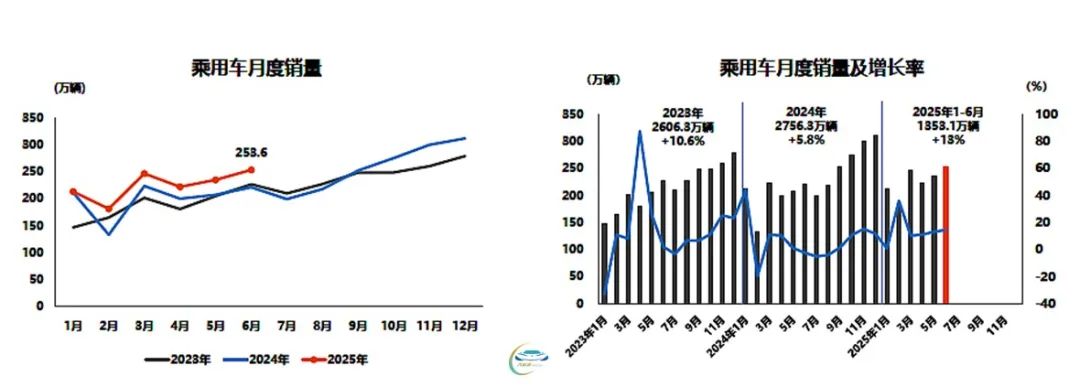
As one of the three growth poles, the passenger vehicle segment produced and sold 2.441 million and 2.536 million units, respectively, in June, marking month-on-month increases of 5.5% and 7.8%, and year-on-year increases of 12.1% and 14.5%. Cumulatively, passenger vehicle production and sales reached 13.522 million and 13.531 million units, respectively, in the first half of the year, with year-on-year increases of 13.8% and 13%. Both monthly and cumulative data demonstrated double-digit year-on-year growth.
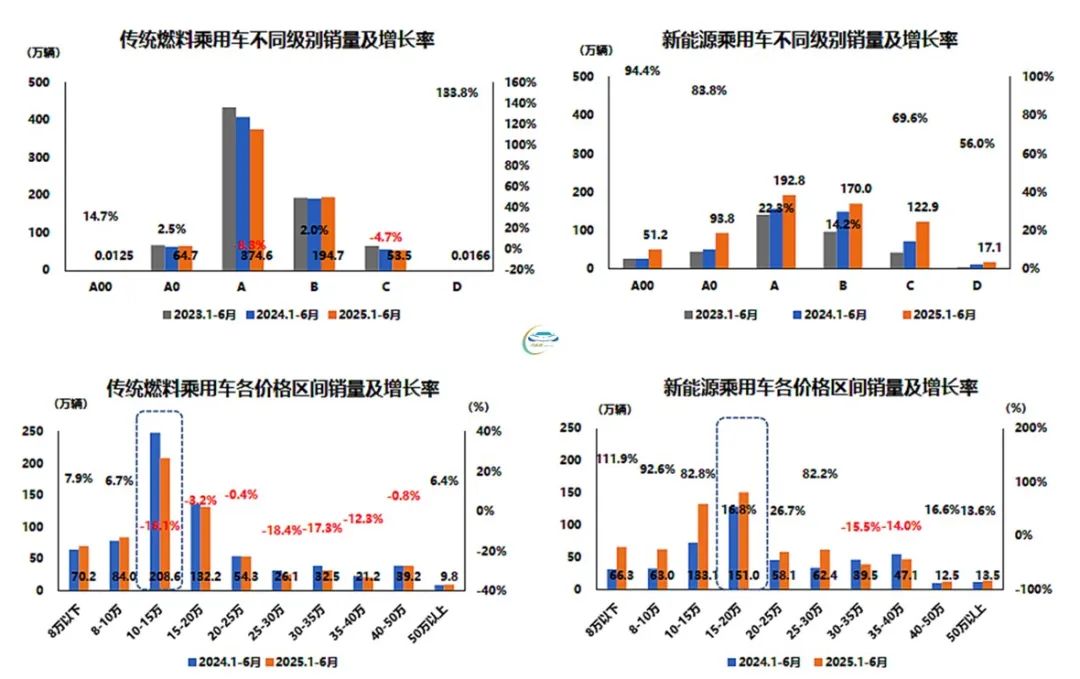
Within the passenger vehicle segment, the main consumption bracket remains within the 100,000-200,000 yuan price range. For traditional fuel vehicles and new energy passenger vehicles, the sales mainstays are models priced between 100,000-150,000 yuan and 150,000-200,000 yuan, respectively. Specifically, the cumulative sales of traditional fuel vehicles in the primary price range in the first half of the year reached 2.086 million units, a year-on-year decrease of 16.1%, while the cumulative sales of new energy passenger vehicles in the primary price range reached 1.51 million units, a year-on-year increase of 16.8% — a stark contrast akin to "swapping fields".
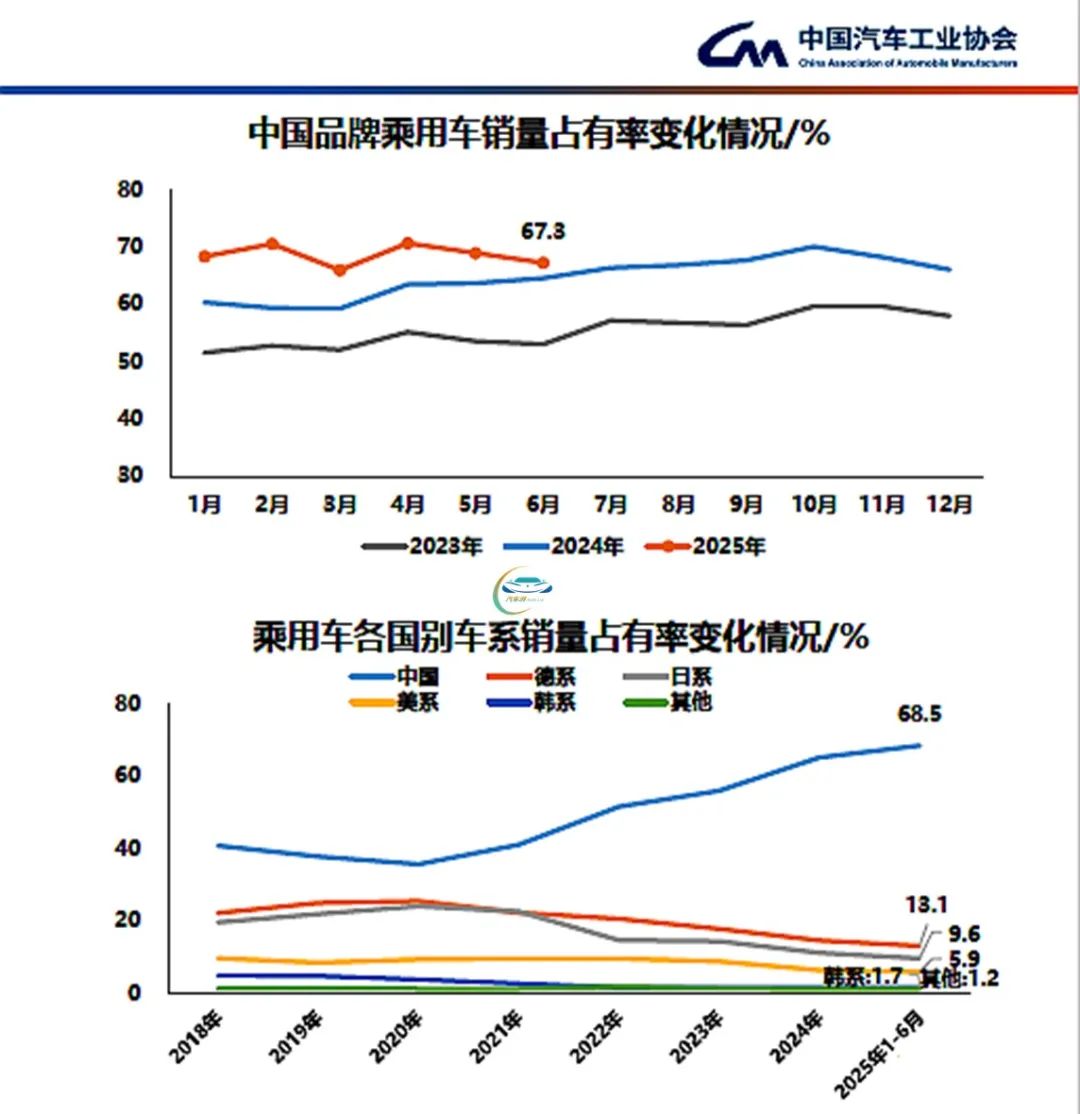
Prior to the release of the CAAM data, online articles had mentioned a significant increase in consumers' trust in domestic products. This phenomenon is particularly pronounced in the automobile market, with the market share of Chinese brand passenger vehicles remaining high: In June, sales of Chinese brand passenger vehicles totaled 1.707 million units, with a year-on-year increase of 19.3%. The sales share increased by 2.7 percentage points year-on-year to 67.3%. Cumulative sales from January to June reached 9.27 million units, with a year-on-year increase of 25%. The sales share rose by 6.6 percentage points from the same period last year, reaching 68.5%.
However, from the overall trend, the current market share of Chinese brand passenger vehicles has actually declined. Besides normal fluctuations, joint venture brands have significantly intensified their market offensive in the new energy vehicle sector, intensifying competition. The curves of different countries, including Germany, the United States, and Japan (each with a 0.1% increase in market share compared to the previous month), indicate a trend of halting the decline and rebounding.
Plug-in Hybrids Lag Behind Pure Electrics in Growth Rate
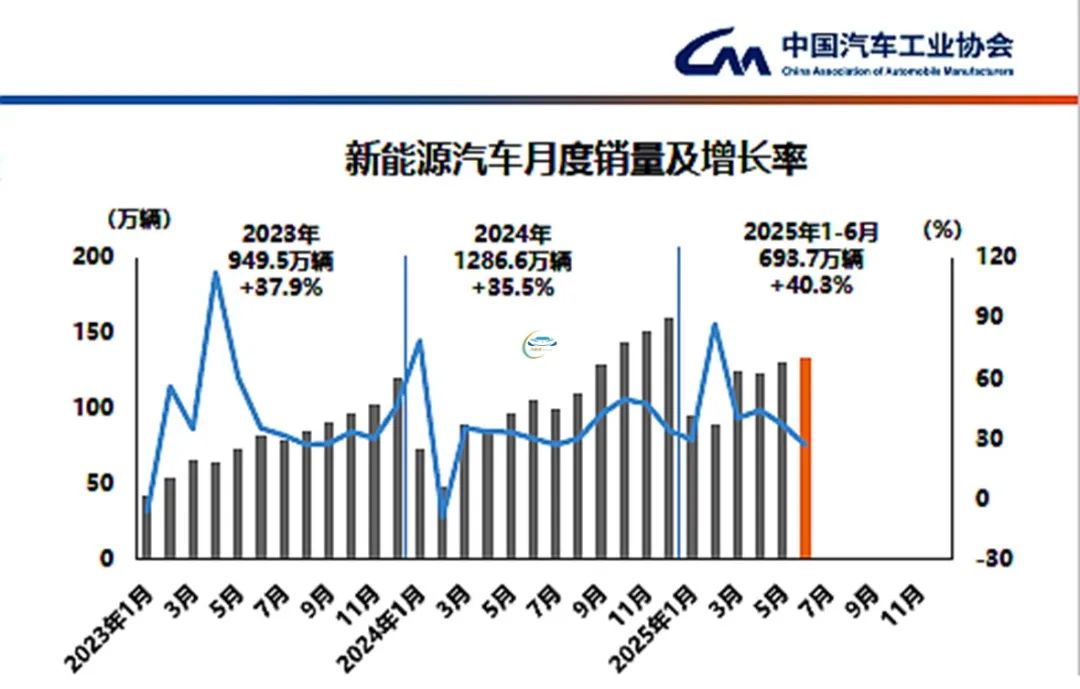
CAAM data reveals: In June, new energy vehicle production and sales reached 1.268 million and 1.329 million units, respectively, with year-on-year increases of 26.4% and 26.7%. New energy vehicle sales accounted for 45.8% of total new vehicle sales. Cumulatively, from January to June, new energy vehicle production and sales totaled 6.9638 million and 6.937 million units, respectively, with year-on-year increases of 41.4% and 40.3%. New energy vehicle sales accounted for 44.3% of total new vehicle sales.
In the core passenger vehicle market, domestic sales of new energy passenger vehicles in June accounted for 51.8% of total domestic passenger vehicle sales, and the sales share of new energy passenger vehicles from January to June reached 50.4% — both exceeding half.
Examining market segments, among the three major types of new energy vehicles, pure electric vehicles remain the mainstay. In June, 859,000 pure electric vehicles were sold, with a year-on-year increase of 40.4%. Cumulative sales reached 4.415 million units, with a year-on-year increase of 46.2%. Sales of plug-in hybrid vehicles totaled 470,000 units in June, with a year-on-year increase of 7.8%. Cumulative sales reached 2.521 million units, with a year-on-year increase of 31.1%. Of course, fuel cell vehicles are not the mainstream and will not be elaborated further.
Worth mentioning is the sales of new energy commercial vehicles: In June, domestic sales of new energy commercial vehicles reached 70,000 units, with a month-on-month increase of 8.2% and a year-on-year increase of 58.6%. From January to June, domestic sales of new energy commercial vehicles totaled 354,000 units, with a year-on-year increase of 55.9%, both increases exceeding half.
While the growth rate of new energy commercial vehicles is encouraging, it pales in comparison to the export data of new energy vehicles: In June, 197,000 new energy passenger vehicles were exported, with a month-on-month decrease of 3.8% and a year-on-year increase of 1.4 times. Exports of new energy commercial vehicles reached 8,000 units, with a month-on-month increase of 2.9% and a year-on-year increase of 2.2 times.
From January to June, 1.06 million new energy vehicles were exported, with a year-on-year increase of 75.2%. Among them, 1.011 million new energy passenger vehicles were exported, with a year-on-year increase of 71.3%, and 49,000 new energy commercial vehicles were exported, with a year-on-year increase of 2.3 times.
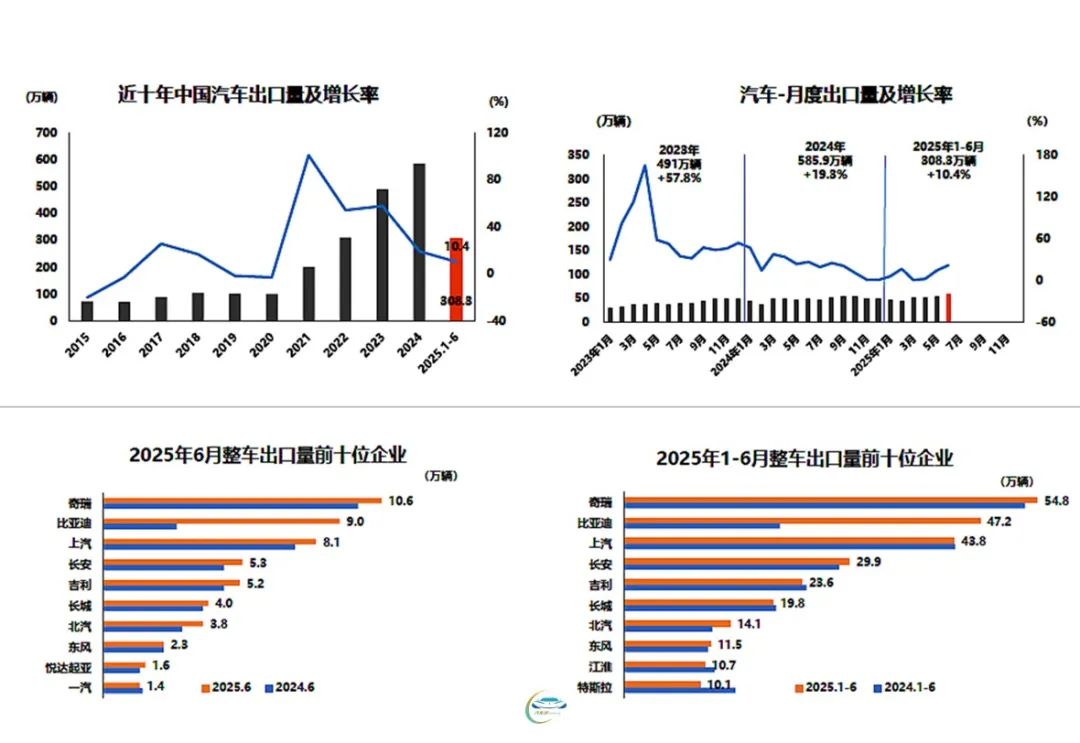
Overall automobile exports also maintained double-digit growth: In June, 592,000 vehicles were exported, with a month-on-month increase of 7.4% and a year-on-year increase of 22.2%. From January to June, 3.083 million vehicles were exported, with a year-on-year increase of 10.4%.
Amidst the fierce competition in China's automobile industry, Chery remains the leading brand in automobile exports this year. In June, its export volume reached 106,000 vehicles, with a year-on-year increase of 9.6%, accounting for 18% of the total export volume. The cumulative total has reached 548,000 vehicles, with a year-on-year increase of 3.1%, accounting for 17.8% of the total export volume. The fastest-growing brand is BYD, with exports totaling 90,000 vehicles in June, a year-on-year increase of 2.2 times. Cumulative exports from January to June reached 472,000 vehicles, with a year-on-year increase of 1.3 times.
-
![]()
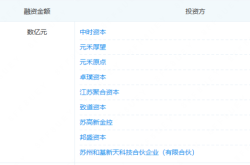
Jitian Xingzhou: A Pioneer in Optical Payloads Secures Hundreds of Millions in Series B Funding!
-
![]()
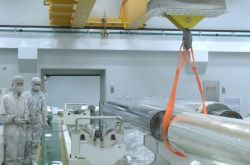
Orders Secured Through to the Second Half of the Year! The Rationale Behind the 'Surge' in Demand for This Company’s Optical-Grade Base Films
-
![]()
Beyond Patents: The Retail Rivalry of Insta360 and DJI Unfolds
-
![]()
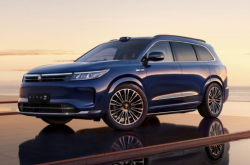
180 Billion Market Cap Vanished! How Did Seres Fall So Far?
-
![]()
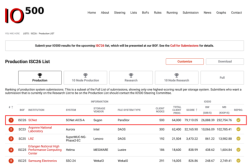
Blockbuster! Domestic storage takes the global double crown for the first time, from an AI company
-
![]()
China Spearheads Formulation! World's Pioneering Global Technical Regulation for Automated Driving Systems Greenlit and Unveiled
-
![]()
Farewell to Pulsed Support Policies: Three Major Auto Policy Directions from Multiple Departments Take Effect on the Same Day
-
![]()
Embercore AI’s Accelerated Funding: The Robot Industry’s Shift Toward ‘Learning Systems’