From 1% to 60%—China’s NEV Penetration Rate Hits 10-Year Milestone: What Does Plug-in Hybrid Surpassing Pure Electric Signify?
 05/09 2026
 531
531
Author | Jiang Xu Learn more financial information | BT Finance Data Pass The main text is 4,716 words and is estimated to take 9 minutes to read
In April 2026, a set of figures quietly appeared in the weekly report of the China Passenger Car Association: the retail penetration rate of new energy vehicles exceeded 59%.
There were no celebrations, no press conferences, and not even full-page coverage by most financial media outlets. Instead, everyone was more concerned about BYD’s sales ranking that month and which automaker had launched a new product.
Yet, this number alone is worth pausing to consider carefully.
Let’s rewind eleven years.
In 2015, China’s NEV penetration rate was less than 1%. Back then, people who bought NEVs were either forced to do so in cities with license plate restrictions or were early adopters and tech enthusiasts. The density of charging stations was insufficient, with driving ranges generally not exceeding 200 kilometers. The most frustrating aspect was that it was uncertain whether charging facilities were available in highway service areas. Before embarking on long-distance trips, drivers had to create “map strategies” to locate charging stations and calculate the distances between them.
One detail is worth remembering: that year, the state set a target in the
Now, let’s jump ahead to October 2022.
That month, the NEV penetration rate surpassed 30%, three years ahead of the policy’s original 2025 target. However, a more subtle event occurred: a group of Model Y owners in Shanghai discovered that their vehicle deliveries had been delayed. This coincided with Shanghai’s COVID-19 lockdown measures, during which Tesla’s Shanghai factory halted production. The supply chain domino effect spread nationwide, causing the official website of one NEV brand to even crash under a surge of orders.
In other words: it took less than seven years for NEVs in China to go from “no one buying them” to “not being able to buy them.”
Now, let’s fast-forward to the spring of 2026.
In April 2026, BYD released its monthly sales data, revealing that plug-in hybrid sales had surpassed pure electric sales for the first time—157,200 units versus 156,900 units, a slight but clear lead. This was not merely a strategic shift by BYD alone. Instead, it represented a collective answer from Chinese consumers, after a decade, regarding how new energy should truly be implemented, expressed through their actual purchasing behavior.
When you piece together these three scattered phenomena, you sense that there must be an underlying curve.
This curve is not a straight line of linear growth—“getting better and better.” Instead, it is a three-stage curve, with fundamental reversals in logic between each stage.
I call it the “Three-Stage Framework for New Energy Penetration”:
Stage 1 · Subsidy Phase (2015-2019): Policy-driven, rampant subsidy fraud, and inadequate infrastructure
Stage 2 · Competition Phase (2020-2024): Price wars, rapid technological iteration, winner-takes-all effects, and parallel development of multiple technology routes
Stage 3 · Stock Restructuring Phase (2025-present): Rational consumer decision-making, plug-in hybrid boom, and disappearance of pure electric premium pricing
As is customary, I aim to use this article to clarify these three stages—and to determine exactly where we stand now.
1
Stage 1 · Subsidy Phase (2015-2019): Policy-driven, rampant subsidy fraud, and inadequate infrastructure

In 2015, the penetration rate was less than 1%, yet China was already the world’s largest producer and seller of NEVs.
These two facts are not contradictory. While many NEVs were sold, who bought them? Most were leasing companies, ride-hailing platforms, and government procurement entities—private consumers represented only a marginal group within that less-than-1% share.
The logic of this stage was clear: sales followed where policies led. Automakers mass-produced models with the most subsidized driving ranges; cities with the densest charging station coverage had the highest NEV densities; in cities without license plate restrictions, NEV adoption was much lower because consumers lacked a compelling reason to switch.
An ugly reality that cannot be ignored during this stage was subsidy fraud. Statistics indicate that in 2016, fraudulently obtained subsidies amounted to 9.2 billion yuan. The modus operandi was straightforward: automakers would produce vehicles, register them, report sales figures, claim subsidies, and then these vehicles might never reach actual users.
Nevertheless, this stage served a crucial historical function: it used policy funds to forcibly establish China’s NEV production scale and supply chain foundation.
Without the large-scale capacity investments during the subsidy phase, BYD would not have achieved its scale advantage, CATL would not have developed its battery cost curve, and NIO, XPeng, and Li Auto would not have had the industrial foundation to start their businesses.
The subsidy phase laid the roots, even if many of them were crooked.
2
First Reversal: 2020—Subsidies Decline, but the Market Holds Strong
From 2019 to 2020, subsidies significantly decreased. Most people expected NEV sales to decline as a result.
But events did not unfold according to that script.
In 2020, despite the overall auto market being impacted by the pandemic, the NEV market penetration rate rebounded, continuing its upward climb from 5% in 2019. Why? Because the first batch of “truly drivable” pure electric models began to emerge. Tesla’s Model 3 was localized in China, with its price dropping from over 300,000 yuan to 240,000 yuan; BYD’s Han EV was launched, offering a 700-kilometer range; and NIO introduced its battery swap model, alleviating some users’ range anxiety.
The market’s signal light quietly shifted from “policy-driven” to “product-driven.”
3
Stage 2 · Competition Phase (2020-2024): Price wars, winner-takes-all effects, and the decisive battle of technology routes
This stage represents the most exciting yet brutal five years for China’s NEV industry.
By 2025, there were over 50 domestic NEV brands, resulting in fiercely competitive markets. Over 80% of models had experienced official or de facto price reductions, with an average decline of 8.2%, and NEVs saw an even higher average decline of 11.3%. Most companies found themselves trapped in a vicious cycle of “selling one vehicle at a loss.”
Two key historical milestones mark this stage.
Milestone 1: In 2022, the penetration rate exceeded 30%, achieving the national 20% target three years ahead of schedule.
That year, China’s NEV penetration rate soared to 25.6%, surpassing 30% in the latter months. This pace left the global auto industry astounded. Previously, Western automakers had judged China’s NEV market as “a bubble propped up by subsidies that would collapse once subsidies were withdrawn”—but the data from 2020 to 2022 completely disproved this assertion.
Milestone 2: From 2023 to 2024, plug-in hybrid sales grew rapidly, challenging the assumption that “pure electric is the future.”
In 2024, the overall NEV penetration rate reached 47.6%, with plug-in hybrids and extended-range models accounting for 20% and pure electrics accounting for 27.6%. Plug-in hybrids and extended-range models grew by 77.5% year-on-year, while pure electrics grew by only 22.6%.
This figure raised a serious question at the market level for the first time: consumers were not as firmly committed to pure electrics as previously assumed.
Another key outcome of this competition phase was the rapid formation of winner-takes-all effects. BYD’s sales alone equaled the combined sales of the second- through tenth-ranked companies. CATL’s batteries accounted for over 36% of global installed capacity. The concentration of the entire vehicle supply chain achieved in just four to five years what might have taken two to three decades in the traditional auto industry.
4
Second Reversal: Plug-in Hybrids Surpassing Pure Electrics—A Signal Worth Taking Seriously
In April 2026, BYD’s monthly sales data showed 157,200 plug-in hybrid units, surpassing 156,900 pure electric units for the first time.
Many interpret this as a product strategy issue for BYD. However, this is a misplaced understanding. This is not a BYD story; it is a consumer story.
Why have Chinese consumers shifted from pure electrics to plug-in hybrids? Behind this lies a highly rational calculation:
Range anxiety persists. For commuters in large cities, pure electrics are sufficient; however, for users in small and medium-sized cities, rural areas, and those frequently traveling long distances, the density and convenience of charging stations still lag behind gas stations. Even during the May Day holiday in 2026, charging at highway service areas still required queuing—though wait times had been reduced from two to three hours to 20-30 minutes, the problem persisted, albeit to a lesser degree.
Plug-in hybrids offer superior cost-effectiveness in this price range. In the mainstream 100,000-200,000 yuan consumer segment, high-quality plug-in hybrids can achieve the following: electric driving in urban areas (with per-kilometer costs 70% lower than gasoline vehicles), gasoline driving for long trips (eliminating range anxiety), and intelligent configurations that are on par with competitors. Rational consumer choices naturally favor this “best of both worlds” option without requiring policy guidance.
This is the most critical signal of the third stage: consumers’ cost-benefit calculations have begun to dominate the competition among technology routes, rather than automakers’ product planning or policy directions.
5
Stage 3 · Stock Restructuring Phase (2025-present): The era of consumer sovereignty has arrived
In December 2025, China’s NEV retail penetration rate historically surpassed 60%, marking a decisive transition from “policy-driven” to “market-driven” growth for NEVs.
This high penetration level indicates that China’s NEV market has shifted from a “blue ocean of incremental growth” to a “red ocean of stock competition.” Market competition in 2026 will become increasingly fierce.
The term “stock restructuring phase” derives from a fundamental shift in market logic: during the subsidy and competition phases, the core market question was “how to get more people to buy electric vehicles”; in the stock restructuring phase, the core question becomes “why should I convince you to switch from your existing vehicle to mine.”
The dominant logic in the first two stages was price wars: as long as I am cheaper than you, I can capture market share.
The dominant logic in the stock restructuring phase is the experience war: when you and your competitors offer similar prices, why should consumers choose you? Factors include the intelligent driving experience, the ecosystem of the intelligent cockpit, the speed of OTA updates, and the accumulation of brand reputation.
This also explains why everyone was talking about “intelligent driving” around 2026—not because automakers suddenly became interested in intelligence, but because the market had entered a stock competition phase where intelligence became the most critical differentiator.
6
Analogy: This Curve Was Already Observed in Japan During the 1990s
To understand the long-term shape of China’s NEV penetration curve, a cross-temporal analogy is worth considering: the penetration path of hybrid vehicles in Japan during the 1990s.
In 1997, Toyota launched the first-generation Prius in Japan, with a penetration rate close to 0%; by 2005, Japan’s hybrid vehicle penetration rate was approximately 3-5%; by 2015, it exceeded 35%, after which it entered a plateau.
What does this curve look like? Slow-fast-plateau. Growth from 1% to 5% was slow, from 5% to 30% was rapid, and after 30%, growth began to converge.
China’s NEV penetration curve essentially repeats this pattern, albeit with a compressed timeline: 1% to 5% took five years, 5% to 30% took two years, and 30% to 60% took three years.
However, there is a key difference between the two: Japan’s hybrid vehicle penetration ultimately peaked at around 40-50% and did not continue to fully replace traditional vehicles—because Japanese hybrids never fully resolved “true electric range anxiety.”
China’s new energy vehicles (especially the combination of plug-in hybrids and pure electrics) theoretically could push penetration to 70% or even higher—but this “higher” level will not happen automatically. It depends on whether charging infrastructure can improve coverage in rural and highway areas, whether battery costs can continue to decline, and whether the product competitiveness of plug-in hybrids and pure electrics can truly break through in the sub-100,000 yuan price range.
7
Map Marker: Where Are We on the Curve Now?
Using the three-stage framework, let’s mark our current position: we are in the early stages of the “stock restructuring phase.”
A 60% penetration rate means NEVs have become the dominant market force, but they are far from completing the replacement—the remaining 40% of internal combustion engine vehicle users represent a more difficult-to-reach group: those accustomed to gasoline vehicles, with concerns about charging, and living in areas with weak charging infrastructure coverage.
This figure raises a core unanswered question: what will drive growth beyond 60%?
The subsidy phase relied on policy support, the competition phase on price wars, and the stock phase on product competitiveness—but to push penetration from 60% to 70% or even 80%, what will be the next major driving force? Will it be the expansion of charging infrastructure into rural and highway areas? Will it be the complete elimination of range anxiety through solid-state batteries? Or will it be the accelerated exit of gasoline vehicles due to rising maintenance costs and declining residual values?
There are no answers yet. However, this is the most critical question for the industry to address from 2026 to 2030.
Another unanswered question remains: who is truly profitable amid rising penetration rates?
In 2025, over 80% of NEV models experienced price reductions, with most companies trapped in a vicious cycle of “selling one vehicle at a loss.” While penetration rates are soaring, the industry’s overall profitability is far more fragile than the market’s “prosperous” appearance suggests.
We still need to wait for one or two more years of financial reports to see the answer to this question.
8
A framework readers can take away: "The Three Stages of New Energy Penetration"
The value of this framework is not just for understanding the automotive industry. It can be applied to any emerging industry that transitions 'from policy-driven to market-driven':
Subsidy Phase → Those closest to the policy win.
Competition Phase → Those who survive the price war advance to the finals.
Stock Reconfiguration Phase → Those with superior product experiences retain users.
Photovoltaics, energy storage, commercial drones, humanoid robots... Almost all emerging industries heavily supported by China at the national strategic level follow this path. The only differences are the timelines, turning points, and the core dimensions of 'stock competition' for each industry.
Post this framework on your wall. Next time you see news about any emerging industry, ask yourself first: What stage is it in now? What is the dominant logic of this stage?
Finally, a sobering reminder for myself: This article condenses a decade of history into three stages, greatly simplifying it to help readers understand the patterns. The real evolution of industries is far more complex—each stage contains countless minor reversals, and many events cannot be explained within the industrial framework alone, requiring consideration of geopolitics, capital market sentiment, and random technological breakthroughs.
Use this three-stage framework to ask questions, not to provide answers.
This article is solely for information sharing and industry analysis and does not constitute any investment advice, investment analysis opinions, or trading solicitations. The market carries risks, and investment should be made with caution. Any investment decisions made based on this article are undertaken at the individual's own risk, with both gains and losses borne by the investor. The author and publishing platform assume no legal liability.
This article is an original piece by BT Finance and may not be used, reproduced, disseminated, or adapted without permission. Infringement will result in legal action.

-
![]()
Total Investment Hits Nearly 3.28 Billion! Goertek Launches Mass Production of 12-Inch Transparent Substrate Wafer for AR Glasses’ Micro-Nano Optical Components
-
![]()
Why Is This Precision Optical Film Leader Worth Reevaluating with a Tens of Millions Procurement?
-
![]()
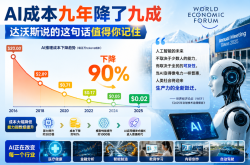
AI Costs Plummet by 90% Over Nine Years: Key Insights from Davos You Shouldn’t Miss
-
Doubao, Your Late-Night AI Companion, Now Eyes Profitability
-
![]()
SRC Empowers SEER Intelligence to Reach a Market Cap of Tens of Billions, Yet Fails to Sustain Profitability
-
![]()
China’s Embodied AI Industry Faces Fierce Domestic Competition, Making Overseas Expansion Essential for Survival
-
![]()
32.8 Billion Yuan Investment! Goertek’s 12-Inch AR Glasses Optical Wafer Base in Lingang Begins Operations
-
![]()
How Far is the All-New Li Auto L8 from Being the Best Five-Seat SUV with In-House Full-Stack Development?