Betting Lives on Survival: Has Oracle's 'AI Gamble' Really Paid Off?
 03/13 2026
 516
516
Oracle, the most controversial among the four major cloud giants, released its Q3FY26 results (ending late February) after the U.S. market closed this morning. Overall, the quarterly performance was a mixed bag: strong and accelerating growth in database and compute-leasing-focused OCI business, but worse-than-expected margin compression and a sharper-than-anticipated rise in Capex and borrowing.
Thus, the overall quarterly performance can only be considered neutral, with positives offsetting negatives. The true highlight driving after-hours gains was the company's raised full-year FY27 guidance, from the previous $85-90 billion range. Key takeaways include:
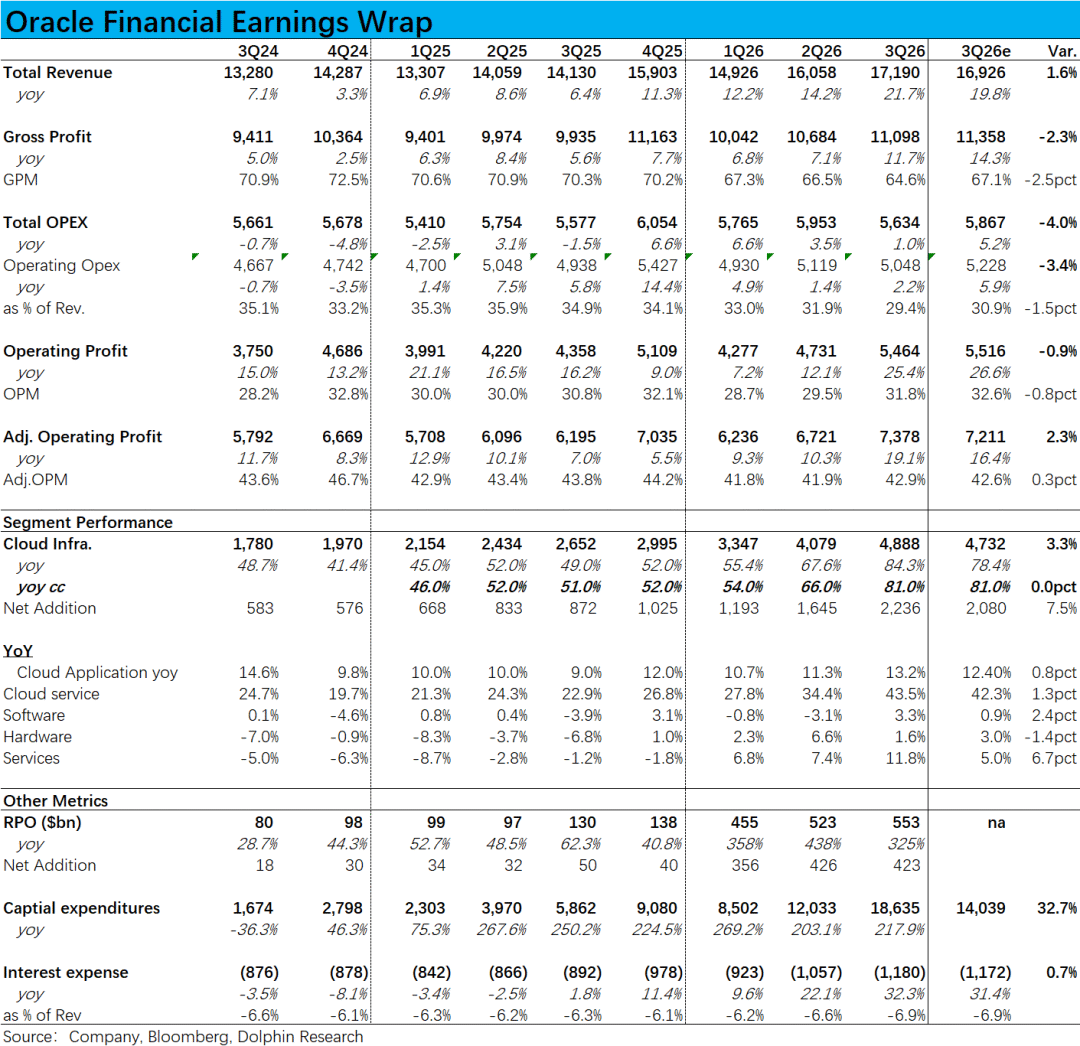
1. Core Business - OCI Accelerates as Expected: Under the cloud segment, IaaS-based OCI revenue reached $4.89 billion this quarter, up 81% YoY at constant currency (CC), accelerating from 66% in the prior quarter. Net YoY revenue growth also surged 36% QoQ, hitting a record high.
The accelerating momentum of OCI is a positive signal, though high market expectations mean it merely met—rather than exceeded—forecasts.
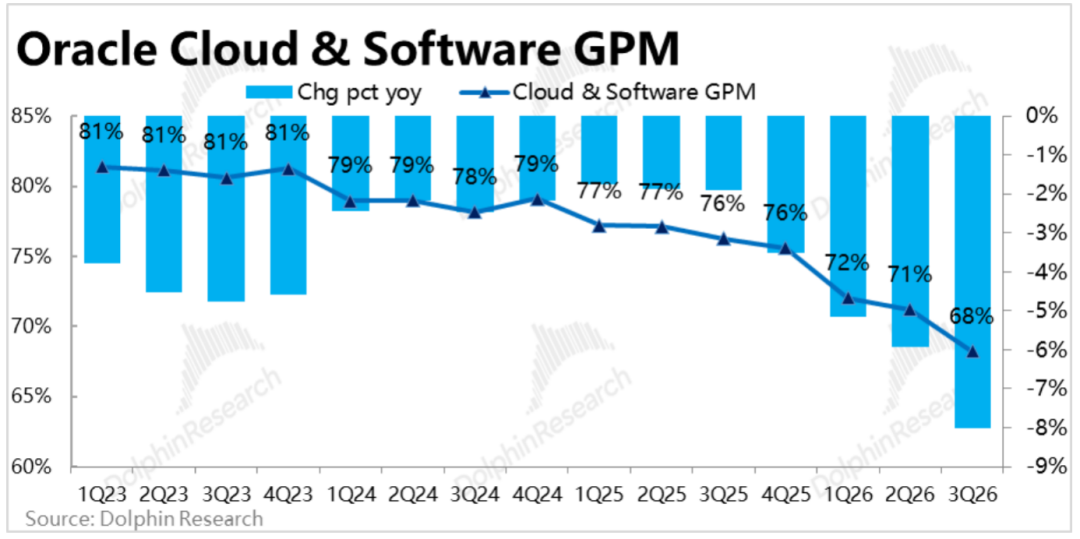
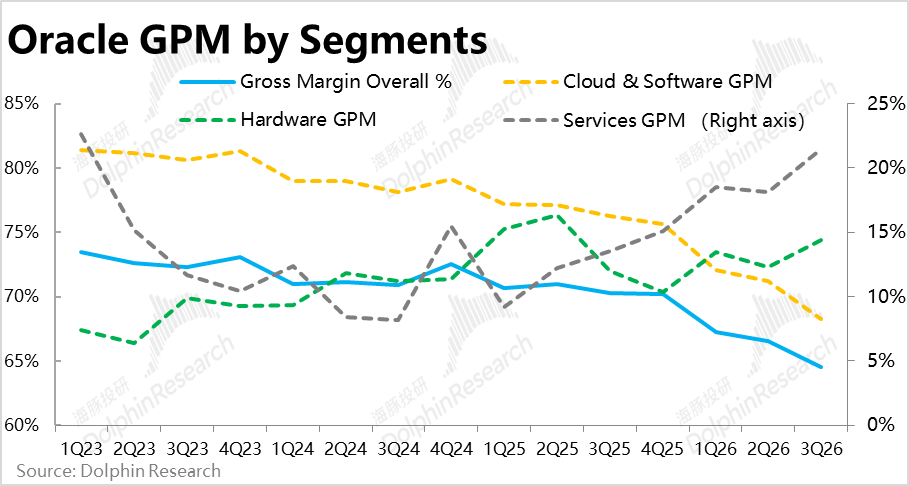
2. AI Business Weighs Heavier on Margins Than Expected: As a side effect of OCI's acceleration, the combined cloud + software gross margin (not disclosed separately) fell to ~68% this quarter, an 8 ppt YoY drop—worse than the 5.9 ppt decline last quarter and below consensus.
Assuming software margins held steady, cloud business margins likely dipped below 50%, with OCI margins possibly hovering around 30%.
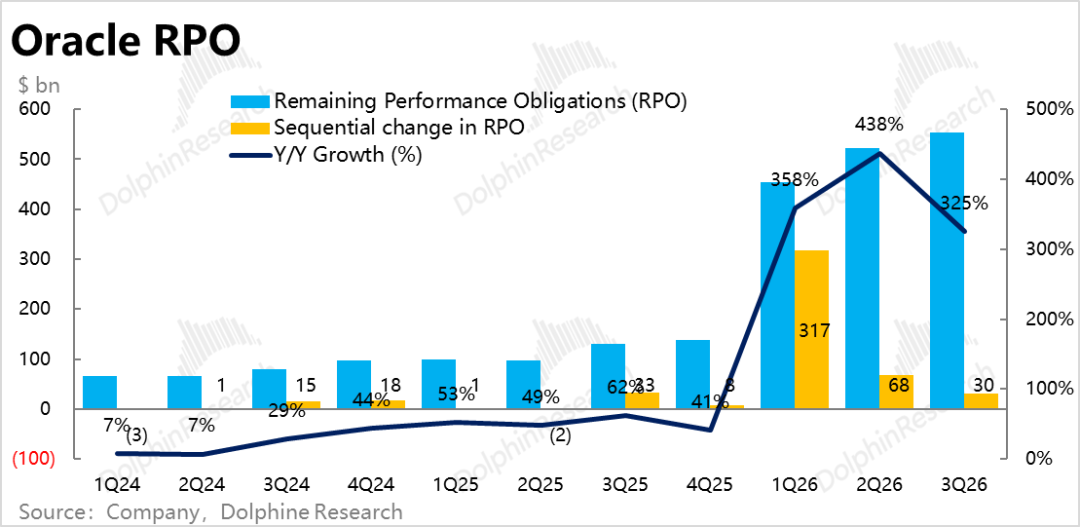
3. Leading Indicator Growth 'Pauses': Remaining performance obligations (RPO), reflecting new order demand, rose ~$30 billion QoQ. After a massive Q1 surge, new orders have slowed for two consecutive quarters, lacking major surprises. Still, the absolute increase remains substantial, equivalent to 6x this quarter's OCI revenue.
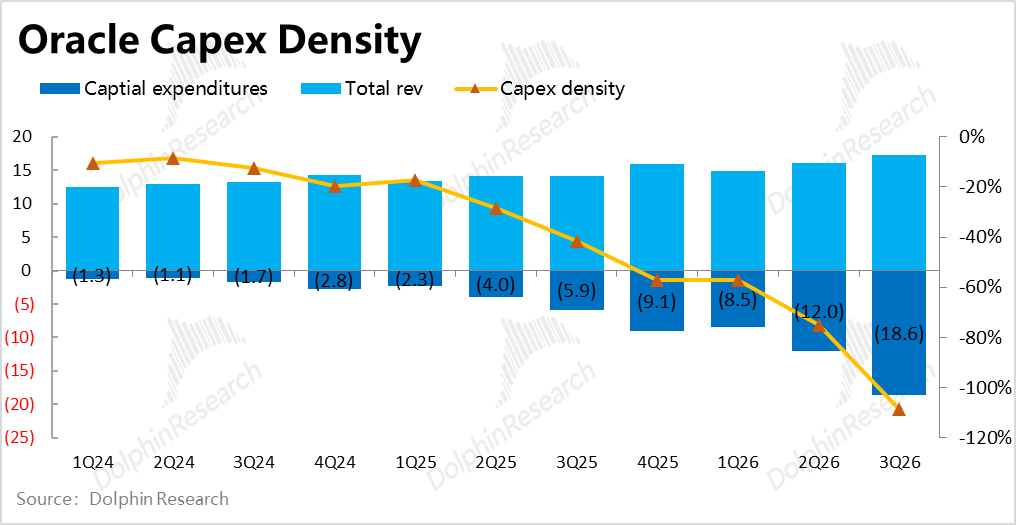
4. Capex Surges: As a prerequisite for OCI growth, Capex hit $18.6 billion this quarter, up from $12 billion last quarter, setting a new single-quarter high.
For the first time, Capex exceeded total revenue this quarter, with free cash flow turning negative by ~$10 billion for two straight quarters. Such cash outflows necessitate heavy external financing.
However, based on FY26's $50 billion Capex guidance, next quarter's spending will likely drop to ~$12 billion.
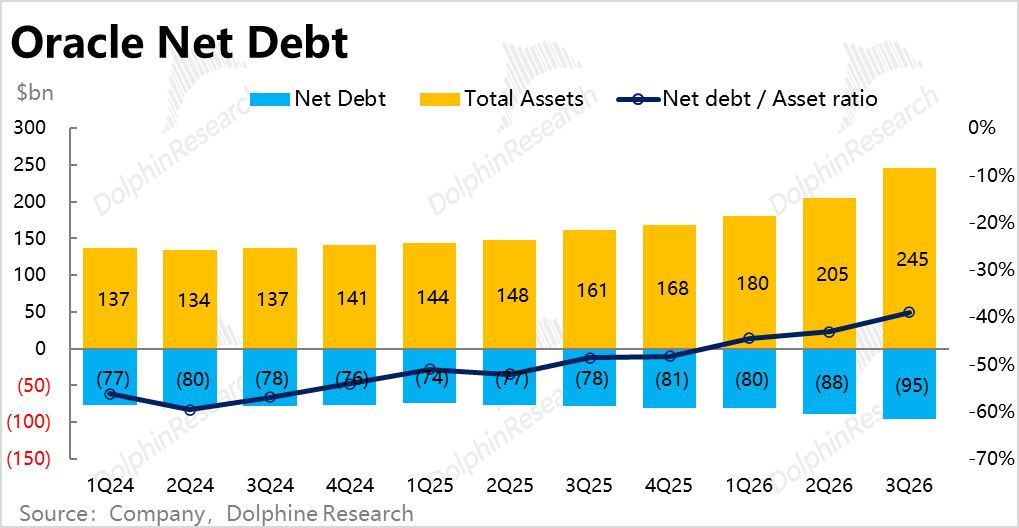
5. Financing Progress: Of the previously announced $45-50 billion financing plan, ~$30 billion was completed this quarter, including ~$25 billion in new debt and ~$5 billion in preferred shares. Net interest-bearing debt climbed to $95 billion, with a net debt/asset ratio of 39%.
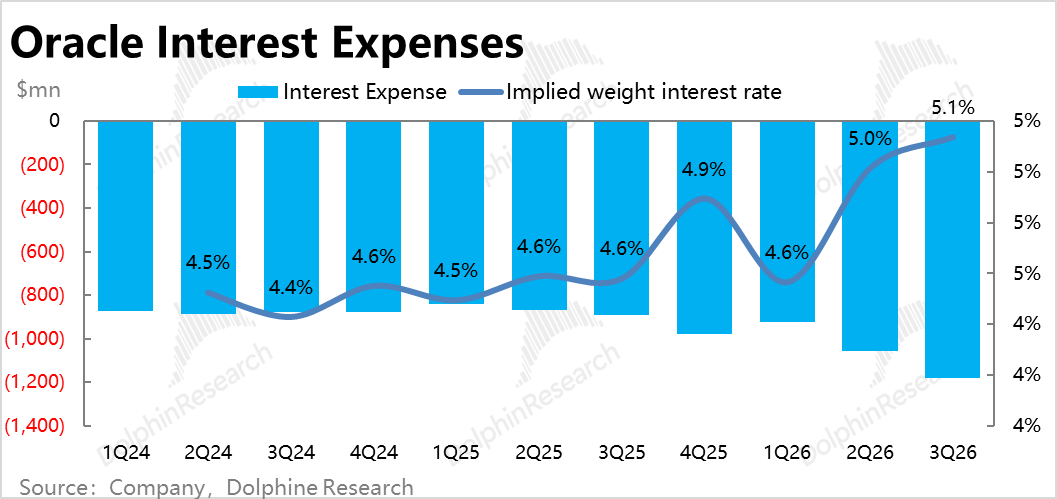
Correspondingly, interest expenses hit $1.18 billion, up 32% YoY, with its share of total revenue rising ~0.3 ppt QoQ.
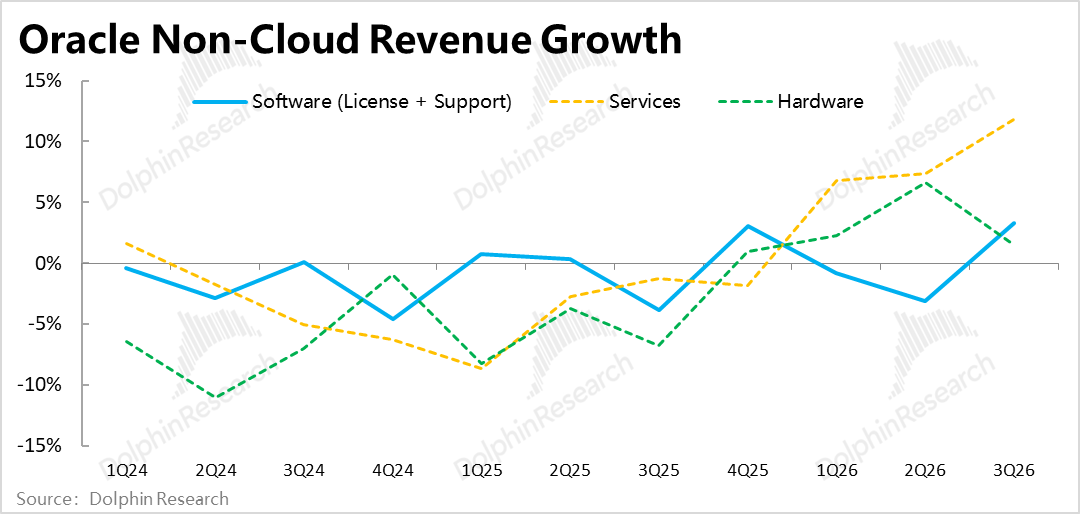
6. Other Businesses Remain Sluggish: Excluding OCI, SaaS revenue under the cloud segment grew 11% at CC, flat QoQ. Traditional software and hardware revenue saw little to no growth (or slight declines) after excluding FX gains.
Only consulting revenue, driven by cloud growth, accelerated past 10% this quarter, but its smaller scale limits impact.
7. Overall Performance:
a. Led by OCI, total revenue growth breached the 20% mark this quarter—a symbolic milestone. However, growth at CC was 18%, aligning with the upper end of prior guidance but not exceeding expectations.
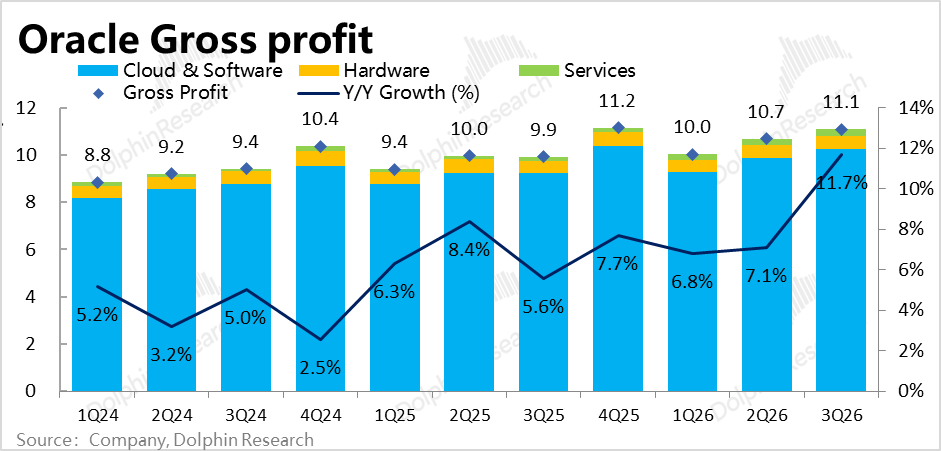
b. Despite improving software/hardware margins, group-wide gross margins fell 5.7 ppt YoY to 64.6%, well below consensus of 67%, due to OCI's drag.
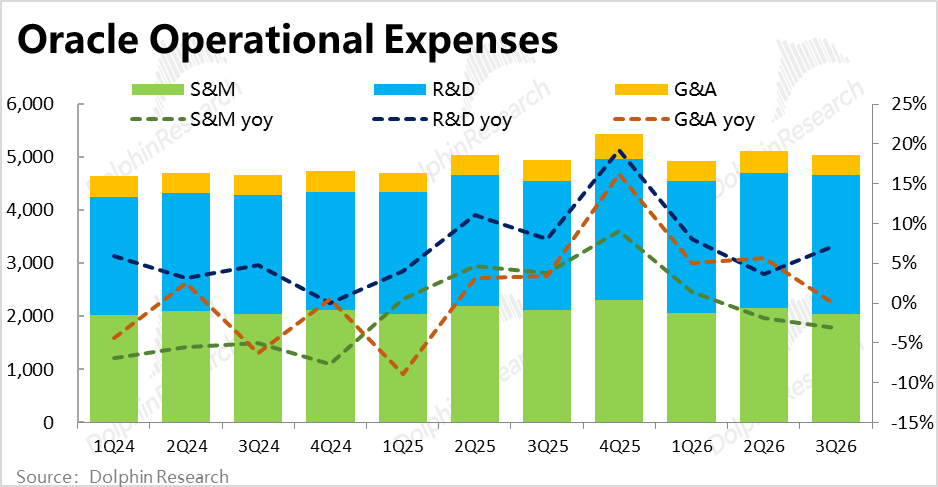
c. Operating expenses rose just 2.2% YoY this quarter, far below consensus expectations of ~6%. OCI's growth and investments had minimal impact on operating costs.
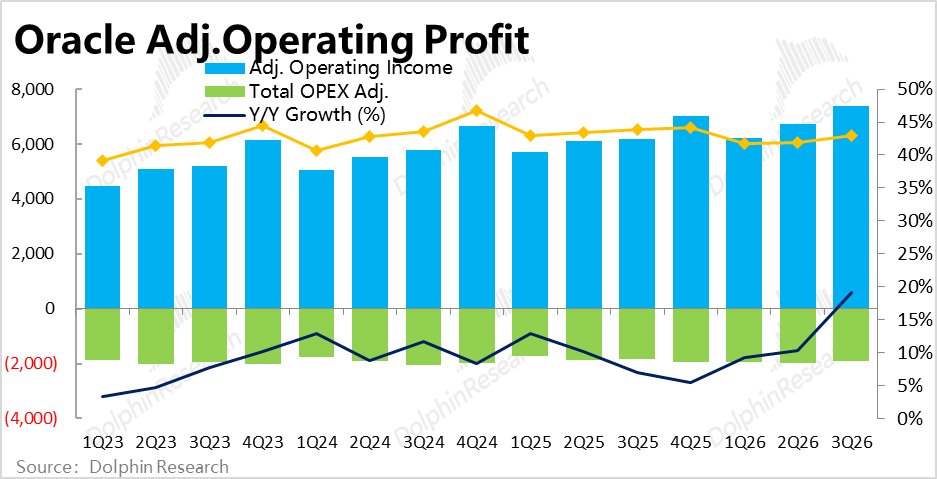
Thanks to strong cost control, adjusted operating margins fell only 0.9 ppt YoY, beating consensus by ~0.3 ppt. Adjusted operating profit reached $7.38 billion, up 19% YoY, slightly above expectations.
8. Guidance - Short-term In-Line, Mid-term Raised: For Q4FY26, at CC guidance upper bounds, total revenue is expected to grow 20% YoY, with cloud (IaaS + SaaS) up 48% and adjusted diluted EPS up 17%.
Trends show accelerating total and cloud revenue growth next quarter, with adjusted profit growth largely flat. Guidance upper bounds align with market expectations.
Dolphin Research Views:
1. Before discussing quarterly performance, let's outline Oracle's current narrative and logic to better identify key metrics.
First, excluding OCI (IaaS), Oracle's remaining traditional businesses lack growth, with long-term revenue growth hovering near zero or in low single digits. Like other software firms, these legacy businesses face AI disruption risks.
Thus, OCI is Oracle's sole focus. Key metrics include OCI revenue acceleration and RPO growth reflecting new demand. While single-quarter revenue doesn't prove/disprove long-term guidance, it reflects short-term execution and capacity ramp-up.
However, beyond potential revenue growth, markets focus on two core issues: (1) Will OCI's AI-related business, driven by expensive GPUs and Capex, see margins significantly lower than existing businesses? Thus, another key metric is the Cloud & Software segment's margin decline, to estimate OCI's margin trends.
(2) As Oracle relies heavily on external financing for OCI-related Capex, can it secure sufficient funds? And how will new debt/equity financing impact its balance sheet and income statement?
2. Against these key metrics, this quarter's performance shows:
a. OCI's short-term growth and next quarter's implied growth largely met expectations, accelerating as planned. New RPOs offered no major surprises.
b. Concerns about OCI's margin drag proved valid, with worse-than-expected impacts.
c. The worst-case scenario—inability to secure financing—was disproven with the nearly $50 billion financing plan and $30 billion raised this quarter. Current market sentiment and credit conditions aren't that dire.
d. However, high Capex and debt did drag margins and pushed interest expenses higher as a share of revenue/profit, reflecting negative balance sheet and income statement impacts.
Overall, these results don't represent a turning point in investment logic or narrative. Both bullish (OCI growth) and bearish (margin erosion, debt pressure) theses were validated this quarter.
The key change is Oracle's raised FY27 revenue guidance from $85-90 billion, implying ~34% YoY growth—suggesting faster mid-term capacity rollout and raising confidence in its 2030 long-term targets.
3. Valuation Analysis: As Oracle's growth and controversies center on its IaaS business (especially OCI AI), we analyze from two angles:
- Exclude all OCI AI impacts (e.g., incremental revenue, margin drag, extra Capex/debt/interest) and value traditional businesses (software + hardware + services + non-AI SaaS/OCI) as the base case.
- Back out market pricing for OCI AI based on current market capitalization (market cap) and assess rationality against guidance.
a. Traditional Businesses: Mature segments (SaaS + software + hardware + services) sustain low single-digit growth (~3%). OCI (non-AI) maintained ~50% revenue growth in FY22-24 even without AI demand, suggesting ~35% CAGR in FY26-27.
Combined revenue could reach ~$68 billion in FY27. Assuming gross margins slip slightly to 70% (excluding AI impacts) and operating expenses grow at low single digits, FY27 after-tax profit (excluding OCI AI) might exceed $20 billion.
****For detailed valuation analysis, see Dolphin Research's full article in the Changjiang App's 'Insights - Deep Dive' section.
In summary, Oracle's stock has erased all gains since the Stargate project and $300 billion order announcements.
Under a strict scenario where AI fails (OpenAI defaults or AI economics underperform), not only would AI valuations collapse, but high debt and asset write-downs could create negative equity. Thus, traditional businesses alone may not fully support the current market capitalization .
However, if OCI AI delivers as guided on revenue and margins, current valuations imply very low multiples (~15-17x) for both traditional and AI businesses. As narratives and sentiment improve alongside execution, a re-rating is likely.
Below are key financial charts and business overviews:
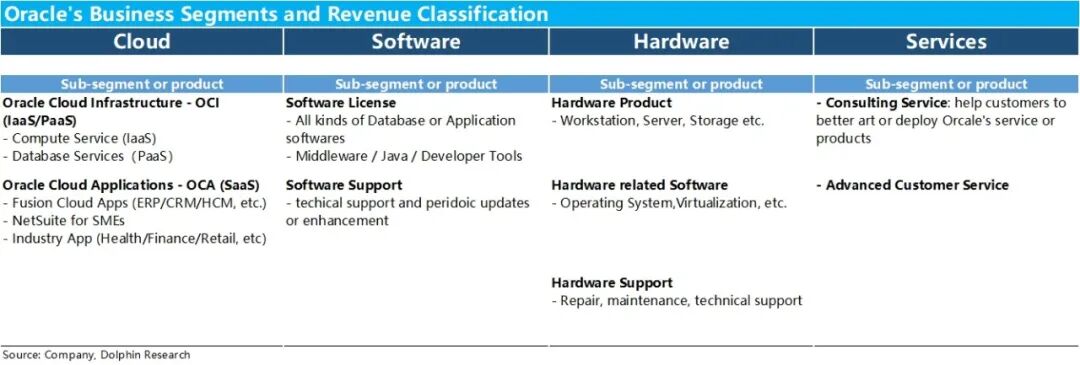
I. Oracle's Business & Revenue Segments
As a software industry veteran since the 1980s, Oracle's historic core was databases and software services (traditional licensing). However, cloud transformation and AI adoption have made cloud services its most critical segment.
Starting in FY26, Oracle restructured its reporting into four segments: Cloud, Software, Hardware, and Services.
Breakdown:
a. Cloud: Comprises IaaS (OCI) and SaaS (OCA) lines. OCA includes SaaS-based ERP/CRM/general management tools and vertical industry solutions. OCI focuses on database services and compute leasing.
OCA previously dominated cloud revenue, but OCI has surpassed it amid rapid growth in the past 1-2 years.
b. Software: Traditional on-premise software, once Oracle's largest segment, now trails cloud. It includes one-time software license sales and recurring support revenue (updates, maintenance).
c. Hardware: Similar to software, with one-time server/hardware sales and recurring maintenance/support, accounting for the smallest revenue share.
d. Services: Includes consulting and custom services, contributing high single-digit revenue percentages in recent years.
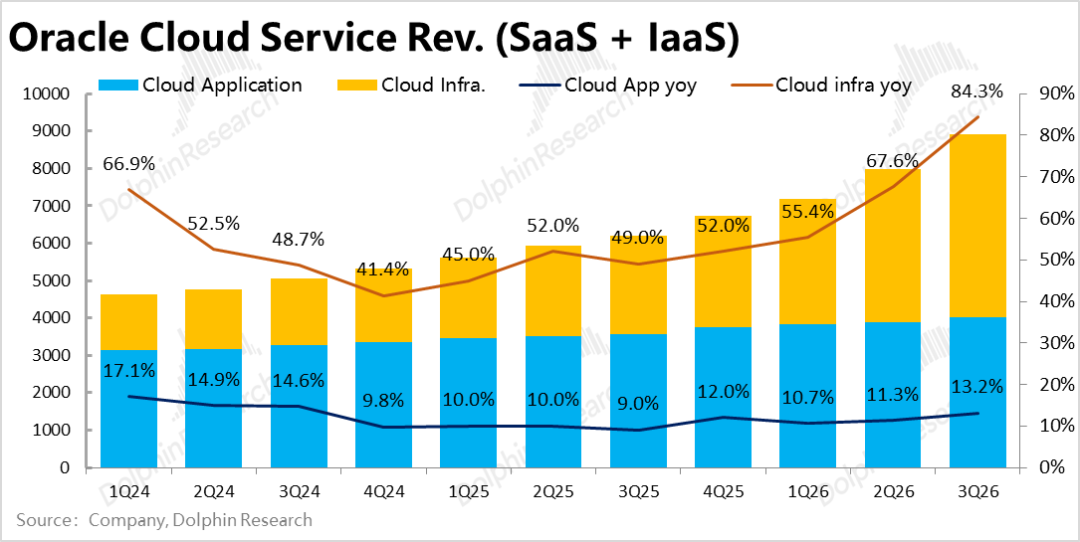
II. Key Focus: OCI Performance
1. Core Business - OCI Growth Accelerates
OCI revenue under the cloud segment hit $4.89 billion this quarter, up 81% YoY at CC—accelerating from 66% last quarter. Net YoY revenue growth surged ~$2.24 billion, up 36% QoQ.
OCI's accelerating momentum is positive, though it merely met consensus expectations of 81% growth.
SaaS revenue grew 13% YoY this quarter, with a slight QoQ acceleration entirely due to FX gains. At CC, growth was flat QoQ, with unimpressive absolute growth.
2. AI Business Drags Margins Harder Than Expected
As OCI scales, its margin drag intensifies. Combined cloud + software gross margins fell to ~68% this quarter, an 8 ppt YoY drop—worse than last quarter's 5.9 ppt decline and below consensus.
Assuming software margins held, cloud margins likely dipped below 50%, with OCI margins possibly around 30% (per sell-side estimates).
Markets' primary concern about rapid OCI growth is its margin impact, and these results amplified—rather than alleviated—those fears.
3. Leading Indicators – Is RPO Growth Taking a 'Half-Time Break'?
The current revenue growth actually reflects the speed of capacity realization, while the backlog of unfulfilled contracts, which reflects new demand, reached RMB 553 billion this quarter, with a net increase of approximately RMB 30 billion quarter-over-quarter.
In terms of trends, after a massive influx of orders in the first quarter, the scale of new orders has continued to decline over the past two quarters, appearing somewhat 'quiet.' However, the absolute volume of new orders is not low, equivalent to six times the OCI revenue recognized this quarter. A quarter's worth of new orders equals one and a half years' worth of current OCI revenue.
The company did not specifically disclose which customer the new orders came from this time, but they still originated from large-scale AI businesses. It was particularly emphasized that the company itself did not need to secure additional financing or Capex for these orders. Customers either purchased GPUs themselves or provided sufficient advance payments to cover GPU purchase costs.
III. Rapid Increase in Capex and Debt Investment
Along with the growth in OCI revenue and accelerated capacity realization, the company's Capex investments and financing needs have also surged rapidly.
Capex spending reached RMB 18.6 billion this quarter (vs. quarterly revenue barely exceeding RMB 17 billion), representing a significant increase from RMB 12 billion in the previous quarter, with a record-high net increase in a single quarter.
Moreover, the total Capex for this quarter also exceeded the company's total quarterly revenue for the first time, a phenomenon similar to that of another new cloud player, CoreWeave. However, Oracle, as an established leader with another half of its revenue coming from traditional businesses, makes this a very rare occurrence.
In terms of cash flow, due to limited growth in operating cash flow (YoY +20%) at approximately RMB 7.1 billion this quarter, coupled with surging Capex, the company has experienced negative free cash flow of around RMB 10 billion for two consecutive quarters.
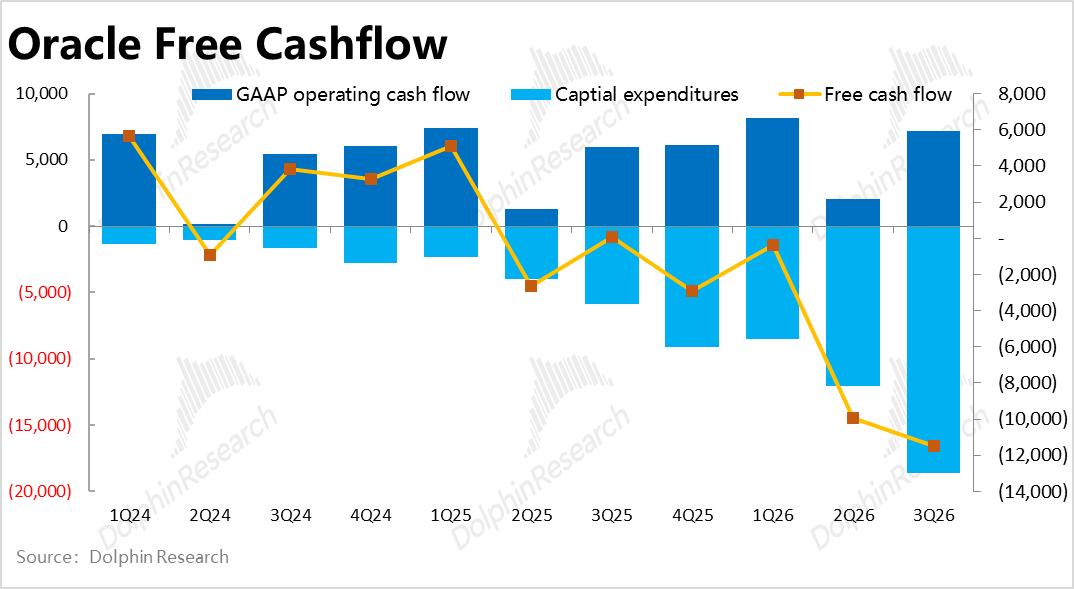
To support high and rapidly increasing capital expenditures, the company officially announced that it had completed approximately RMB 30 billion of its RMB 45-50 billion financing plan as of this quarter, including approximately RMB 25 billion in new debt issuance and approximately RMB 5 billion in preferred stock issuance. Net interest-bearing debt climbed from approximately RMB 81 billion at the end of FY25 to RMB 95 billion currently, with a net debt-to-asset ratio of 39%.
As a result, interest expenses reached RMB 1.18 billion this quarter, significantly higher by 32% YoY, with the proportion of total revenue also increasing by approximately 0.3 percentage points sequentially.
After this financing, the company currently has approximately RMB 38 billion in cash on hand (of which approximately RMB 10 billion needs to be reserved for daily operations as per previous practices). At the current burn rate, this can support operations for at most two quarters. Subsequently, the company will inevitably continue to seek financing (approximately RMB 25 billion in new equity financing from the RMB 50 billion plan remains unexecuted).
IV. Other Segments Remain Largely Flat
Except for the cloud business, growth in the company's other three major business segments remains 'as flat as water.' Only the small-scale consulting business has shown sustained acceleration in growth, surpassing a 10% growth rate, indicating genuine signs of improvement. As the cloud business accelerates, it has also brought about increased consulting demand.
Meanwhile, the growth rates of traditional software services and hardware sales, after excluding the positive impact of exchange rates, still show essentially stagnant year-over-year revenue growth in real terms.

V. Overall Performance
1. Total Revenue Growth Exceeds 20%
Combining the four major business segments, although traditional businesses have not shown signs of recovery, driven by the high-growth OCI business, the company's overall revenue growth rate this quarter has symbolically broken through the 20% mark, considered significant by many leading sell-side analysts.
After excluding the positive impact of exchange rates, constant currency revenue growth was 18%, merely matching the upper limit of previous guidance and not exceeding expectations.

2. Overall Gross Margin Under Pressure and Declining
Although the gross margins of the hardware and services segments improved year-over-year this quarter, these two segments have limited weight. Dragged down by the key OCI business, the company's overall gross margin declined by approximately 5.7 percentage points YoY to 64.6%, significantly lower than market expectations of 67%. It is evident that the OCI business has also significantly dragged down the overall gross margin.
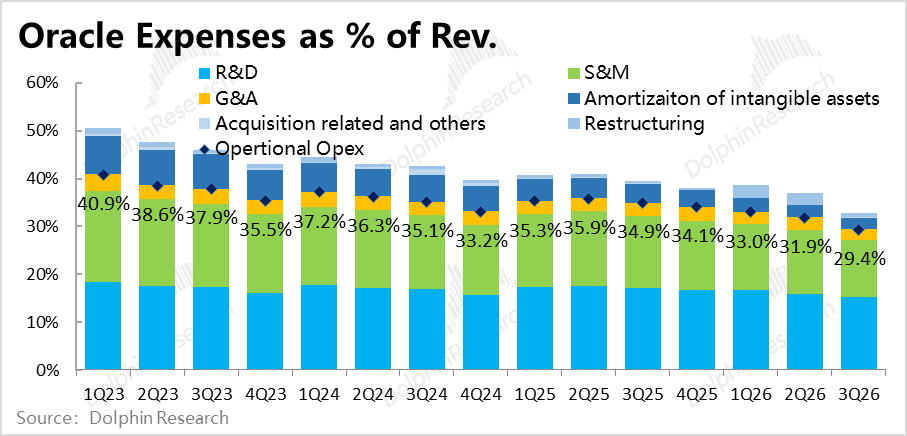
3. Strict Cost Control Remains in Place
In terms of expense control, focusing on the three major regular operating expenses, the YoY growth rate this quarter was only 2.2%, significantly lower than market expectations of nearly 6%. It is evident that the rapid growth and investment in the OCI business have had little impact on operating expenses. The company continues to maintain a strict cost control stance.
Additionally, non-operating expenses confirmed this quarter (such as intangible asset amortization, restructuring costs, etc.) also significantly decreased, resulting in a lower YoY growth rate of only 1% for total operating and non-operating expenses.
Benefiting from excellent cost control, despite a significant decline in gross margin, the adjusted operating profit margin only decreased by 0.9 percentage points YoY this quarter, actually exceeding market expectations by approximately 0.3 percentage points. Consequently, the final adjusted operating profit was RMB 7.38 billion, slightly higher than market expectations.
- END -
// Reprint Authorization
This article is an original piece by Dolphin Research. Reprinting is only allowed with authorization.
// Disclaimer and General Disclosure Notice
This report is intended solely for general comprehensive data purposes, designed for general reading and data reference by users of Dolphin Research and its affiliated entities. It does not take into account the specific investment objectives, investment product preferences, risk tolerance, financial status, or special needs of any individual receiving this report. Investors must consult with independent professional advisors before making investment decisions based on this report. Any investment decisions made using or referencing the content or information in this report are at the investor's own risk. Dolphin Research shall not be liable for any direct or indirect responsibilities or losses that may arise from using the data contained in this report. The information and data in this report are based on publicly available sources and are for reference purposes only. Dolphin Research strives to ensure but does not guarantee the reliability, accuracy, and completeness of the information and data.
The information or viewpoints mentioned in this report shall not, under any jurisdiction, be regarded or construed as an offer to sell securities or an invitation to buy or sell securities, nor shall they constitute recommendations, inquiries, or endorsements of relevant securities or related financial instruments. The information, tools, and data contained in this report are not intended for or proposed for distribution to jurisdictions where distribution, publication, provision, or use of such information, tools, and data conflicts with applicable laws or regulations, or where Dolphin Research and/or its subsidiaries or affiliated companies are required to comply with any registration or licensing requirements in such jurisdictions, nor to citizens or residents of such jurisdictions.
This report merely reflects the personal viewpoints, insights, and analytical methods of the relevant creators and does not represent the stance of Dolphin Research and/or its affiliated entities.
This report is produced by Dolphin Research, with copyright solely owned by Dolphin Research. No institution or individual may, without the prior written consent of Dolphin Research, (i) produce, copy, duplicate, reproduce, forward, or create any form of copies or reproductions in any manner, and/or (ii) directly or indirectly redistribute or transfer to other unauthorized individuals. Dolphin Research reserves all relevant rights.
-
![]()
"3D Vision Pioneer" Grapples with Internal Strife: $120 Million in Share Reductions Offset by $147 Million Private Placement
-
![]()
The domestic auto sales have declined so much that dealers who can't hold on have started closing stores en masse
-
![]()
Five Brands Team Up with Huawei: Will Dongfeng Still Pursue Independent R&D?
-
![]()
The Large Six-Seater SUV Market: Overhyped and Overrated
-
![]()
The Smart Driving Blue Light: Urgent Need for Rectification
-
![]()
Would OpenAI Be Fascinated by Anthropic’s Concepts?
-
![]()
Tencent: Few Great Queries, Yet Possessing the Ultimate One
-
Does DingTalk Need Revolutionaries or Reformers?