Meta: Throwing Money Won't Create a Top-tier Model, Zuckerberg May Panic Again
 05/06 2026
 520
520
Hello everyone, I'm Dolphin Research!
The issue with Meta's Q1 earnings report is not just about the current quarter but rather that the new guidance fails to alleviate expectations of a decline in profit margins. This contrasts with pre-earnings rumors of tightened spending, which had led investors to expect cost reductions. However, the fundamental issue remains the lack of a second growth curve to deliver on the AI narrative, causing investors to lose patience once again.
Let's take a closer look:
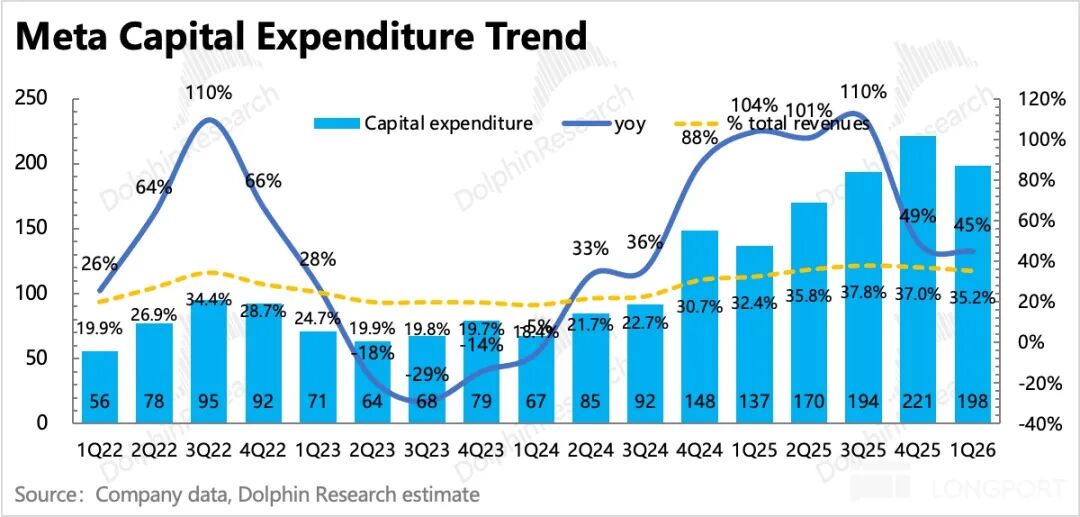
1. Spending is not being tightened; in fact, additional investments are planned: Meta increased its full-year Capex guidance by $10 billion, bringing it to a range of $125-145 billion (driven by rising prices for components like memory). At the same time, there was no downward adjustment to Opex guidance, as investors had hoped.
Over the past two months, various rumors about Meta tightening its VR investments and implementing layoffs have emerged, leading investors to expect cost reductions. However, the reality is that spending has increased rather than decreased, which is undoubtedly not in line with expectations.
2. Revenue growth has not accelerated in tandem: Whether the market approves of the move to 'increase investments' depends on whether sufficient growth is achieved under high spending. For example, last quarter's Capex guidance was also raised, but it was accompanied by a significant acceleration in Q1 revenue growth expectations. Therefore, just before the earnings report, when investor sentiment toward Meta was already conservative, there was a wave of 'expectation revisions.'
However, this quarter's Capex guidance increase is matched by a Q2 revenue guidance showing slower growth (median growth rate of 25% vs. Q1's 33%). While the growth itself is not poor and may also take into account the macroeconomic impact of conflicts in the Middle East, the forward-looking indicator of user engagement has also shown a seasonal decline in Q1 for the first time, implying more pressure on profit margins this year. This directional change clearly deviates from the expectations of buy-side investors.
3. Relying solely on the advertising core business fails to unlock the true potential of AI: There is no denying that Meta's advertising business remains very strong and is currently in a favorable period. Q1 growth was 33%, exceeding guidance and meeting buy-side expectations.
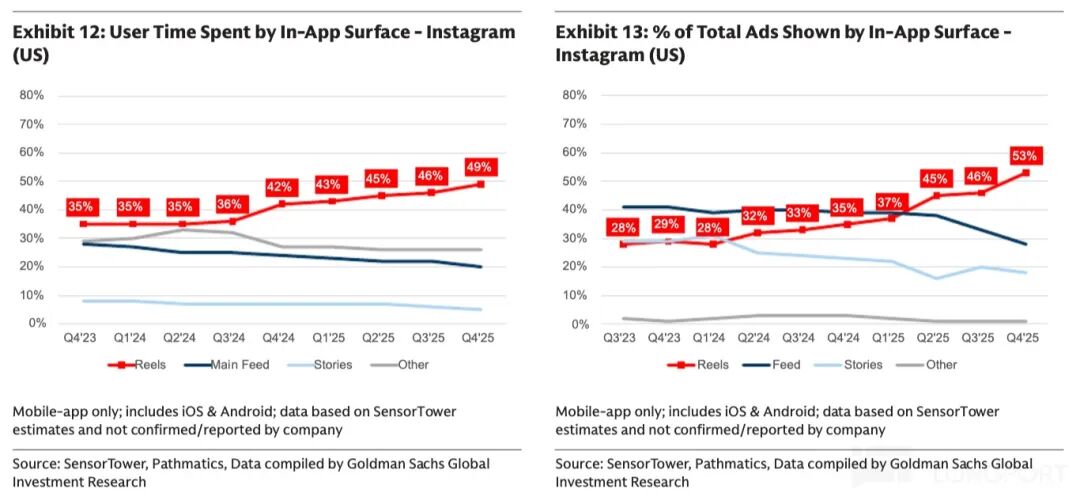
However, not all of this growth is attributable to AI. First, the macroeconomic environment in North America was favorable in Q1, with added momentum from the Winter Olympics and the ongoing trend of consumer brands shifting marketing budgets online. Second, the rise of short-form video has benefited Reels, with CPM (cost per thousand impressions) prices continuously rising. Additionally, the commercialization of Threads has directly contributed incremental growth. These factors can all be seen as growth drivers inherent to the advertising business, from which Meta would benefit even without AI.
However, Meta lacks a new growth curve akin to Google Cloud—a business almost entirely driven by AI, independent of advertising, and already in its monetization phase. For investors, this would make the ROI of AI investments clearer. Instead, Meta's approach feels like a continuous increase in investment without a clear understanding or particularly high 'pure AI ROI.'
As the Q2 guidance implies a gradual slowdown in growth, investors are beginning to question the rationale behind further increasing investments. While not entirely opposed, the reduced clarity on growth will affect short-term valuation anchors.
4. Maintaining the bottom line of positive profit growth: Q1 profit performance was acceptable, with operating profit reaching $22.9 billion and a stable profit margin of 41% quarter-over-quarter (net profit grew more significantly, primarily due to an $8 billion tax provision reversal in February following tax policy changes. Excluding this, net profit was $18.8 billion, up 13% year-over-year).
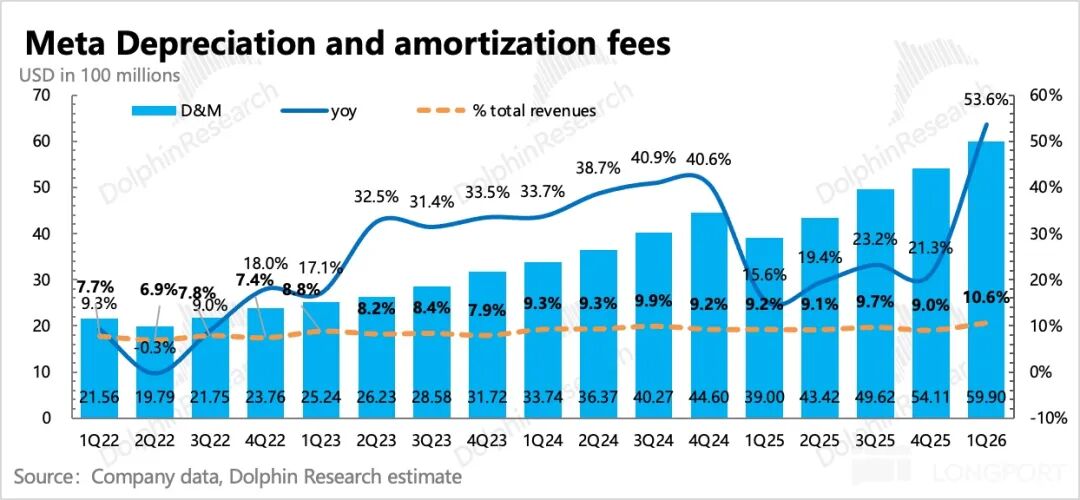
Aside from reduced losses in the RL segment, another reason is that depreciation and amortization have not fully caught up with the high Capex investments, with depreciation costs increasing by only 10% quarter-over-quarter. Moreover, Q1 Capex was less than $20 billion, accounting for only 14%-16% of the full-year Capex guidance.
Before the earnings report, the market expected Meta's operating profit growth rate for 2026 to be 4-5%. While Opex guidance was not raised this time, the attitude of not reining in investments is likely to still cause concerns about downward revisions to full-year profits. Management has temporarily committed to positive year-over-year operating profit growth, setting a performance floor. Otherwise, investor reaction to this earnings report might have been even more panicked.
5. Stock price under pressure, share buybacks remain paused: Share buybacks were halted last quarter, and even as the company chose to borrow heavily for continued aggressive investment this quarter, no buybacks were conducted despite a significant stock price decline. Like Google, Meta has only maintained its regular stable dividend of $1.35 billion, offering a disappointingly low return.
At the end of Q1, Meta held $81.2 billion in cash and short-term investments, unchanged from the previous quarter, with free cash flow of $12.4 billion this quarter.
6. Overview of Performance Metrics
Dolphin Research's Viewpoint
Compared to Google's performance, where revenue strength justified increased capital expenditures, investor sentiment and feedback are markedly different. The key issue is that Meta has not yet proven it can 'get what it pays for' with its investments:
While AI has undoubtedly contributed to the rapid growth of advertising (e.g., improved algorithmic recommendations, AI-generated content/features increasing user engagement), the advertising business itself is also driving significant growth. Moreover, advertising remains Meta's core business, and given its already substantial market share, its growth potential is limited. In contrast, Google's cloud business, driven by both 'market share expansion + industry rebound,' offers tremendous growth potential.
In short, AI is currently a passive defensive cost item for Meta. Accelerating pure AI monetization is one way Meta could gain investor approval for its high investments, but the smoothest path for AI commercialization currently lies in ToB productivity scenarios. Pure ToC monetization methods, whether through subscriptions or advertising, are not yet mature in terms of user penetration and remain unprofitable.
Therefore, in the short term, with the difficulty of establishing a second growth curve, investors may prefer to see control and reduction in spending (though technological advancement costs cannot be cut too much). After all, at an absolute scale, a $140 billion annual Capex is a significant burden even for Meta, accounting for more than half of its annual revenue.
This dilemma will likely keep Meta's valuation multiple—currently around ~20x PE—below its historical average of ~25x PE for the rest of the year. This is why we stated at the beginning of the year that for Meta, 'the opportunity lies in a bottom-up recovery rather than a breakthrough during market euphoria.'
Assuming 25% revenue growth for the full year, along with an Opex guidance of $165 billion and a 15% effective tax rate, we expect operating profit to reach $85 billion in 2026, up 3% year-over-year, with after-tax operating profit at $72.3 billion. After an 8% pre-market decline, Meta's market cap stands at $1.55 trillion, corresponding to a 21x PE for this year's profits, basically in line with the short-term valuation floor mentioned above but still not reaching our ideal 'bottom-up recovery opportunity' safety zone.
Meta's vision for AI has always been long-term, aiming to be a super-intelligent assistant for ordinary people rather than just a productivity tool. Therefore, the focus is currently on DAU for Meta AI rather than monetization.
If you have a higher risk tolerance, you could also adopt a longer-term perspective and calculate based on slightly more optimistic expectations: Currently, bullish investors often overlook this year's profit pressure and directly value Meta based on 2027 performance, anticipating profit growth recovery next year.
If calculated this way, there is still some room for recovery, but it would require event-driven catalysts, such as new progress in the Muse large model or renewed expectations of interest rate cuts.
Below is a detailed analysis:
I. Slowing Guidance Growth and the Pain of Lacking a Second Curve
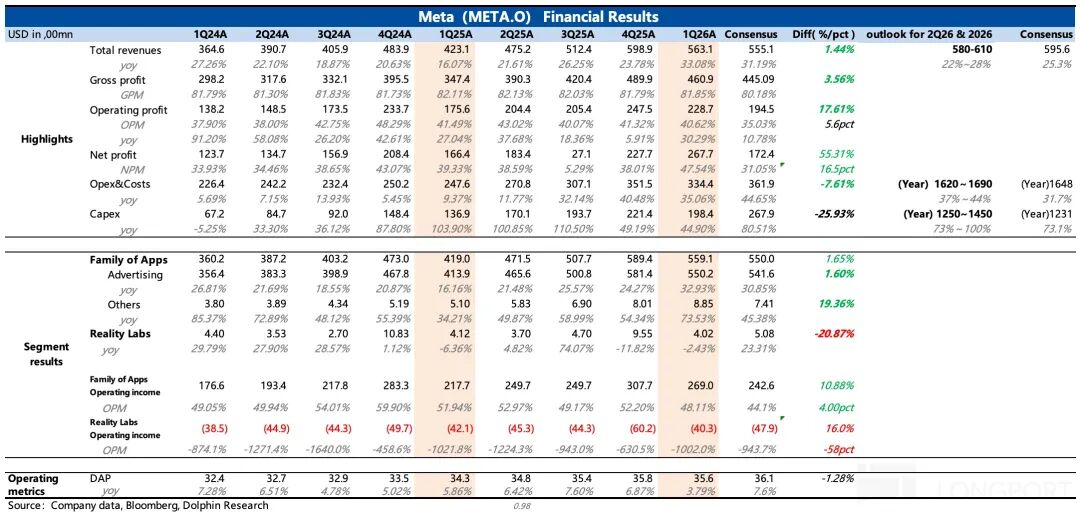
In Q1, Meta's revenue reached $56.3 billion, accelerating year-over-year to 33%, with a 4-percentage-point boost from favorable exchange rates, meeting more optimistic buy-side expectations.
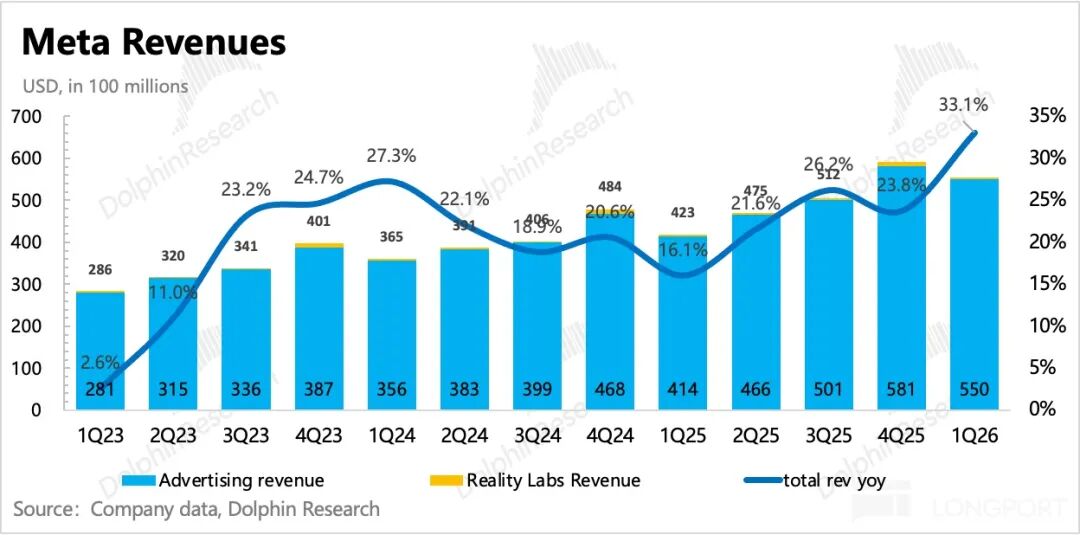
Q2 Revenue Guidance: Meta management expects total revenue for 2Q26 to be in the range of $58-61 billion, representing year-over-year growth of 22%-28%, with a 2 pct boost from exchange rates. While the guidance meets sell-side expectations, it falls short of the usual practice of exceeding expectations + the growth rate itself has slowed quarter-over-quarter, creating a less-than-positive impression.
Breaking it down by business:
1. Advertising Business: Driven by Reels and AI
For the advertising business, Dolphin Research prefers to analyze the trends in volume and price growth to better understand the current macro environment, competition, and other issues.
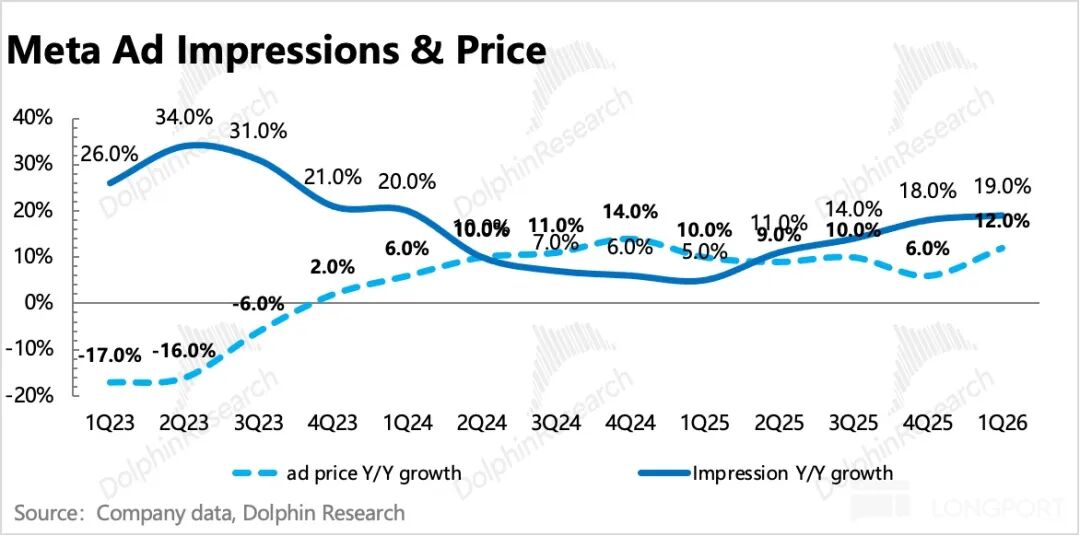
1) Ad Impressions
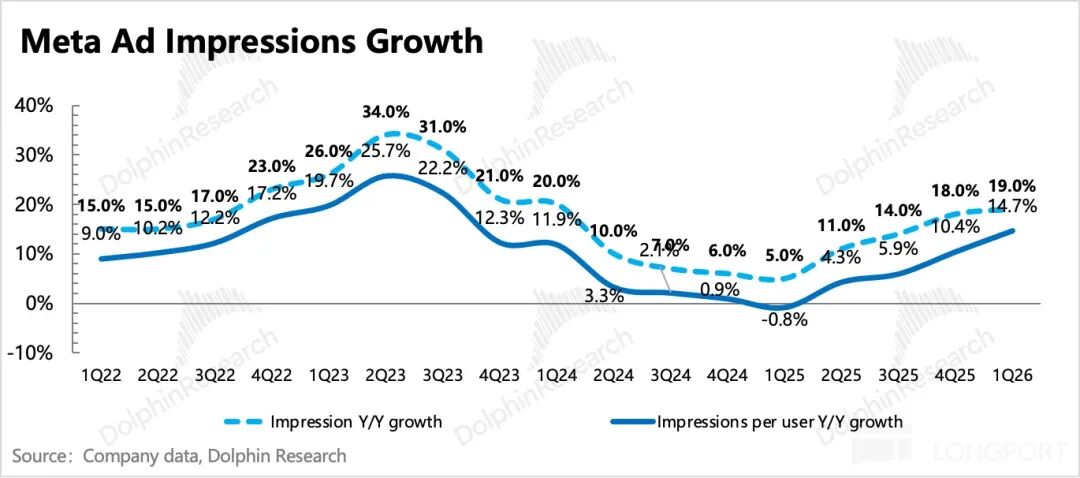
Ad impressions continued to accelerate in Q1, growing by 19%.
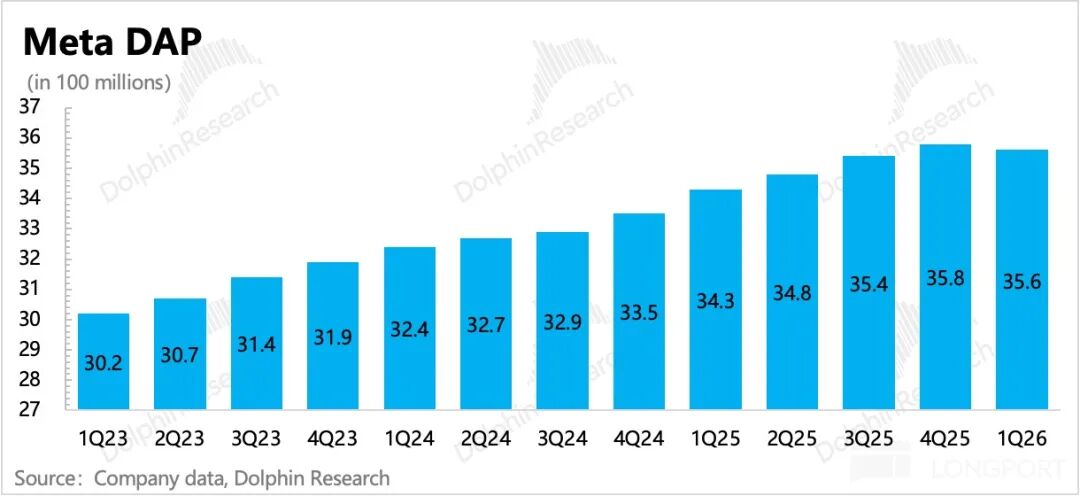
This growth comes from two main sources: First, the user base is still expanding, with DAP (Daily Active People across Meta's app suite) up 4% year-over-year, though growth has slowed and shown its first seasonal decline, indicating potential future pressure. Second, the increasing share of time spent on Reels (daily Reels content posts account for over 30%, doubling year-over-year) naturally drives higher ad impressions, with per-user impressions continuing to accelerate.
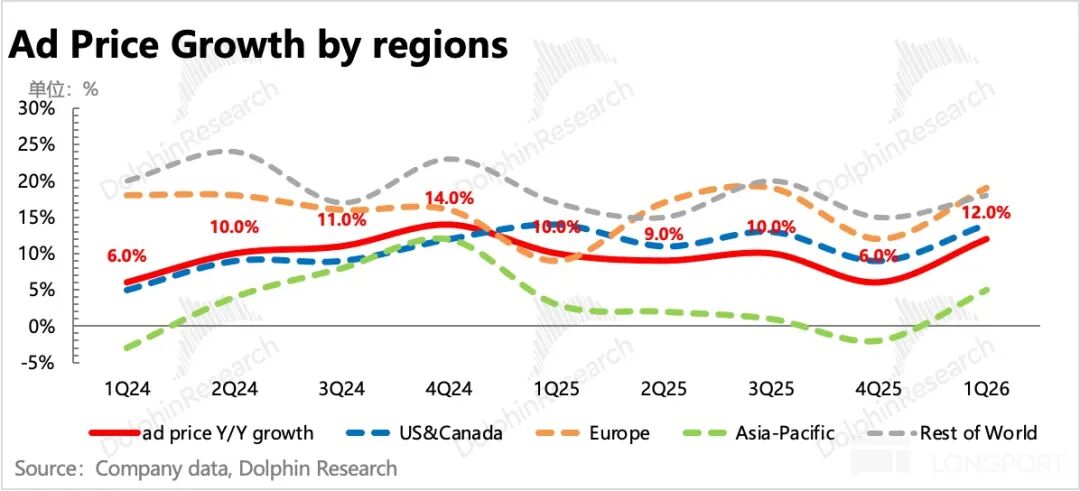
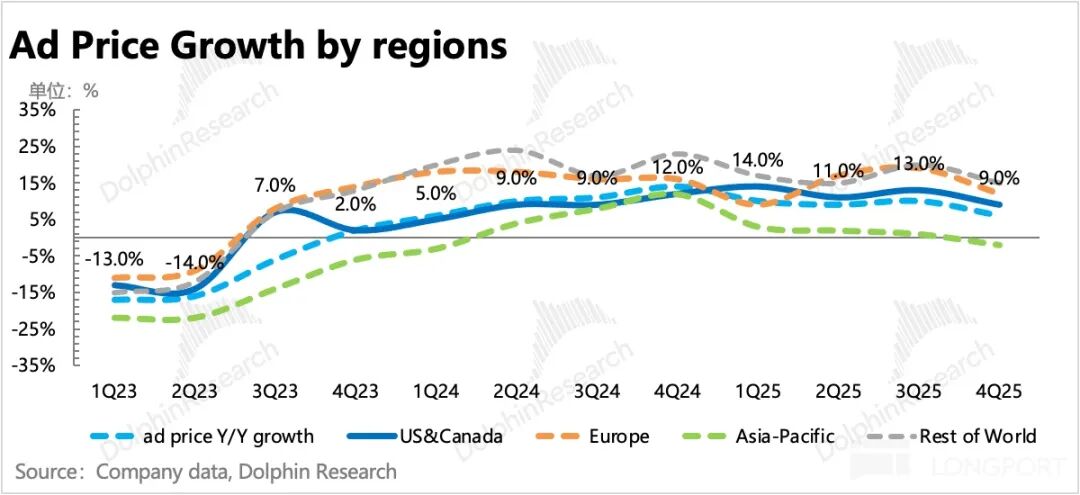
2) Ad Prices
Ad prices grew by 12% in Q1, rebounding as well.
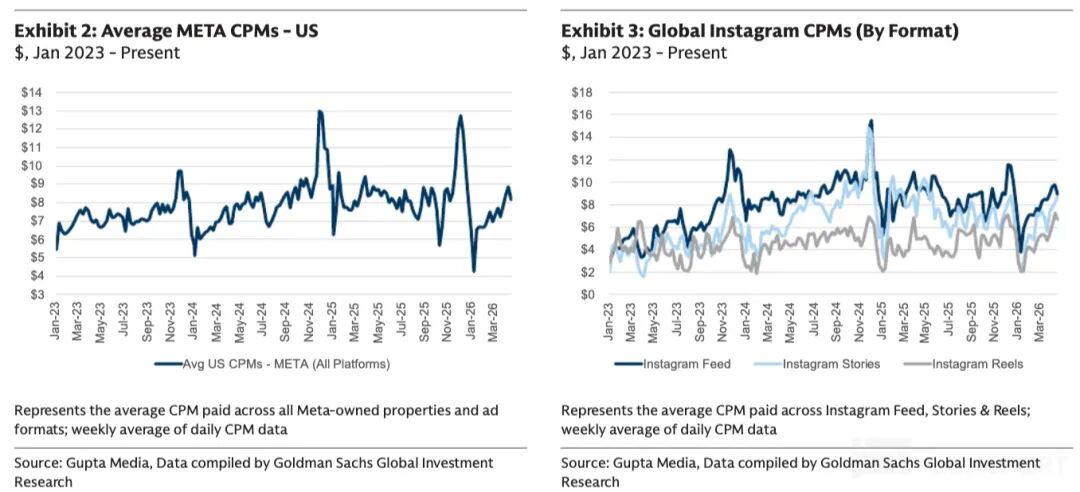
Typically, higher penetration of short-form video ads would lower overall ad prices. However, after nearly three years of evolution, Reels' eCPM (effective cost per thousand impressions) has been continuously rising. Within Instagram, the current $7 CPM for Reels has reached 80% of Feed and Story CPMs. Meanwhile, Feed and Story prices are trending downward, reflecting user preference for short-form video content and advertiser recognition of its traffic and conversion effectiveness.
Additionally, in terms of new product monetization: Threads' commercialization has expanded to more regions, and WhatsApp's Status ads are now viewed by hundreds of millions daily.
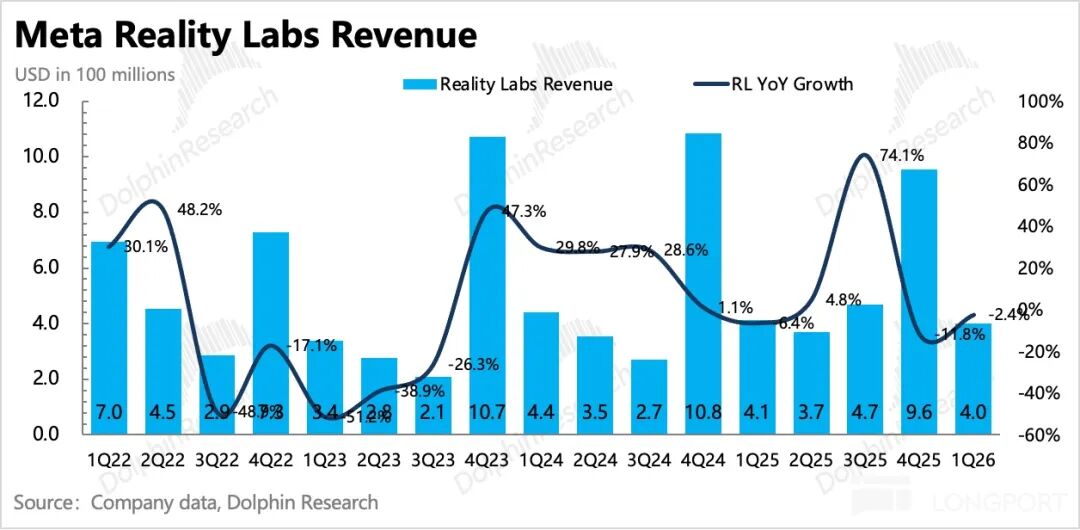
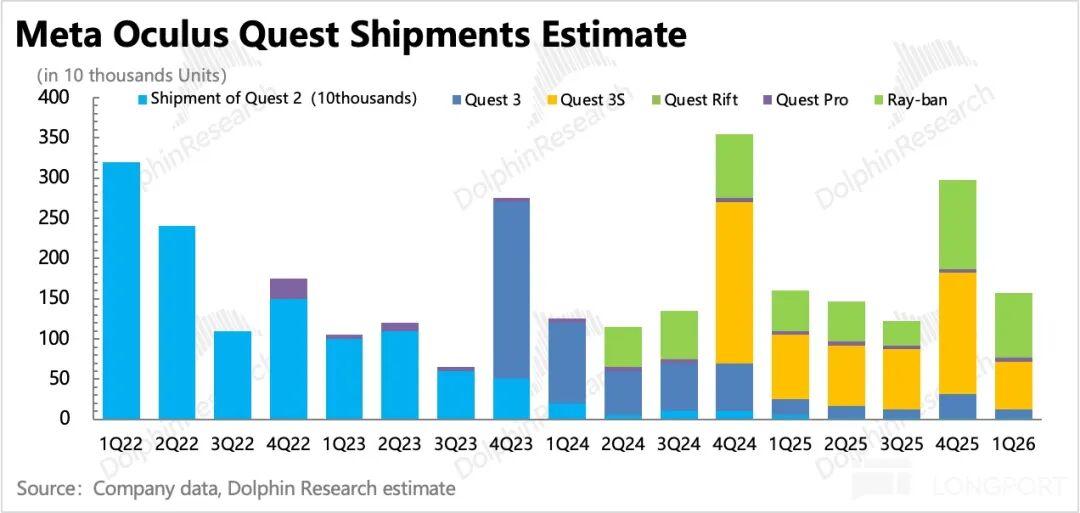
2. VR: Continuing Contraction
Q1 revenue for Reality Labs was $400 million, down 2.4% year-over-year, primarily due to declining Quest sales. AI glasses, however, saw daily active users triple year-over-year, with the Q1 launch of Ray-Ban Meta smart glasses (designed for all-day wear). Future efforts will further focus on AI glasses, with overall investment being reduced to control losses (last quarter's guidance called for a $3 billion spending cut in 2026) and to make way for AI model and application development.
II. Layoff Rumors Swirl as AI Investments Increase Instead of Decrease
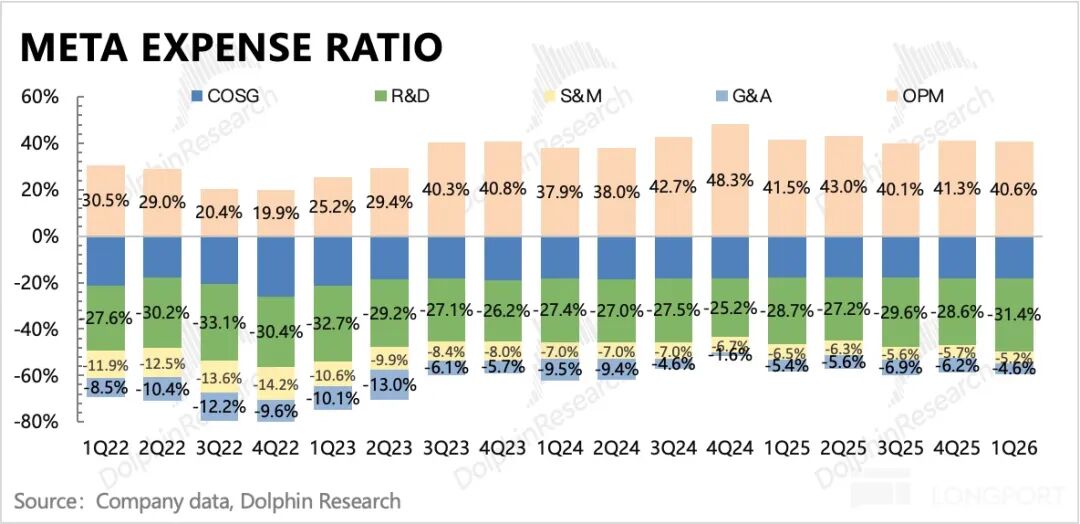
Total operating expenses grew by 35% year-over-year in Q1, slowing quarter-over-quarter, which helped maintain decent operating profit and a profit margin that only slipped slightly by 0.7 pct. However, management's full-year Opex and Capex guidance indicates that Q1 was an exception. The company has also committed to positive year-over-year operating profit growth for the full year, implying a baseline revenue growth expectation of 25%.
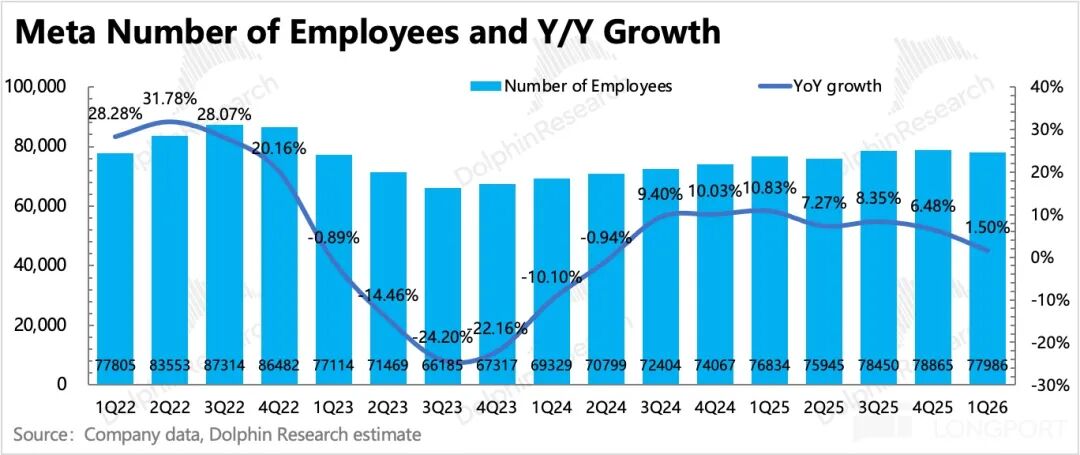
Q1 witnessed a quarter-on-quarter decrease of 879 employees, marking the beginning of a layoff cycle. According to rumors, a 20% reduction, equivalent to 15,000 people, is expected this year. However, despite the massive layoffs, the company has not lowered its full-year Opex guidance and has even increased Capex, which has been a point of disappointment for investors.
Specifically, R&D expenses increased by 46%, administrative expenses by 15%, and sales expenses by a modest 5%. Ultimately, the strong revenue growth of 33% largely offset the overall 35% expansion in operating expenses.
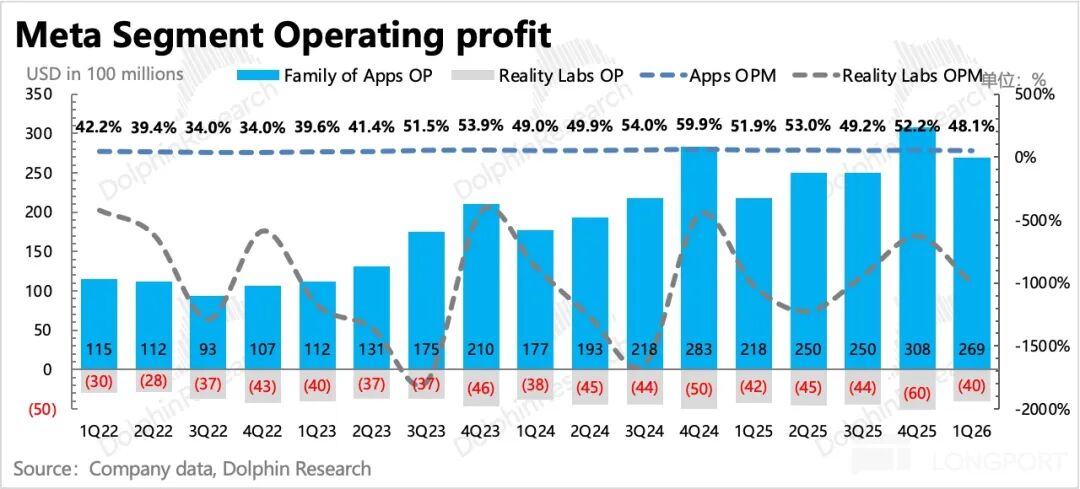
In terms of operating profit by business segment, the loss rate for RL fluctuated downward, while the profit margin for the core advertising business weakened by nearly 4 percentage points year-on-year.
Capital expenditures reached 19.8 billion in the first quarter, a decrease of over 2 billion from the previous quarter. However, the full-year 2026 capital expenditure guidance has been raised by 10 billion, from the range of 115-135 billion to 125-145 billion, indicating that the first quarter's situation was only temporary and that subsequent investments will remain substantial.
- END -
// Reposting Policy
This article is an original piece from Dolphin Research. Reposting requires authorization.
// Disclaimer and General Disclosure
This report is intended solely for general comprehensive data purposes, designed for general reading and data reference by users of Dolphin Research and its affiliated institutions. It does not take into account the specific investment objectives, investment product preferences, risk tolerance, financial situation, or particular needs of any individual receiving this report. Investors must consult with independent professional advisors before making investment decisions based on this report. Any person making investment decisions using or referring to the content or information mentioned in this report does so at their own risk. Dolphin Research shall not be liable for any direct or indirect responsibilities or losses that may arise from the use of the data contained in this report. The information and data in this report are based on publicly available sources and are provided for reference purposes only. Dolphin Research strives to ensure, but does not guarantee, the reliability, accuracy, and completeness of the relevant information and data.
The information or opinions mentioned in this report shall not, under any jurisdiction, be considered or construed as an offer to sell securities or an invitation to buy or sell securities, nor shall they constitute recommendations, solicitations, or endorsements of relevant securities or related financial instruments. The information, tools, and data contained in this report are not intended for, nor intended to be distributed to, jurisdictions where such distribution, publication, provision, or use of the information, tools, and data would contravene applicable laws or regulations, or would result in Dolphin Research and/or its subsidiaries or affiliated companies being subject to any registration or licensing requirements in such jurisdictions, or to citizens or residents of such jurisdictions.
This report merely reflects the personal views, insights, and analytical methods of the relevant creators and does not represent the stance of Dolphin Research and/or its affiliated institutions.
This report is produced by Dolphin Research, and the copyright is solely owned by Dolphin Research. Without the prior written consent of Dolphin Research, no institution or individual may (i) produce, copy, duplicate, reproduce, forward, or create any form of copies or reproductions in any manner, and/or (ii) directly or indirectly redistribute or transfer them to other unauthorized persons. Dolphin Research reserves all relevant rights.
-
![]()
Tesla Restructures Its Balance Sheet
-
![]()
Accelerating the High-Speed Interconnection Upgrade of AI Computing Clusters! JONHON Releases ELSFP External Light Source Optical Connectors
-
![]()
Breaking the overseas blockade of volumetric holographic materials, this optical enterprise secures nearly 100 million yuan in financing!
-
![]()
Why Does Jensen Huang So Openly Praise China’s AI?
-
![]()
"Wudang" Unveiled: Arm China's Next-Gen AI VPU Redefines Video Encoding
-
![]()
From Energy Conservation and Carbon Reduction to AI Decision-Making: GECON East Intelligence and Chery Group Explore a New Green and Smart Paradigm for Automobile Manufacturing
-
![]()
WAIC 2026 Observation | AI Accelerates Towards the Core of Industries, Industrial AI Enters a Critical Phase
-
![]()
Volkswagen China Fires the First Shot in Foreign-Funded 'White Box Delivery'!