Oracle's Plunge? The Irreparable Flaws Beyond AI Infrastructure - 'High Interest, High Debt + Failing Software'
 06/11 2026
 529
529
Oracle, the most closely watched and controversial player in the new cloud landscape, released its Q4 FY26 results (ending May) after the U.S. market closed on June 11. Overall, the results were a mixed bag. For example, while OCI business accelerated, traditional pan-software growth weakened; gross margins improved sequentially from a trough but remained significantly below expectations; next quarter's guidance was better than expected, but full-year FY27 guidance was relatively conservative. Thus, the quarter's overall performance was relatively lackluster, with specifics as follows:
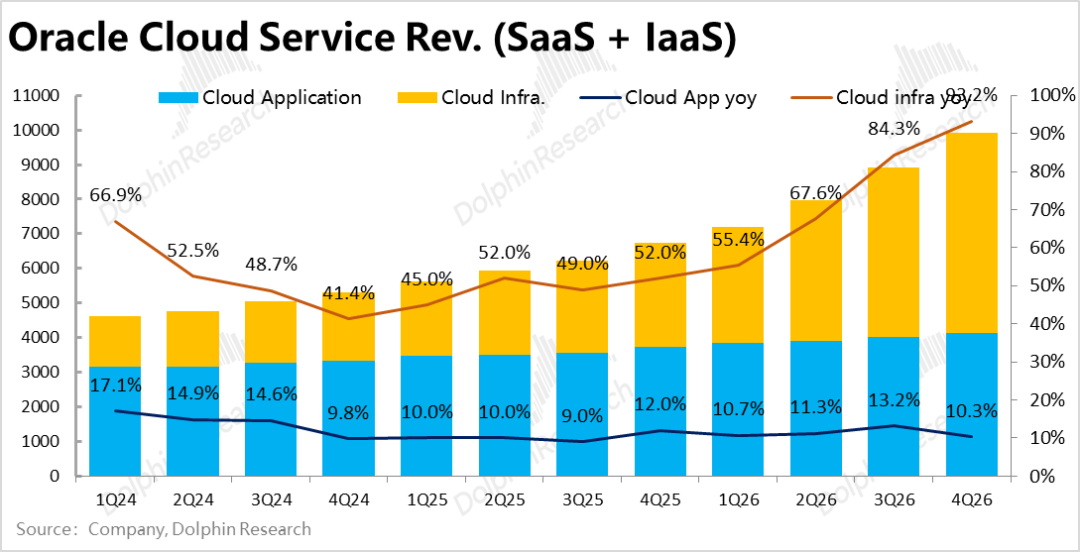
1. Core Business - OCI Accelerates as Expected: Under the cloud segment, IaaS-based OCI revenue reached nearly $5.8 billion this quarter, up ~93% YoY. After adjusting for FX benefits, the actual growth rate was 92%, continuing to accelerate from last quarter's 81%, though the pace of acceleration slowed. Moreover, the actual growth rate was largely in line with expectations, offering no surprises.
In other words, while absolute growth remains strong, from a relative perspective, OCI's performance this quarter was not considered 'good.'
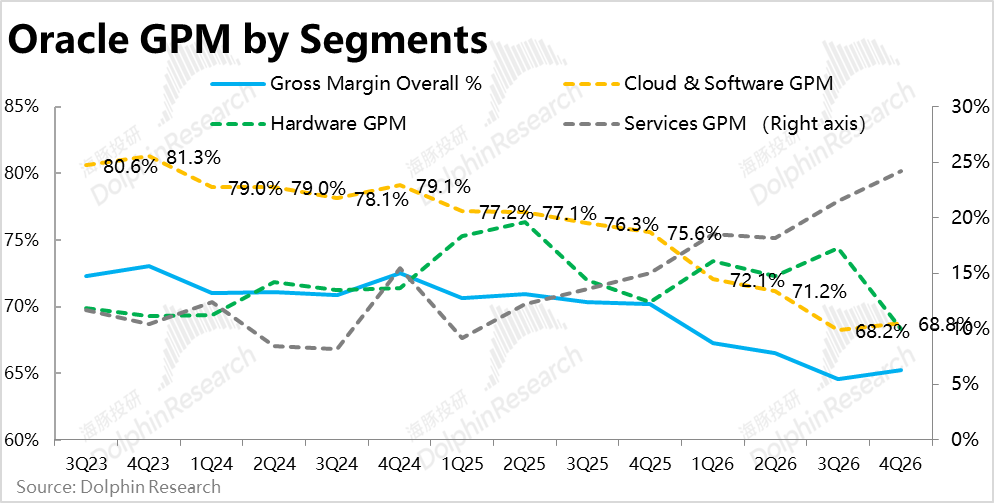
2. Gross Margin Rebounds Sequentially but Still Misses Expectations: The combined gross margin for cloud + software businesses was 68.8% this quarter, showing signs of rebounding from last quarter's 68.2%. Although the YoY decline still reached 6.8 percentage points, it narrowed from last quarter.
However, this includes multiple businesses such as OCI, SaaS, and traditional software, making it impossible to directly determine whether the improvement was due to OCI's gross margin stabilizing or an increase in pan-software margins.
From an expectations gap perspective, the market expected an overall gross margin above 66%, but the actual figure was 65.2%, still below expectations. Thus, gross profit performance this quarter remained slightly negative overall.
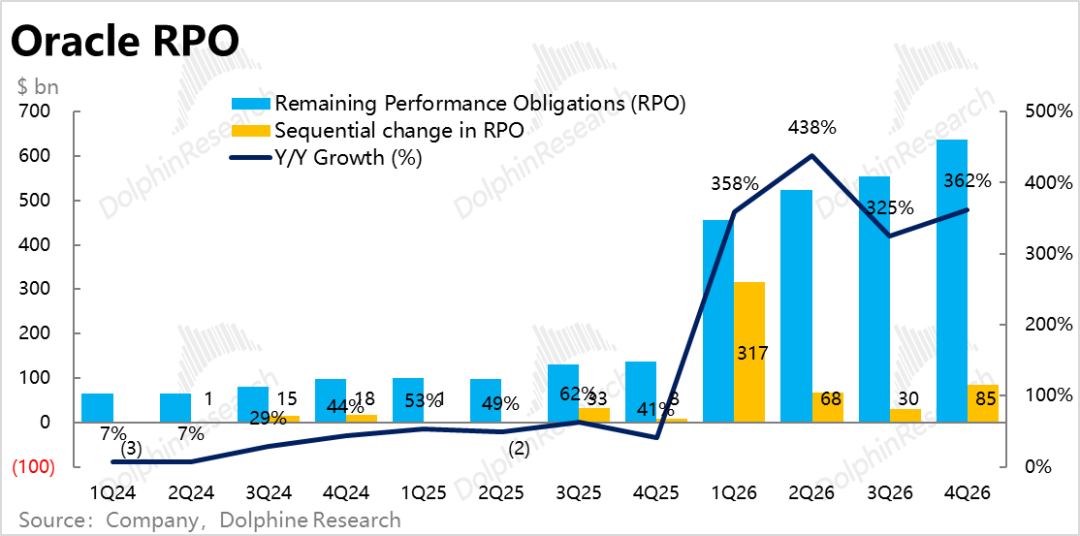
3. RPO New Orders Exceed Expectations, Capex Cost-Sharing Model Implemented: The remaining performance obligation (RPO), reflecting new order demand, reached $638 billion after a sequential increase of $85 billion. Given no rumors or reports of major new contracts before the results, market expectations were low at around $590 billion. Combined with recent news, this likely stems from newly announced government contracts.
Additionally, the company noted that approximately $75 billion in orders are now based on a Capex cost-sharing model—where customers cover part of the Capex requirements through prepayments or self-procured hardware. This is positive news for the company's cash flow and balance sheet structure.
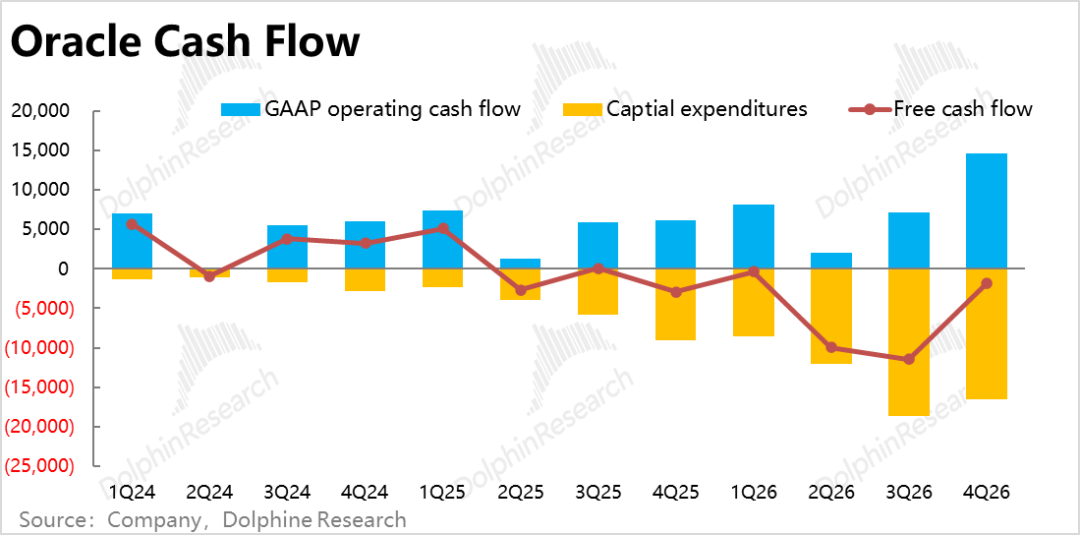
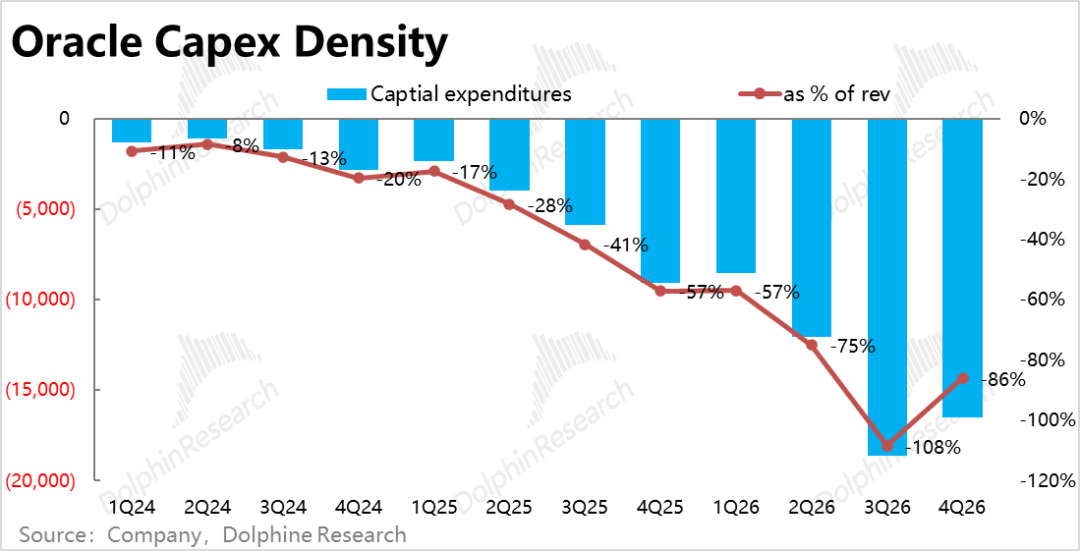
4. Capex Exceeds Expectations, but Cash Flow Improves Significantly: Correspondingly, Capex reached nearly $16.5 billion this quarter, down from $18.6 billion last quarter. Market expectations of $11 billion were mechanically derived from the full-year $50 billion Capex guidance and appeared to significantly exceed forecasts, but their reference value is limited.
More notably, the cost-sharing model covered approximately $4.6 billion in Capex spending this quarter. As a result, the company's free cash flow improved from outflows of $10 billion per quarter previously to a net outflow of $1.9 billion this quarter, indeed alleviating cash flow pressure.
5. Reduced Financing Needs?: The company stated it would conduct $20 billion in debt and $20 billion in equity financing (both previously disclosed) in FY27, totaling $40 billion—less than this fiscal year's approximately $48 billion. This locks in funding sources for most Capex investments next fiscal year.
Moreover, Dolphin Research and the market generally expected a free cash flow gap exceeding $50 billion in FY27, but we believe this is likely because some funding needs are now shared with customers, reducing the company's own financing requirements.
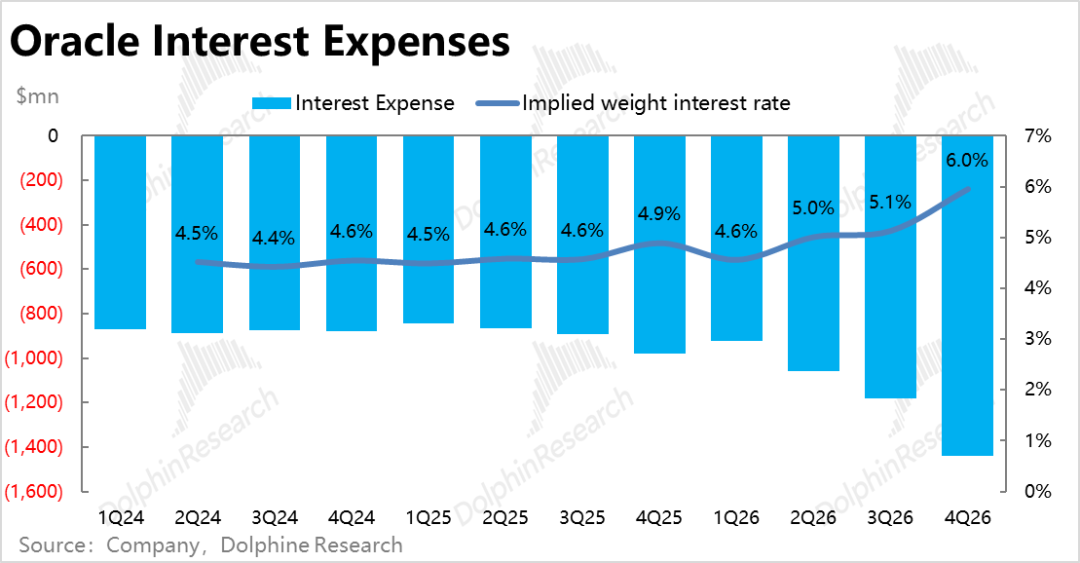
However, long-term fundamentals remain positive, though current pressures persist. Actual interest expenses reached $1.44 billion this quarter, up nearly 22% sequentially, with interest expenses accounting for 6% of total revenue.
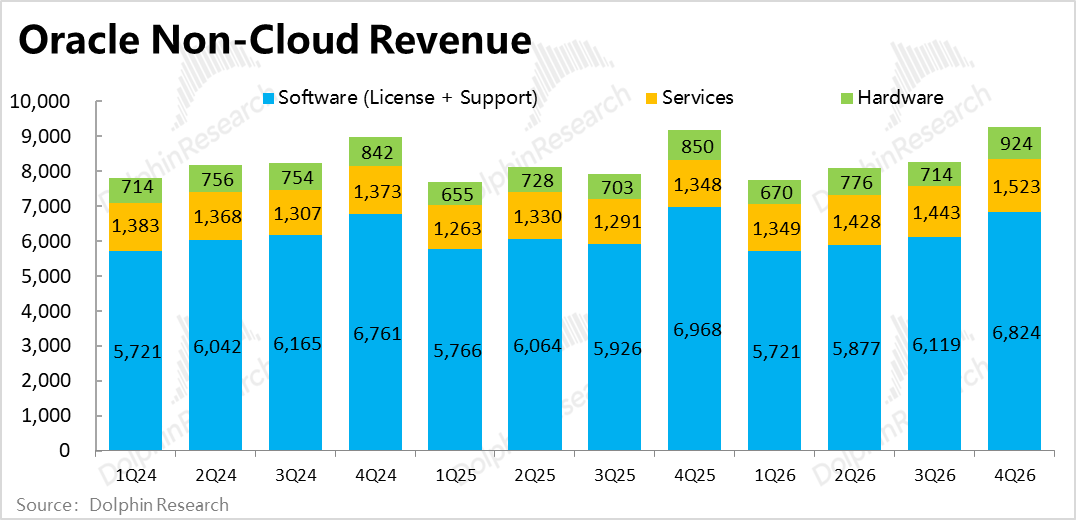
6. Other Businesses Weaken Further: Traditional segments, still accounting for ~75% of total revenue, continued to deteriorate. SaaS and software revenue grew +10% and -2% YoY, respectively, with growth rates slowing and missing market expectations. Although hardware and services revenue growth significantly exceeded expectations, these businesses combined account for just over 10% of total revenue, limiting their impact.
7. Overall Performance
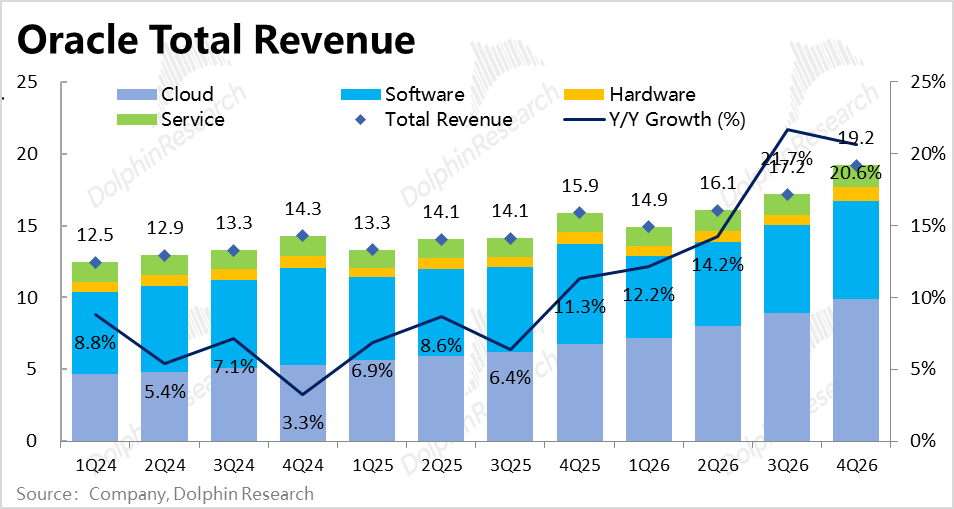
The company's total revenue grew 20.6% this quarter, or 20% after adjusting for FX impacts—a slight acceleration of 2 percentage points from last quarter.
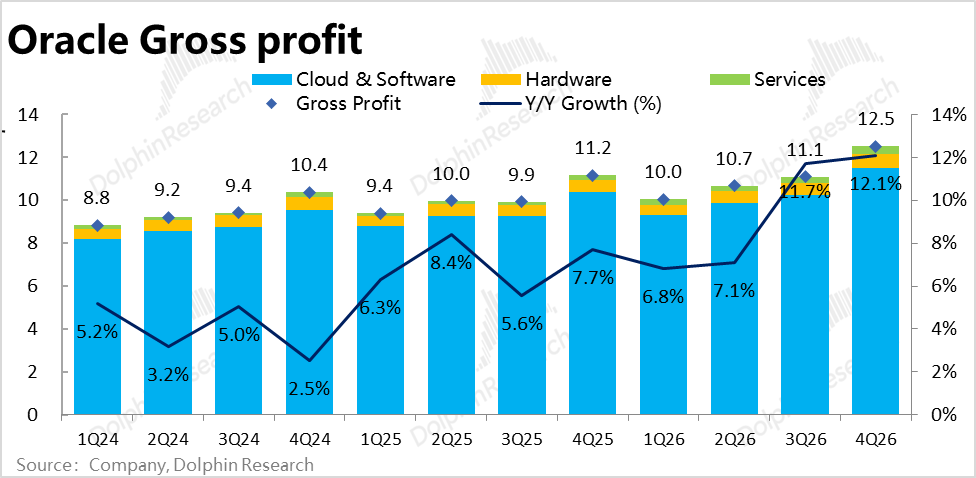
Due to the aforementioned significant YoY decline in gross margins, total gross profit grew 12% YoY, still significantly below revenue growth and slightly below market expectations.
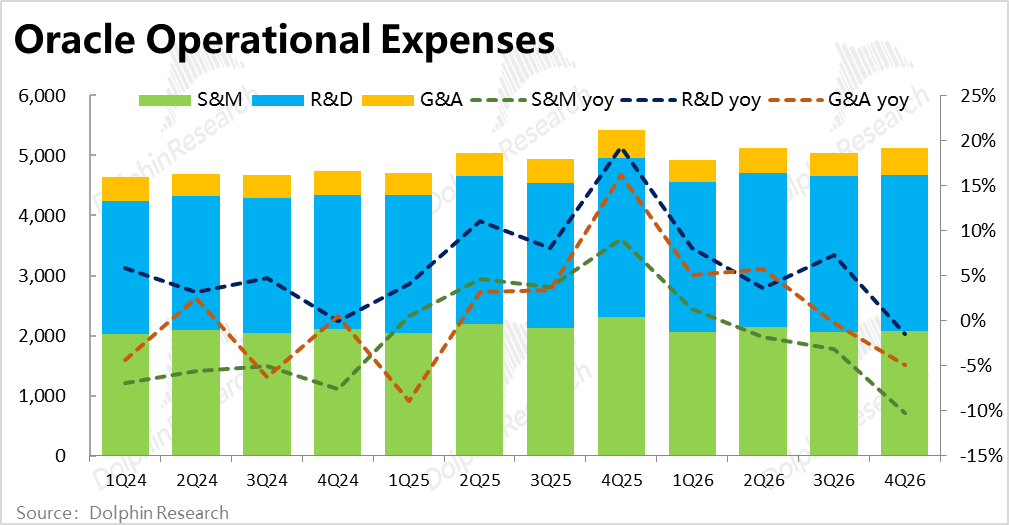
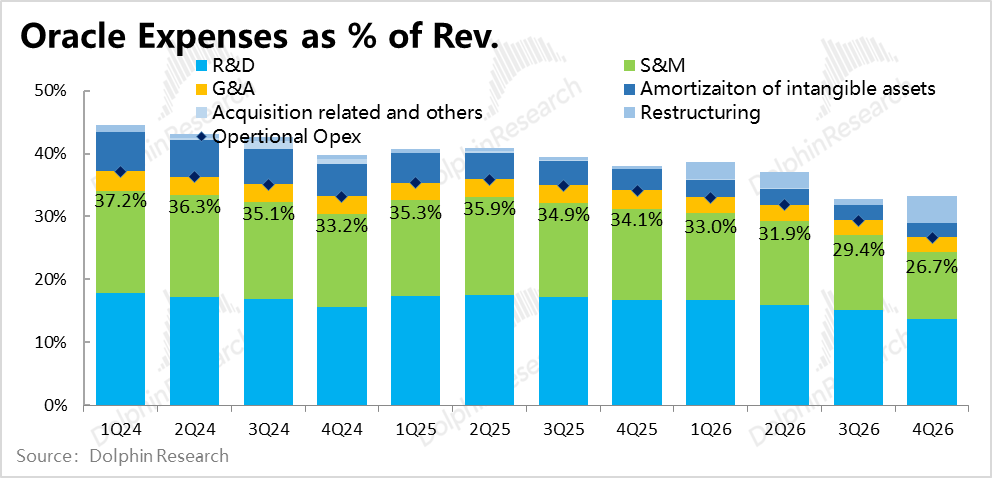
Fortunately, excluding one-time restructuring costs, operating expenses fell ~5.6% YoY this quarter—7 percentage points below market expectations. Under strict cost control, despite significant margin declines, adjusted operating margins stabilized YoY, returning to positive growth of ~0.5 percentage points, better than expected.
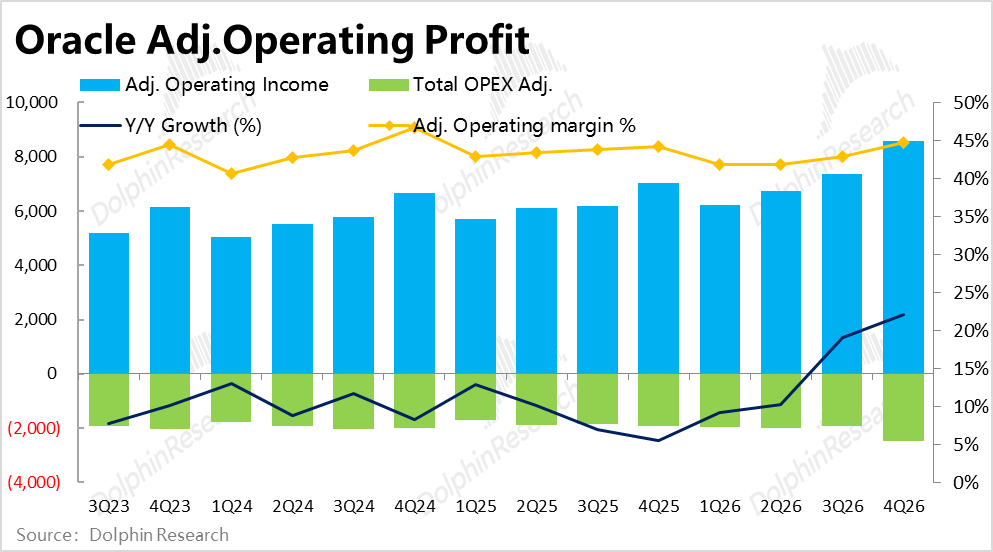
Ultimately, adjusted operating profit reached $8.6 billion, up ~22% YoY. Despite gross profit missing expectations and revenue, profit growth outpaced both revenue and expectations.

Dolphin Research View:
1. Currently, the market's key focuses on Oracle's short-to-medium-term performance remain: a. The pace and acceleration of OCI revenue growth, reflecting the speed and rhythm of AI infrastructure buildout. In contrast, recent attention on newly signed orders (RPO) is low; b. Whether the issue of AI business revenue scaling up but dragging down profitability has improved; c. Capex investment and ramp-up pace, along with financing acquisition.
However, attitudes have shifted from previously negative (disliking high Capex, fearing ROI) to more positive (high Capex signals rapid AI infrastructure progress).
Regarding these focuses, this quarter's results show:
a. OCI did accelerate as expected, but the pace matched forecasts precisely, offering no standout performance. Meanwhile, while OCI benefits from AI, the larger traditional pan-software business is logically an AI 'victim.' Thus, Oracle is not a pure 'AI beneficiary.'
b. Gross margins did show signs of bottoming, but causation remains unclear temporarily, and they still missed market expectations. More quarters are needed to determine if the margin trough is temporary or a true inflection point.
With Amazon and Google's cloud margins not significantly declining in recent quarters, the market's widely accepted 'underlying assumption'—that AI cloud margins are markedly lower than traditional cloud margins—is now debatable. However, for NeoCloud players like Oracle, higher AI business mix and lower margins are more pronounced. Oracle's results make this issue worth further exploration.
c. The most positive signal this quarter is the company's adoption of a Capex cost-sharing model with customers, which, from a long-term perspective, significantly reduces the pressure and risks of funding massive Capex investments and AI infrastructure buildout for downstream AI clients using its own cash flow and balance sheet.
Dolphin Research views this as a major strategic shift. However, in the short-to-medium term, the company's net debt and interest expenses will likely continue rising, necessitating attention to how much Capex can be shared with customers going forward.
2. From an investment perspective, as noted in our last review, after successfully completing $50 billion in equity + debt financing, concerns about the company's ability to secure funds for continued large-scale AI infrastructure buildout have eased. Additionally, with surging token/compute consumption driven by AI agents, market fears of overbuilding AI capacity without sufficient end-user demand have also diminished.
With these two issues improving, Oracle's investment thesis has partially reversed. Its stock price has rebounded over 40% from early April lows, while recent macro risks and market volatility have resurfaced. Thus, pre-results investment banks generally believed expectations for this quarter's performance would be high.
Indeed, the mixed results likely disappointed funds with high expectations.
For guidance, the company expects cloud segment (including IaaS + SaaS combined) growth to accelerate to a midpoint of 60% next quarter, slightly exceeding market expectations of 57%. Next quarter's Non-GAAP EPS guidance midpoint is $1.74, implying 18% YoY growth—also slightly above market expectations by ~3%.
However, while next quarter's guidance is solid, the company maintained its FY27 revenue guidance at $90 billion and updated its full-year Non-GAAP EPS to $8.05, merely in line with current market expectations. The full-year guidance is uninspiring, preventing the market from overly rewarding the strong next-quarter outlook.
Dolphin Research speculates this may reflect the company's own lack of clarity on full-year performance, leading it to align with market expectations for now.
Recent developments: Since its last earnings report, Oracle has remained relatively 'low-key,' with no major new announcements/news, but two notable trends persist:
a. Integrating AI into software: While quiet on the IaaS front, Oracle has rolled out AI capabilities in its SaaS and database businesses, launching Fusion Agent Application and Agentic AI for Database.
Dolphin Research sees this as a defensive move. As of FY26, OCI—the business directly benefiting from AI—accounts for just ~25% of revenue, with the remainder from software, SaaS, and databases, which are seen as potential AI 'victims.' However, as Salesforce's example shows, integrating AI into traditional businesses offers limited upside. Whether this helps maintain or accelerate traditional business growth requires cautious observation.
b. Pursuing government partnerships: In late March and early May, Oracle announced contracts with U.S. federal agencies and the Department of War, offering services including OCI, AI Database, and Enterprise AI. Before results, the market viewed government deals as having limited impact compared to enterprise orders worth hundreds of billions. However, government orders may now contribute tens of billions in actual revenue. Moreover, their significance may lie less in direct revenue and more in signaling government support, boosting market sentiment.
3. Valuation analysis can be viewed from two perspectives: short-to-medium-term valuations fluctuating with quarterly performance, and long-term valuations based on steady-state prospects, which remain largely unchanged unless there are major strategic shifts or adjustments to long-term guidance.
In the short term, the market typically prices Oracle based on its FY27 Non-GAAP EPS. In other words, the company can already be supported by near-term visible performance, offering upside potential from earnings/profit upgrades even without valuation adjustments.
However, Dolphin Research prefers a long-term steady-state valuation approach. After rebounding significantly from trough levels, current valuations neutrally reflect the company's guided mid-to-long-term performance. Thus, the post-results stock decline is reasonable given the lackluster results.
That said, valuation multiples remain undemanding, and the reduced cash flow needs and financing/debt pressures signaled this quarter may fundamentally improve Oracle's narrative. Barring systemic AI issues, Dolphin Research believes Oracle, while not a top priority, warrants attention at current levels.
Detailed Analysis Below
I. Oracle's Business & Revenue Segmentation
As a software industry veteran founded in the 1980s, Oracle's historical core businesses were databases and software services (traditional license model). However, in recent years, its cloud transition efforts and the AI boom have propelled cloud services to the forefront, becoming its most critical and closely watched segment.
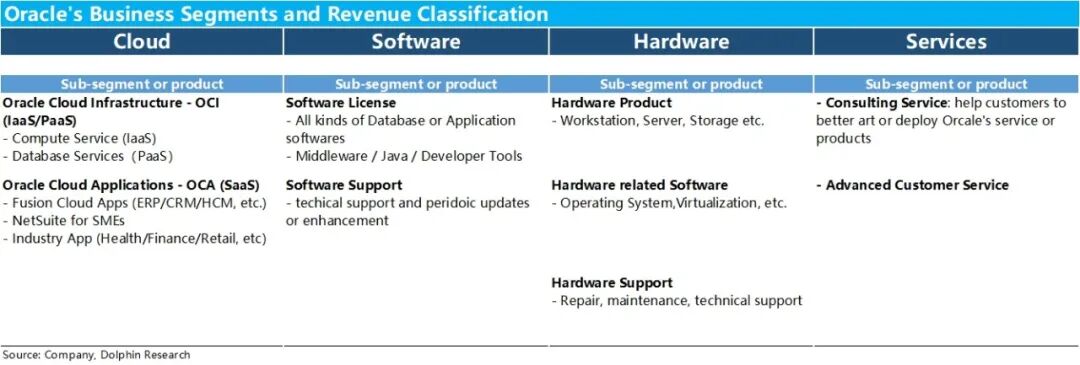
In FY26, Oracle restructured its financial reporting, dividing businesses and revenue into four clearer segments: Cloud, Software, Hardware, and Services. Further breakdown:
a. Cloud: Comprises IaaS-based OCI and SaaS-based OCA lines. OCA includes SaaS-ified ERP/CRM and other general management tools, plus vertical industry tools. OCI focuses on Oracle's signature database services and compute lease .
Historically, OCA dominated the cloud segment, but OCI's share has surpassed OCA in the past 1-2 years amid rapid growth.
b. Software: Traditional on-premise software deployed and managed by customers, once Oracle's largest revenue segment but now surpassed by cloud. It has two main parts: one-time software license sales and recurring support services (e.g., usage support and updates).
c. Hardware: Similar to software, includes one-time server hardware sales and recurring maintenance/support revenue, accounting for the smallest share.
d. Services: Other service businesses beyond hardware/software, including consulting or custom services, accounting for high single-digit percentage revenue in recent years.
II. Core Focus: OCI Performance
1. Key Business - OCI Continues to Accelerate as Expected
The critical IaaS/PaaS OCI business generated nearly $5.8 billion in revenue this quarter, up ~93% YoY. After adjusting for FX benefits, actual growth was 92%, continuing to accelerate from last quarter's 81%—though the pace slowed slightly (16pct last quarter vs. 11pct this quarter).
Market consensus expectations were also ~92%, so while OCI continues to accelerate, it offers no upside surprise. In contrast, SaaS growth under the cloud segment deteriorated, with actual revenue declining 3% YoY after FX adjustment—worsening from last quarter's 1% drop. This highlights that while AI benefits upstream infrastructure, Oracle's downstream SaaS faces significant growth pressure.
2. Gross profit margin remains under pressure, but is there a sign of bottoming out?
It is widely accepted in the market that the revenue growth of AI businesses will be accompanied by a decline in gross profit margins, especially for new cloud companies like Oracle. The combined gross profit margin for the cloud + software business was 68.8% this quarter, showing signs of rebounding from the bottom compared to last quarter's 68.2%. Although the year-over-year decline is still as high as 6.8 percentage points, it has narrowed compared to last quarter.
However, since it includes both cloud and software businesses, it is not easy to determine whether the rebound in gross profit margin is due to the stabilization of OCI's gross profit margin or improvements in the gross profit margins of other businesses. From an expectations gap perspective, the market expected an overall gross profit margin of over 66%, but the actual figure was only 65.2%. Therefore, overall, the gross profit performance this quarter is still negative and has not fundamentally reversed market concerns about profit margins.
3. Leading indicator – RPO exceeds expectations with growth, has the Capex sharing model become mainstream?
Since there were no rumors before the earnings announcement about the company signing significant new deals, the market's expectations and focus on RPO this quarter were not high, only 590 billion, with a slight quarter-over-quarter increase of less than 40 billion. However, after an actual increase of 85 billion, the total RPO reached 638 billion, making it one of the few bright spots this quarter.
The company still did not disclose the specifics of the new orders, but since it just announced collaborations with the U.S. federal government and the Department of War, it is speculated that the unexpectedly high volume of new orders may have come from the government.
Additionally, it is worth noting that last quarter, the company mentioned that some orders' Capex investments would be partially covered by customer prepayments or self-purchased hardware. This quarter, the company announced that approximately 75 billion worth of orders are currently based on this Capex sharing model.
Considering that most of these orders were likely signed in the last two quarters, it implies that more than half of the recent new orders may have adopted this Capex sharing model. This is a positive signal for the company's own cash flow and balance sheet structure.
III. Recent balance sheet continues to deteriorate, but are there positive signals for the medium to long term?
With the continued acceleration of the company's OCI revenue growth, Capex this quarter was nearly 16.5 billion, a decline from last quarter's 18.6 billion. However, since the market, based on the previous earnings report, expected the company to maintain its full-year Capex guidance of 50 billion without raising it, they "mechanically" deduced that this quarter's expenditure would only be around 11 billion, making the actual expenditure significantly higher than expected. However, given the accelerated capacity deployment, it is more accurate to say that expectations were too low rather than actual Capex being too high.
Additionally, according to the company's disclosure, the Capex sharing model mentioned earlier covered approximately 4.6 billion in Capex expenditures this quarter. As a result, the company's free cash flow has improved from an outflow of 10 billion per quarter previously to a net outflow of 1.9 billion this quarter, clearly reflecting a reduction in the company's cash flow pressure.
To support large capital expenditures, the company stated that it has completed 43 billion in bond financing and 5 billion in equity financing in FY26, and will conduct 20 billion each, totaling 40 billion in debt and equity financing in the new FY27 (both previously disclosed), securing funding sources for most of the Capex investments in the next fiscal year.
In fact, this financing target is lower than the free cash flow gap originally expected by Dolphin Research and the market (over 50 billion). Dolphin Research believes that it is likely because some funding needs have been borne by customers themselves, reducing the company's own debt burden, which is also a positive signal from a long-term perspective.
However, these positives are not yet apparent, as actual interest expenses reached 1.44 billion this quarter, showing a significant increase of nearly 22% quarter-over-quarter, and the proportion of interest expenses to total revenue further increased to 6%. Based on the balance sheet, the company's net interest-bearing debt also increased by more than 16 billion year-over-year.
Currently, from a medium to short-term perspective, the company's balance sheet and debt repayment pressure are still expanding.
IV. Traditional segments continue to decline
Unlike the accelerated growth of OCI business, the performance of traditional segments, which still account for about 75% of total revenue, is deteriorating. The revenue growth of the second most critical SaaS and software businesses was +10% and -2%, respectively, with growth rates slowing down and both falling short of market expectations. Although hardware and service revenue growth was significantly better than expected, these two businesses combined account for just over 10% of total revenue, making the deterioration of software and SaaS businesses the primary issue.
Therefore, although the company's OCI business at the infrastructure level benefits from the rise of AI, its larger traditional pan- software (pan-software) businesses face increasing pressure.
V. Overall performance is mixed
1. Strong infrastructure, weak software, steady overall growth
Summarizing the four major business segments, the accelerating OCI segment and the weakening software business offset each other, resulting in a 20.6% overall revenue growth for the company this quarter, which at first glance appears to be a slowdown from last quarter. However, after excluding the impact of exchange rates, the real growth rate is 20%, still a slight acceleration of 2 percentage points compared to last quarter.
2. Gross profit margin continues to decline
As mentioned earlier, the company's overall gross profit margin showed initial signs of stabilization this quarter, but it is still clearly on a downward trend year-over-year. As a result, the year-over-year growth rate of the total gross profit was 12%, still significantly lower than the revenue growth rate and slightly below market expectations by about 0.6 percentage points.
3. Good expense control helps profit growth outpace
In terms of expense spending, at first glance, overall expense spending increased by 5.4% year-over-year this quarter, a significant increase from last quarter's 1% growth and higher than market expectations of 1.7%, suggesting a rise in expense investment. However, this is because approximately 800 million in "restructuring" expenses were confirmed this quarter, likely due to the impact of previous news reports that the company would lay off nearly 30,000 employees (approximately 19% of the workforce, but the company did not confirm this directly).
Looking only at the three regular operating expenses, actual spending this quarter decreased by about 5.6% year-over-year, 7 percentage points lower than market expectations. All three expenses showed negative year-over-year growth, with marketing expenses declining by more than 10%. It is evident that despite the pressure on gross profit margins and tight cash flow due to Capex, the company's expense control efforts and results have been commendable.
Thanks to excellent expense control, although the gross profit margin declined significantly, the adjusted operating profit margin rebounded year-over-year, returning to positive growth of about 0.5 percentage points, better than market expectations.
Ultimately, the adjusted operating profit was 8.6 billion, a year-over-year increase of about 22%. Despite gross profit falling short of expectations and revenue, profit growth outpaced revenue and expectations.
- END -
// Reprint Authorization
This article is an original piece by Dolphin Research. Reprinting is only allowed with authorization.
// Disclaimer and General Disclosure
This report is for general comprehensive data purposes only, intended for general reading and data reference by users of Dolphin Research and its affiliated institutions. It does not take into account the specific investment objectives, investment product preferences, risk tolerance, financial status, or special needs of any person receiving this report. Investors must consult with independent professional advisors before making investment decisions based on this report. Any person making investment decisions using or referring to the content or information in this report must bear their own risks. Dolphin Research shall not be liable for any direct or indirect responsibilities or losses that may arise from the use of the data in this report. The information and data in this report are based on publicly available sources and are for reference purposes only. Dolphin Research strives to ensure but does not guarantee the reliability, accuracy, and completeness of the information and data.
The information or opinions expressed in this report shall not, under any jurisdiction, be construed as or deemed to be an offer to sell securities or an invitation to buy or sell securities, nor shall they constitute recommendations, inquiries, or endorsements of relevant securities or related financial instruments. The information, tools, and data in this report are not intended for or intended to be distributed to jurisdictions where the distribution, publication, provision, or use of such information, tools, and data would violate applicable laws or regulations, or to citizens or residents of jurisdictions where Dolphin Research and/or its subsidiaries or affiliated companies would be required to comply with any registration or licensing requirements in that jurisdiction.
This report only reflects the personal views, insights, and analytical methods of the relevant creators and does not represent the stance of Dolphin Research and/or its affiliated institutions.
This report is produced by Dolphin Research, and the copyright is solely owned by Dolphin Research. No institution or individual may, without the prior written consent of Dolphin Research, (i) make, copy, reproduce, duplicate, forward, or distribute in any form any copies or reproductions, and/or (ii) directly or indirectly redistribute or transfer to other unauthorized persons. Dolphin Research reserves all relevant rights.
-
![]()
Honda CEO Faces Vote of No Confidence Due to Alleged Neglect of China Market
-
![]()
The Flip Side of 618: New Arrivals Steal the Spotlight as Major Sales Event Hits Midpoint
-
![]()
Wang Chuanfu's Goal of Becoming the World's No.1 Relies on a 'Production Schedule'
-
![]()
Jensen Huang: The Embodiment of a Bull Market
-
![]()
Joint Interview with Five Major E-commerce Platforms: Ending Involution for a Healthier 618 Shopping Environment
-
![]()
Does It Become More User-Friendly Over Time? The Rising Product Prowess of Hunyuan Hy3 and Tencent Yuanbao's Quiet Resurgence
-
![]()
Gross Profit Margin, Supplier Payments, and Dividends Undergo 'Abrupt Shifts': Indicators of Tianbo Intelligence's IPO Performance Manipulation", "Tianbo Intelligence, gross profit margin, financial i
-
Top Ten in May Sales Rankings Feature No Fuel Vehicles: Has China’s Auto Market Undergone a Complete Transformation?