Rivian: Weathering the Pain, Can R2 Lead Rivian to a 'Turnaround Against the Wind'?
 05/07 2026
 529
529
Rivian released its Q3 2025 earnings report after the market closed on November 5, 2025. Overall, Q3 performance was solid, rebounding from the Q2 trough. Key takeaways:
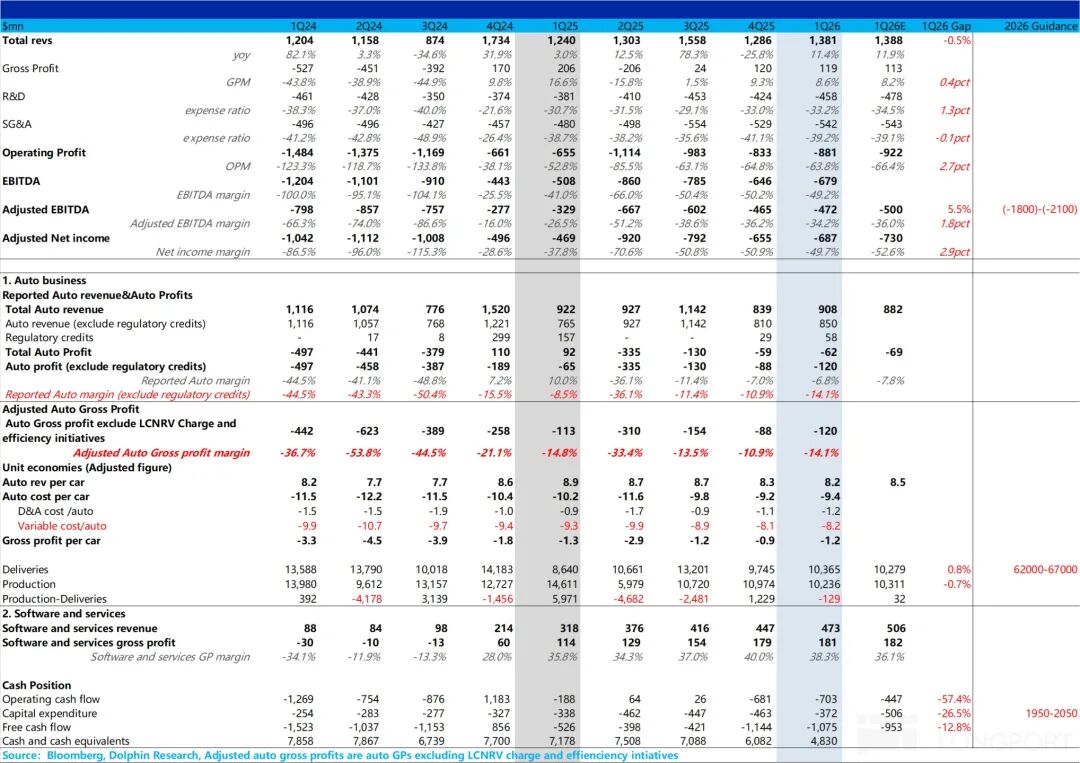
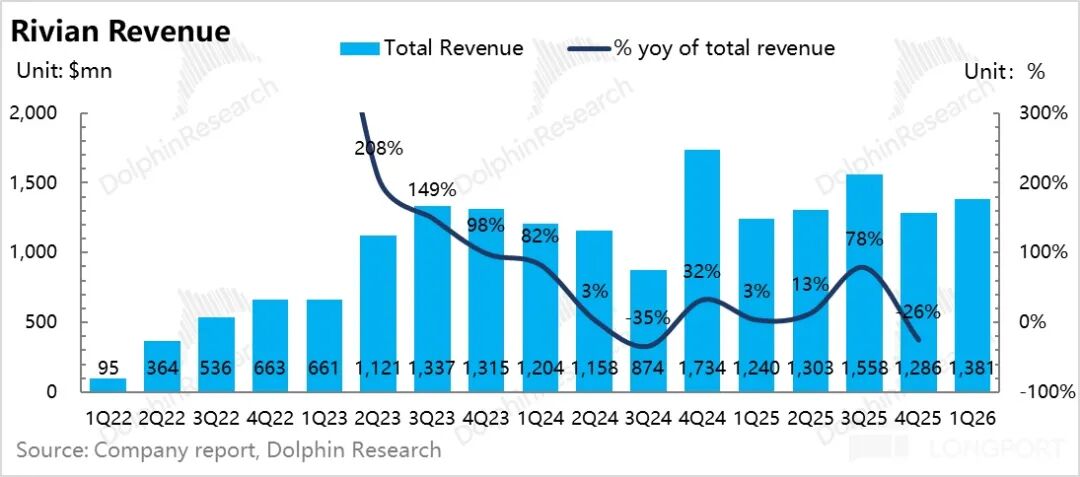
1) Revenue largely met expectations: Total revenue for the quarter was $1.38 billion, up 11.4% YoY, roughly in line with market expectations.
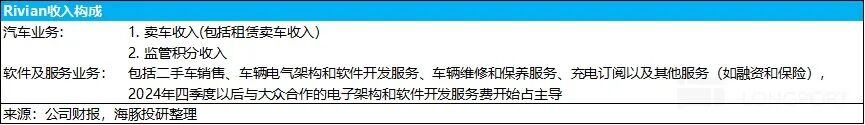
While automotive revenue (including carbon credits) was $910 million, down 1.5% YoY, primarily due to a $100 million decline in carbon credit revenue, a higher proportion of low-priced EDV vans, and increased promotional efforts for R1 models following the phase-out of IRA subsidies, leading to a nearly $7,000 YoY drop in per-unit revenue to $82,000.
However, software and services performed exceptionally well, with quarterly revenue of $473 million, up 49% YoY, driven by high-margin technology licensing revenue from the Volkswagen joint venture (Q1: $282 million, 60% of total), becoming the main driver of total revenue growth.
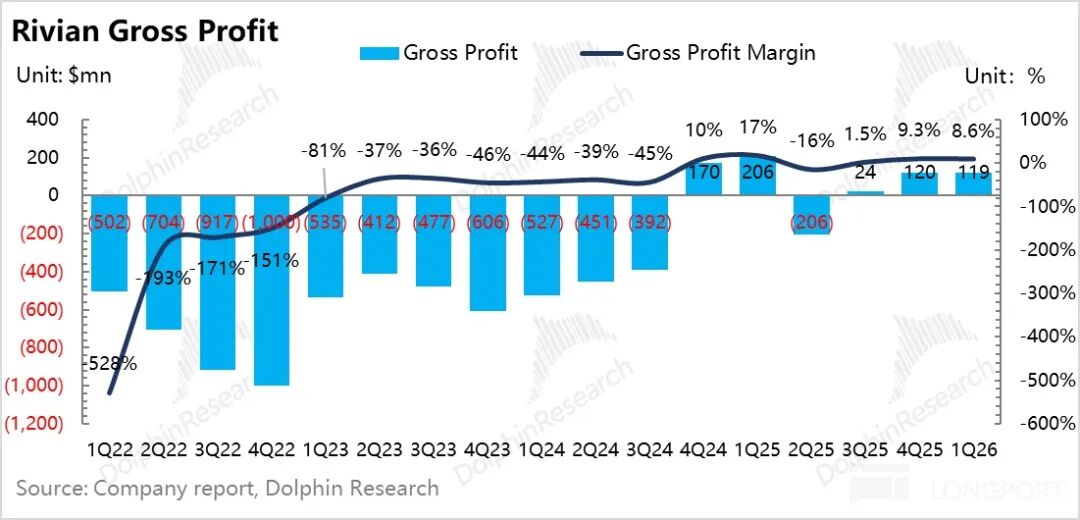
2) Gross margin slightly exceeded expectations: Overall company gross margin was 8.6%, down 0.7 percentage points QoQ but above market expectations of 8.2%. Reported automotive gross margin was -6.8%, roughly flat QoQ, mainly due to an increase in carbon credit revenue QoQ, while true automotive gross margin continued to decline QoQ. Software and services gross margin was 38.3%, down 1.7 percentage points QoQ, still supported by high-margin technology licensing revenue from the Volkswagen joint venture.
3) Automotive gross margin under QoQ pressure: After excluding one-time factors like carbon credits and inventory impairments, true automotive gross margin was -14.1% in Q1, down 3.2 percentage points QoQ, mainly due to a QoQ decline in per-unit revenue and rising per-unit depreciation and variable costs (higher raw material costs, unrecognized tariff rebates this quarter, and increased depreciation costs ahead of R2 mass production).
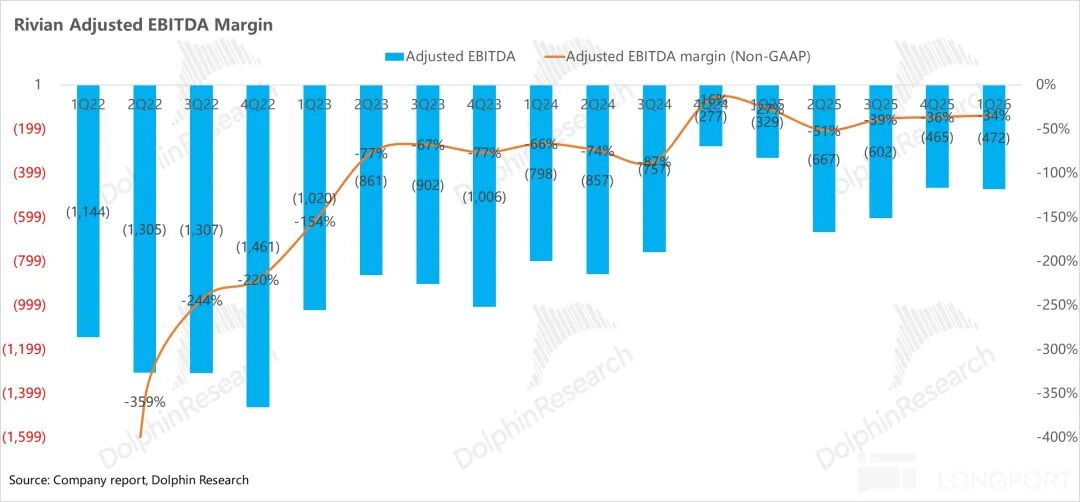
4) Adjusted EBITDA slightly better than expected: Supported by better-than-expected gross margins, adjusted EBITDA for the quarter was -$472 million, down slightly QoQ but better than market expectations of -$500 million. Adjusted EBITDA margin was -34.2%, up 2 percentage points QoQ, with overall profitability slightly better than expected.
Dolphin Research's Overall View:
Overall, Rivian delivered an earnings report that slightly exceeded expectations, with revenue roughly in line with forecasts and adjusted EBITDA and net profit beating expectations. However, true per-unit automotive revenue and gross margin declined QoQ, with true automotive gross margin falling 3.3 percentage points QoQ from -10.9% in Q4 to -14% in Q1. Despite a 3.3% QoQ increase in automotive sales to 10,400 units in Q1, such gross margin performance is not ideal.
Compared to Q3 results, the market is clearly more focused on the mass production progress of the high-volume, affordable R2 model (production ramp-up speed, impact on gross margin), but signals from the earnings call were not overly optimistic:
① Automotive gross margin: Q2-Q3 to remain under pressure, with a turnaround expected in Q4
Rivian expects automotive gross margin to remain under pressure in Q2-Q3 due to R2 production ramp-up, driven by three main factors:
a. R2 officially entered mass production in Q2, with depreciation starting. Initial production is on a single-shift basis, limiting output and preventing full amortization of new depreciation, pushing up per-unit depreciation costs.
b. A new manufacturing team was assembled to support R2 production, incurring additional personnel costs.
c. The complexity of ramping up production for a new model further increases per-unit costs.
The company expects automotive gross margin to turn positive in Q4 (for both R2 and overall automotive business), driven by:
a. Concentrated production release in Q4, with scale effects starting to materialize.
b. Significant cost advantages for R2, with BOM costs about 50% of the R1 platform, and non-production-related COGS expected to decline by over 50%. R2 achieves cost reductions through design optimizations like large-scale die-cast parts, structural battery packs, new high-efficiency drive units, next-gen electrical architecture (reducing copper usage), and integrated high-voltage electronic components in a single housing, combined with improved bargaining power in component procurement.
② Production ramp-up and delivery: R2 sales release to focus on Q4
Rivian maintains its 2026 full-year sales guidance of 62,000-67,000 units, up 47%-60% YoY from 42,000 units in 2025, with nearly all growth coming from the upcoming R2 model.
The company also maintains its Q2 2026 single-quarter sales guidance of 9,000-11,000 units,, implying 42000-47,000 units need to be delivered in H2 2026, an increase of 20,000-25,000 units YoY, with nearly all net growth coming from R2.
Our calculations suggest that if R1 sales decline 7% YoY due to subsidy phase-outs, the full-year guidance implies R2 sales of about 21,000-27,000 units.
In terms of production ramp-up, R2 will start mass production on a single-shift basis, with plans to expand to double shifts by the end of 2026. Sales release will be highly concentrated in Q4, with significant quarterly delivery pressure. The company also guides that the Normal plant needs to achieve 4,000 weekly deliveries by year-end, further confirming that sales and gross margin release will primarily occur in Q4 2026.
③ Raised threshold and delayed timeline for free cash flow turnaround, with DOE loan limit reduced
Under previous plans, the DOE loan limit was $6.6 billion, but the earnings call confirmed it has been reduced to $4.5 billion (about $4 billion principal + about $500 million capitalized interest), with drawdowns expected to begin in early 2027.
Meanwhile, the threshold for free cash flow turnaround has been significantly raised, requiring the Normal plant in Illinois and the Georgia plant to reach a combined annual capacity of 515,000 units to achieve positive free cash flow, further delaying this milestone beyond market expectations of EBITDA and FCFF turnaround in 2027 (the company originally expected EBITDA to turn positive in 2027, driven by full-year scaling production of R2, continued growth in software and services revenue, and incremental contributions from technology licensing and strategic partnerships).
④ Adjusted EBITDA guidance maintained at -$1.8 billion to -$2.1 billion (2025: -$2.06 billion):
2026 sales guidance is up 47%-60% YoY, but adjusted EBITDA guidance is roughly flat YoY. The main reason is that R2 will spend most of the year ramping up production, combined with significantly increased R&D investment in autonomous driving, with sales growth's impact on profits being offset by higher costs and R&D spending.
The company expects software and services revenue to grow 60% YoY to $2.5 billion in 2026 (with the Volkswagen JV contributing about 60% of revenue), with an overall gross margin of 35%, becoming the core support for stabilizing the company's overall gross margin during the R2 ramp-up period.
⑤ Cash flow: Cash flow declined significantly QoQ, but combined with investments and loans from Volkswagen and Uber, potential cash reserves are sufficient to support R2 mass production and capacity ramp-up:
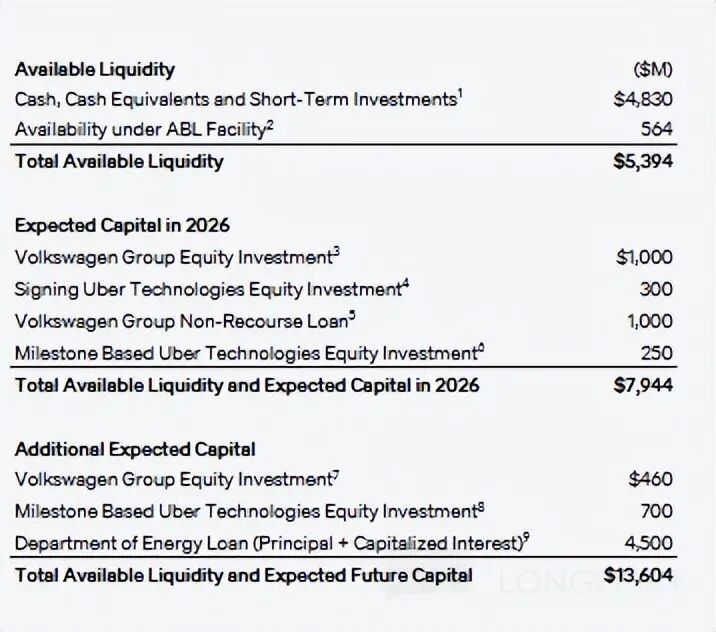
As of Q1 2026, the company held $4.8 billion in cash, cash equivalents, and short-term investments, down $1.25 billion QoQ from $6.08 billion. However, the company will receive $2 billion in investment and loans from Volkswagen Group and $550 million in strategic investment from Uber in 2026, bringing total available liquidity for the year to nearly $8 billion, sufficient to support R2 mass production and capacity ramp-up.
⑥ Autonomous driving progress:
In H2 2026, Rivian plans to roll out point-to-point autonomous driving for consumer models and deploy Robotaxi test vehicles with safety drivers in San Francisco and Miami (unlocking $250 million in equity funding from Uber).
In 2027, L3 autonomous driving with Eyes-Off capability will be available in specific regions; in 2028, L4 autonomous driving will debut in robotaxi form (this version will feature additional sensing equipment, differing from the pure consumer model), with the company also planning an L4 private vehicle version. R&D investment in autonomous driving will accelerate significantly in 2027, with signs of acceleration already visible in 2026.
Meanwhile, the third-generation autonomous driving hardware suite includes the self-developed RAP1 inference platform (800TOPS per chip, with dual chips per vehicle, quadrupling compute power compared to NVIDIA platforms), LiDAR, and other perception system upgrades, expected to debut on R2 models by the end of 2026, further supporting vehicle sales.
Management has concentrated the core sales and gross margin release timeline in Q4 2026: Automotive gross margin will remain under pressure in Q2-Q3, with a turnaround expected in Q4; if R2 mass production and delivery fall short again in Q4, the company risks further downward revisions to full-year sales guidance.
Meanwhile, medium- to long-term uncertainties have increased: First, the threshold for free cash flow turnaround has been raised and delayed, requiring the Normal plant and Georgia plant to reach 515,000 units in annual capacity to achieve positive free cash flow, later than market expectations of EBITDA turnaround in 2027; second, the DOE loan limit has been reduced from $6.6 billion to $4.5 billion, increasing financing pressure.
Overall, the company faces Q2-Q3 performance pressure, risks downward revisions to full-year sales guidance, and increased medium- to long-term uncertainties, suggesting waiting for a more margin-of-safety entry point.
Below is a detailed analysis:
1. Q1 gross margin declined slightly QoQ
Rivian's Q1 gross margin was 8.6%, down 0.7 percentage points QoQ but slightly above market expectations of 8.2%, mainly due to a slight decline in software and services gross margin, with reported automotive gross margin roughly flat QoQ:
① Reported automotive gross margin flat QoQ: Q1 reported automotive gross margin was -6.8%, roughly flat QoQ and above market expectations of -7.8%, but mainly due to a $58 million gross profit from carbon credit revenue recognized this quarter.
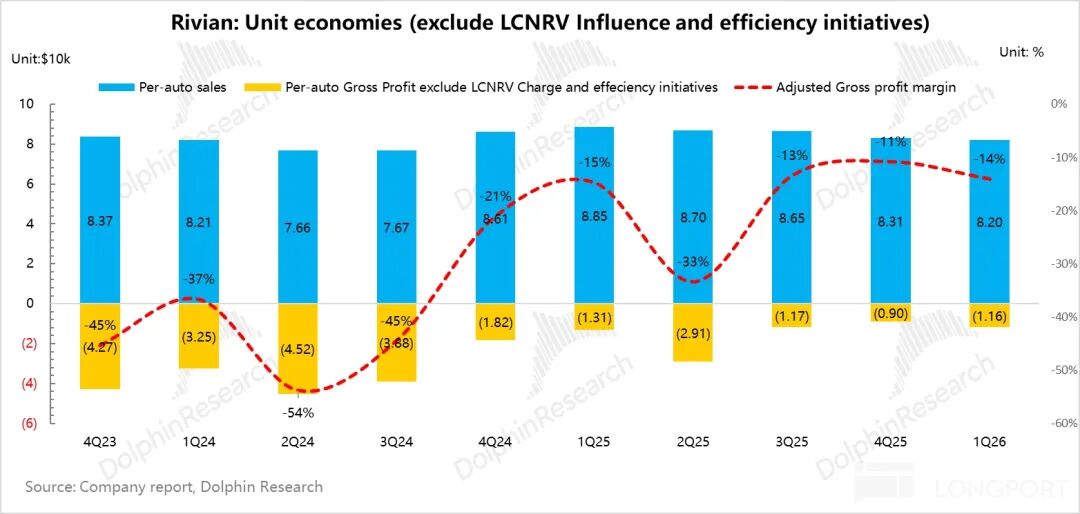
After excluding this impact, true automotive gross margin was -14.1%, down 3.3 percentage points QoQ from -10.9%, mainly due to a slight decline in per-unit automotive revenue (higher proportion of low-priced EDVs) and rising procurement and per-unit depreciation costs QoQ.
② Software and services gross margin declined slightly QoQ: Q1 software and services gross margin declined slightly QoQ, from 40% last quarter to 38.3% this quarter, with software and services revenue still mainly driven by high-margin technology licensing revenue from the Volkswagen JV (Q1: $282 million, 60% of total software and services revenue), while gross margins for other services like used car trading, vehicle maintenance, and repairs may have declined slightly.
2. Automotive gross margin continues to decline QoQ
Analyzing Rivian's true automotive gross margin is relatively complex, especially with various accounting adjustments (inventory LCNRV impairment write-backs, one-time cost factors, etc.).
From Q1's true automotive gross margin (excluding carbon credits and inventory impairments), it was -14.1%, down 3.2 percentage points QoQ from -10.9%, mainly due to a QoQ decline in per-unit automotive revenue and rising per-unit costs.
Breaking down per-unit economics for the quarter:
1) Per-unit revenue: Declined QoQ, mainly due to higher EDV proportion and increased promotions
Q1 per-unit automotive revenue was $82,000, down about $1,000 QoQ, likely due to a higher proportion of low-priced EDV vans and increased promotional efforts by Rivian amid IRA subsidy phase-outs (offering 0% APR loans for up to 60 months and $3,000-$6,500 leasing subsidies for 2025 R1 models and some 2026 high-end models), along with $1,000 cash discounts for R1 models.
2) Per-unit cost: Increased by $1,400, with rising per-unit depreciation and variable costs
a. Per-unit depreciation cost up $700 QoQ
Q1 per-unit depreciation cost increased by $700 to $11,800, mainly due to only 10,300 deliveries in Q1 (15.3%-16.6% of full-year target), with low production volume unable to fully amortize fixed costs (still affected by IRA subsidy phase-outs); combined with new depreciation from R2 production line preparations, despite a 6% QoQ increase in deliveries, per-unit depreciation cost still rose.
b. Per-unit variable cost continued to rise
Q1 per-unit variable cost increased by $700 QoQ to $82,000, mainly due to unrecognized tariff rebates this quarter and upstream raw material price increases.
① Tariff costs not yet offset by rebates:
The tariff offset preference of 3.75% of MSRP (Manufacturer's Suggested Retail Price) under U.S. Section 232 has been extended to 2030, with new categories of parts eligible for inclusion under Section 232. Rivian's vertically integrated model (self-developing and self-producing parts) can enjoy 'more tariff exemptions for parts.' Although no IEEPA tariff credits were recorded this quarter, the company believes it is possible to recover IEEPA tariffs in the future, with future benefits in the tens of millions of dollars.
② Core raw materials and electronic components see price hikes:
The prices of metal raw materials such as aluminum have risen; automotive-grade chips like DRAM have experienced shortages and significant price rebounds due to AI production capacity crowd out (capacity squeeze), and lithium carbonate prices have also increased, directly driving up the bill of materials (BOM) cost per vehicle.
Moreover, supply chain volatility has intensified, prompting the company to expand alternative sourcing to ensure supply, with short-term purchase prices exceeding long-term agreement prices. Simultaneously, costs in parts and logistics have risen due to tight supply and demand, further increasing unit variable costs.
c. Gross profit per vehicle declined sequentially
This quarter, the gross profit per vehicle declined by $2,500 sequentially to -$12,000, amid a decline in per-vehicle revenue and an increase in per-vehicle costs. The gross margin for the genuine automotive business also declined sequentially, dropping 3.3 percentage points from -10.9% last quarter.
III. Automotive Business Gross Margin: Continued Pressure in Q2–Q3, Turning Positive in Q4
Rivian expects the automotive business gross margin to remain under pressure in the second and third quarters due to the R2 production ramp-up, with three core reasons:
① R2 officially commenced mass production in the second quarter and began depreciation, but initial production was on a single-shift basis with limited output, failing to fully dilute the significant new depreciation expenses and driving up unit depreciation costs;
② The onboarding of a new manufacturing team assembled to support R2 mass production brought additional personnel salary costs;
③ The ramp-up complexity in the initial mass production phase of the new model further exacerbated unit cost pressures.
The company expects the automotive business gross margin to turn positive in the fourth quarter (with both the R2 model and overall automotive business gross margins turning positive simultaneously), driven by:
① Concentrated production release in the fourth quarter, with scale effects beginning to manifest;
② R2's significant cost advantages, with a BOM cost approximately 50% of the R1 platform, and non-mass-production-related cost of goods sold expected to decline by over 50%. R2 achieves comprehensive cost reductions through design optimizations such as large-scale die-cast parts, structural battery packs, new high-efficiency drive units, next-generation electrical/electronic architecture (eliminating substantial copper wiring), and integration of high-voltage electronic components into a single housing, coupled with enhanced bargaining power in parts procurement.
Regarding production ramp-up, R2 mass production commenced on a single-shift basis, with plans to expand to a double-shift system by the end of 2026; the Normal plant's 'North Star' goal is to achieve weekly deliveries of 4,000 units, meaning the core release nodes for sales volume and gross margin will still need to wait until the fourth quarter of this year.
IV. Overall Revenue Largely in Line with Expectations
Total revenue this quarter was $1.38 billion, up 11.4% year-over-year, primarily due to a 49% year-over-year increase in software and service revenue to $470 million, with overall revenue in line with market expectations.
① Vehicle sales revenue (including carbon credits) was $910 million this quarter, down 1.5% year-over-year, mainly due to a $100 million decrease in carbon credit revenue and a decline in the average selling price of vehicles as the proportion of lower-priced EDVs increased and R1 promotional discounts intensified following the phase-out of IRA subsidies, ultimately resulting in a nearly $7,000 year-over-year decline in per-vehicle revenue to just $82,000 in the first quarter.
② Software and service revenue was the primary driver of the year-over-year increase in total revenue, reaching $473 million this quarter, up 49% year-over-year, mainly due to high-margin technology licensing revenue contributed by the joint venture with Volkswagen ( $282 million in the first quarter, accounting for 60% of total software and service revenue).
V. Continued Increase in Three Expense Categories
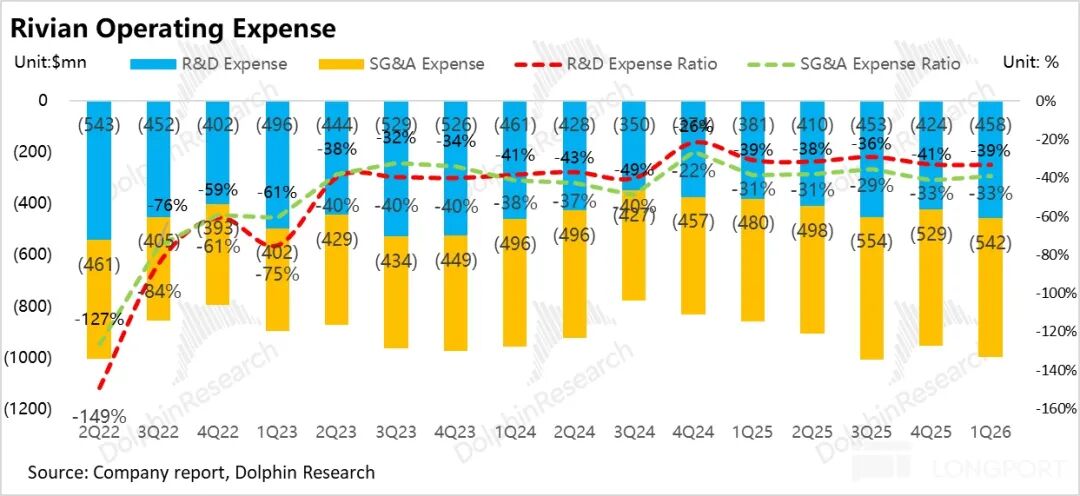
① R&D Expenses: $460 million in Q1, up 20% year-over-year
Rivian's R&D expenses this quarter were $460 million, continuing to rise 20% year-over-year, primarily due to:
a. Continued expansion of autonomous driving investments: The company is fully advancing its self-developed autonomous driving chip RAP1, point-to-point autonomous driving capabilities, and the development of autonomous robotaxis in collaboration with Uber, leading to significant increases in software, cloud services, and algorithm training expenditures; simultaneously, it is making advance preparations for a substantial acceleration in autonomous driving R&D investments in 2027.
b. Concentrated pre-mass-production R&D expenditures for R2: As R2 enters the sellable mass production phase, work such as trial production validation, manufacturing process optimization, development of a new-generation electrical/electronic architecture, and implementation of the in-vehicle AI assistant Rivian Assistant has led to a phased increase in R&D expenses.
c. Rising personnel and incentive costs: Expansion of the R&D team has driven growth in salary expenditures, with month-on-month (sequential) increases in R&D-related equity incentive expenses.
Timeline and Hardware Planning: In the second half of 2026, Rivian plans to launch point-to-point autonomous driving capabilities in consumer-facing models; simultaneously, it will deploy Robotaxi test vehicles equipped with safety drivers in San Francisco and Miami (unlocking $250 million in equity funding from Uber).
In 2027, it will introduce Eyes-Off Level 3 autonomous driving capabilities in specific regions; in 2028, it will debut Level 4 autonomous driving for the first time, initially in the form of autonomous robotaxis (this version will feature additional sensing equipment, differing from pure consumer models), with the company simultaneously planning a Level 4 private vehicle version. Autonomous driving-related R&D investments will significantly accelerate in 2027, with acceleration already evident throughout 2026.
Meanwhile, the third-generation autonomous driving hardware suite, including the self-developed RAP1 inference platform (with single-chip computing power of 800TOPS, dual-chip deployment per vehicle, approximately quadrupling computing power compared to NVIDIA platforms), LiDAR, and other upgraded perception system configurations, is expected to be deployed in R2 models by the end of 2026, further supporting vehicle sales.
② SG&A Expenses: $540 million in Q1, up 13% year-over-year
Rivian's SG&A expenses this quarter were $540 million, also up 13% year-over-year, primarily due to:
a. Expansion of pre-sales and channel systems: In preparation for large-scale R2 deliveries, continuous expansion of sales stores, service centers, and charging networks, along with increased market and user operations investments.
b. Rising personnel and incentive costs: Expansion of the sales, management, and operations teams has led to higher salary and equity incentive expenses.
VI. Adjusted EBITDA Slightly Better Than Expected
In terms of Adjusted EBITDA, this quarter's Adjusted EBITDA was -$472 million, slightly declining sequentially but slightly better than the market expectation of -$500 million, primarily due to a higher-than-expected gross margin. The Adjusted EBITDA margin also slightly increased sequentially by 2 percentage points to -34.2%.
- END -
// Reprint Authorization
This article is an original work by Dolphin Research. Reprinting requires authorization.
// Disclaimer and General Disclosure Notice
This report is for general comprehensive data purposes only, intended for general viewing and data reference by users of Dolphin Research and its affiliated institutions. It does not consider the specific investment objectives, investment product preferences, risk tolerance, financial status, or special needs of any individual receiving this report. Investors must consult with independent professional advisors before making investment decisions based on this report. Any person making investment decisions based on the content or information referenced in this report assumes all risks. Dolphin Research shall not be liable for any direct or indirect responsibilities or losses that may arise from the use of the data contained in this report. The information and data in this report are based on publicly available materials and are for reference purposes only. Dolphin Research strives to ensure but does not guarantee the reliability, accuracy, and completeness of the relevant information and data.
The information or viewpoints mentioned in this report shall not, under any jurisdiction, be construed as or deemed as an offer to sell securities or an invitation to buy or sell securities, nor shall they constitute recommendations, inquiries, or endorsements of relevant securities or related financial instruments. The information, tools, and materials in this report are not intended for or proposed for distribution to jurisdictions where the distribution, publication, provision, or use of such information, tools, and materials contradicts applicable laws or regulations, or to citizens or residents of jurisdictions where Dolphin Research and/or its subsidiaries or affiliated companies are required to comply with any registration or licensing requirements in such jurisdictions.
This report merely reflects the personal viewpoints, insights, and analytical methods of the relevant creators and does not represent the stance of Dolphin Research and/or its affiliated institutions.
This report is produced by Dolphin Research, with copyright solely owned by Dolphin Research. Any institution or individual shall not, without the prior written consent of Dolphin Research, (i) make, copy, reproduce, duplicate, forward, or create any form of copies or reproductions in any manner, and/or (ii) directly or indirectly redistribute or transfer to other unauthorized persons. Dolphin Research reserves all relevant rights.
-
![]()
Total Investment Hits Nearly 3.28 Billion! Goertek Launches Mass Production of 12-Inch Transparent Substrate Wafer for AR Glasses’ Micro-Nano Optical Components
-
![]()
Why Is This Precision Optical Film Leader Worth Reevaluating with a Tens of Millions Procurement?
-
![]()
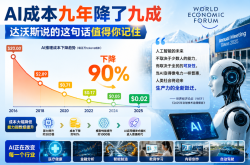
AI Costs Plummet by 90% Over Nine Years: Key Insights from Davos You Shouldn’t Miss
-
Doubao, Your Late-Night AI Companion, Now Eyes Profitability
-
![]()
SRC Empowers SEER Intelligence to Reach a Market Cap of Tens of Billions, Yet Fails to Sustain Profitability
-
![]()
China’s Embodied AI Industry Faces Fierce Domestic Competition, Making Overseas Expansion Essential for Survival
-
![]()
32.8 Billion Yuan Investment! Goertek’s 12-Inch AR Glasses Optical Wafer Base in Lingang Begins Operations
-
![]()
How Far is the All-New Li Auto L8 from Being the Best Five-Seat SUV with In-House Full-Stack Development?