China's Auto Market in April: A 2.5% Sales Decline, a 74% Export Surge, and Profit Margins Below 3.5%
 05/13 2026
 557
557
In-Depth Analysis · Data Insights
China's Auto Industry at a Critical Juncture
Recently, the China Association of Automobile Manufacturers (CAAM) unveiled the operational data for China's auto industry in April. While the figures may appear unremarkable at first glance, they actually mask the most significant structural transformation in China's auto sector in nearly a decade.
Those who focus solely on "stable production and sales" overlook the underlying financial challenges, while those who tout an "export boom" neglect the geographical dependencies.
01 / Calm Waters, Turbulent Undercurrents
The CAAM's April 2026 data, released on May 11, highlights three key metrics:
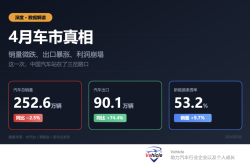
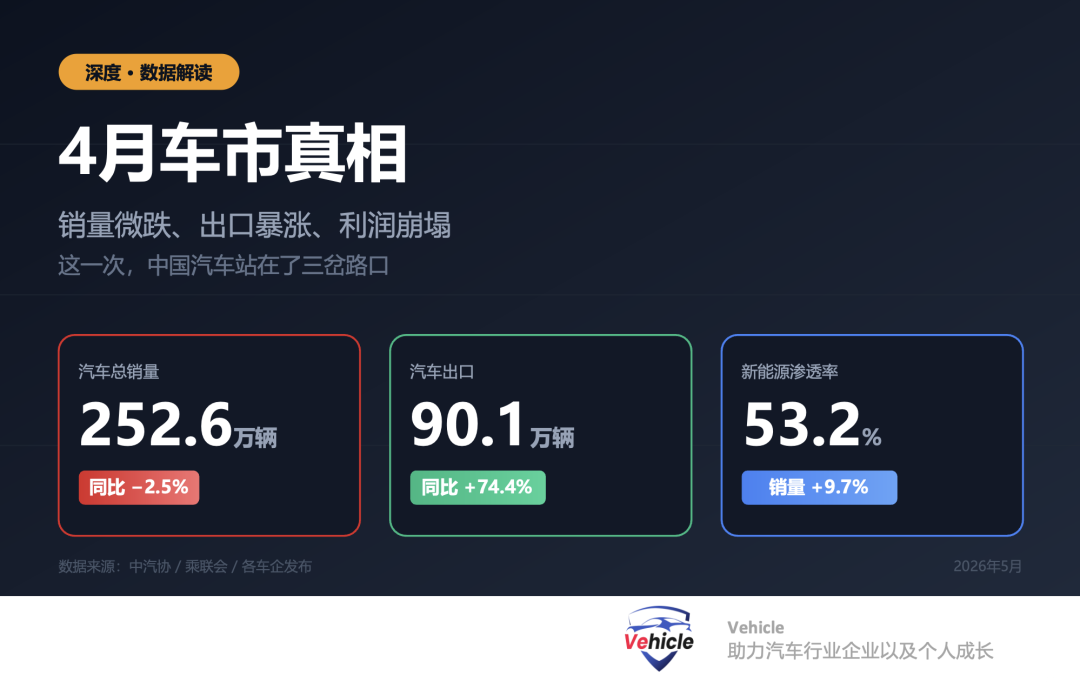
Total auto sales (including passenger vehicles, commercial vehicles, and exports): 2.526 million units, down 2.5% year-on-year (YoY). Auto exports: 901,000 units, up 74.4% YoY and 3% month-on-month (MoM). New Energy Vehicle (NEV) sales: 1.344 million units, with a penetration rate of 53.2%.
From January to April: Production and sales reached 9.61 million and 9.57 million units, respectively. NEV sales totaled 4.3 million units, while exports hit 3.127 million units (up 61.5% YoY), including 1.38 million NEV exports (up 120% YoY).
On the surface, the data suggests "steady progress." However, for industry regulators or investors, a deeper analysis of three key intersections is crucial:
Domestic retail is declining · Exports are driving growth · Profits are dwindling
Subtracting the 901,000 export units from the total 2.526 million, domestic sales stand at approximately 1.625 million units. Compared to the same period last year, domestic retail sales dropped by 21.6%—a reality well understood within the industry.
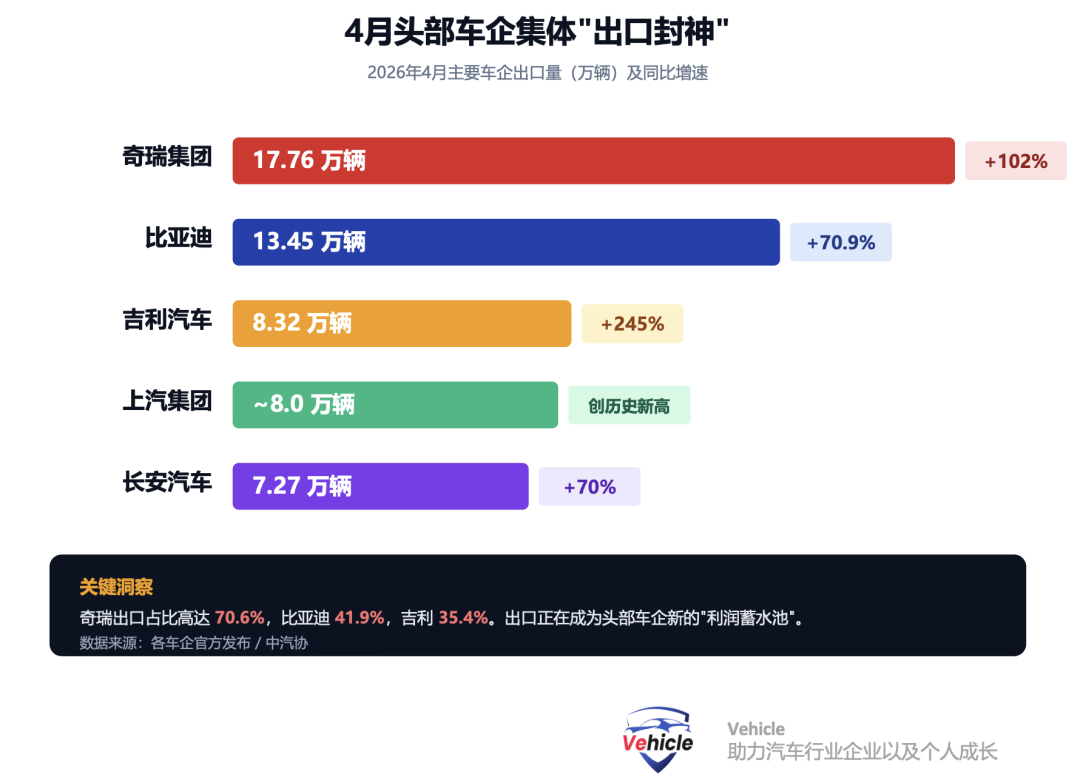
02 / Export 'Deification Month': Triumph, but Highly Dependent
April has been dubbed the "deification month" for China's auto exports, with nearly all leading automakers achieving record-high export volumes.
A closer examination reveals that this "deification" is a structural gamble. In the first quarter (Q1), China's top three export destinations for passenger vehicles were Russia (187,000 units), Brazil (167,000 units), and the UK (109,000 units).
Three potential risks:
① Russia: Tightening technical certifications, scrappage taxes, and localization requirements have shifted growth from "explosive" to "highly volatile" since the second half of 2025.
② Mexico: Passenger vehicle tariffs rose from 20% to 50% on January 1, 2026, with Q1 exports to Mexico dropping 44.7% YoY.
③ EU: Under anti-subsidy tax frameworks, low pricing is unsustainable; true profitability comes from product premium.
Implications for investors: Focusing solely on total export volumes overestimates industry health. Analyzing export structure and country-specific risks yields vastly different conclusions. The marginal slowdown in Russia and Mexico will begin to impact cash flow in the second half of 2026.
03 / NEV Penetration Exceeds 53%: The Game Has Changed
The 53.2% NEV penetration rate, a significant rise from January's ~46%, may seem "epic," but it's no longer surprising. The real discussion lies in structural shifts:
Plug-in Hybrid Electric Vehicles (PHEVs) and extended-range EVs are filling structural gaps. From January to April, extended-range EV sales continued to lead, reflecting third- and fourth-tier markets' preference for range security and underdeveloped charging infrastructure.
The turning point for Battery Electric Vehicles (BEVs) lies in product iteration speed, not policy. Purchase tax exemptions will halve in 2026 (up to RMB 15,000), and national subsidies for trade-ins continue (up to RMB 20,000 for NEVs), but subsidies' impact on pricing has shifted from "decisive" to "marginal."
The first tier of new forces is reshuffling: "NIO, XPeng, Li Auto" no longer exist in name; "Hongqi, Leapmotor, MI, Li Auto" form the new landscape—Leapmotor, HiPhi (Seres), and Xiaomi lead the pack.
The real keyword isn't penetration but "value band" shift. With NEVs exceeding 50%, success hinges on per-unit gross profit, intelligent driving iteration speed, and globalization capabilities—not another RMB 10,000 price cut.
04 / 3.2% Profit Margin: More Alarming Than Sales Figures
While sales data may seem uneventful, profit figures from the National Bureau of Statistics and the China Automobile Dealers Association (CADA) are likely to keep CEOs and industry professionals awake at night.
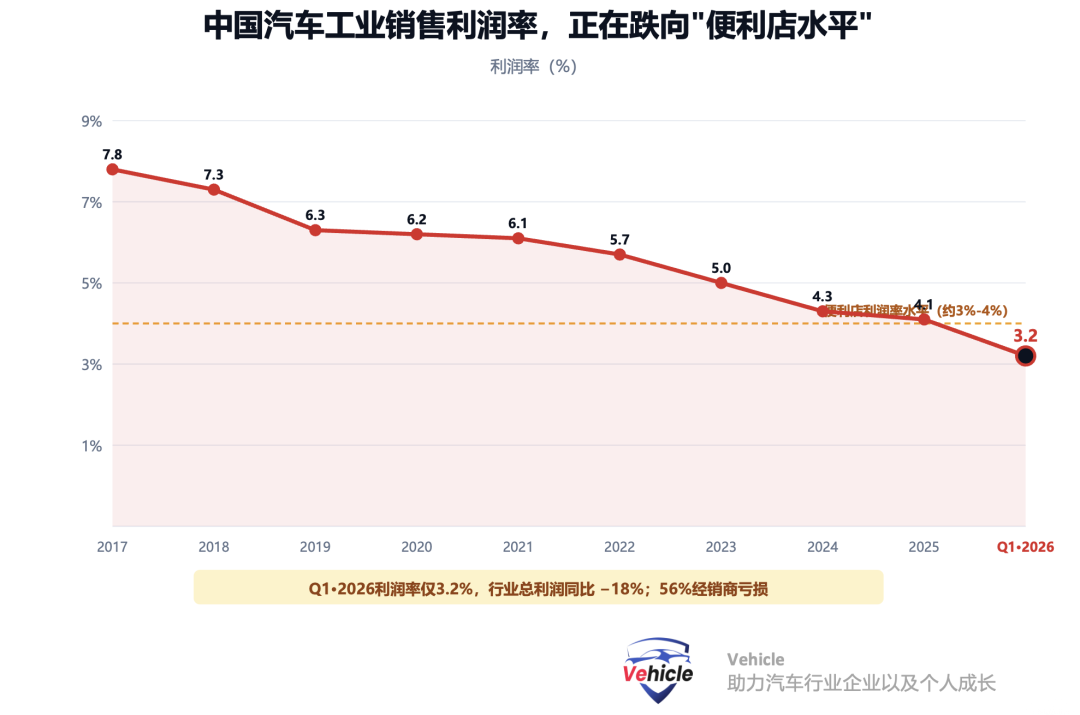
Q1 2026 industry profits fell 18% YoY, totaling RMB 78.4 billion. The sales profit margin stood at just 3.2% (4.1% in 2025, 4.3% in 2024). In 2025, the average gross profit per vehicle was approximately RMB 14,000 (~USD 2,000), the second-lowest in history. In 2025, 56% of dealers operated at a loss (up from 42% in 2024).
What does this mean? Sales profit margins now rival those of convenience stores. Any fluctuations in demand, raw material prices, or exchange rates could submerge the entire industry.
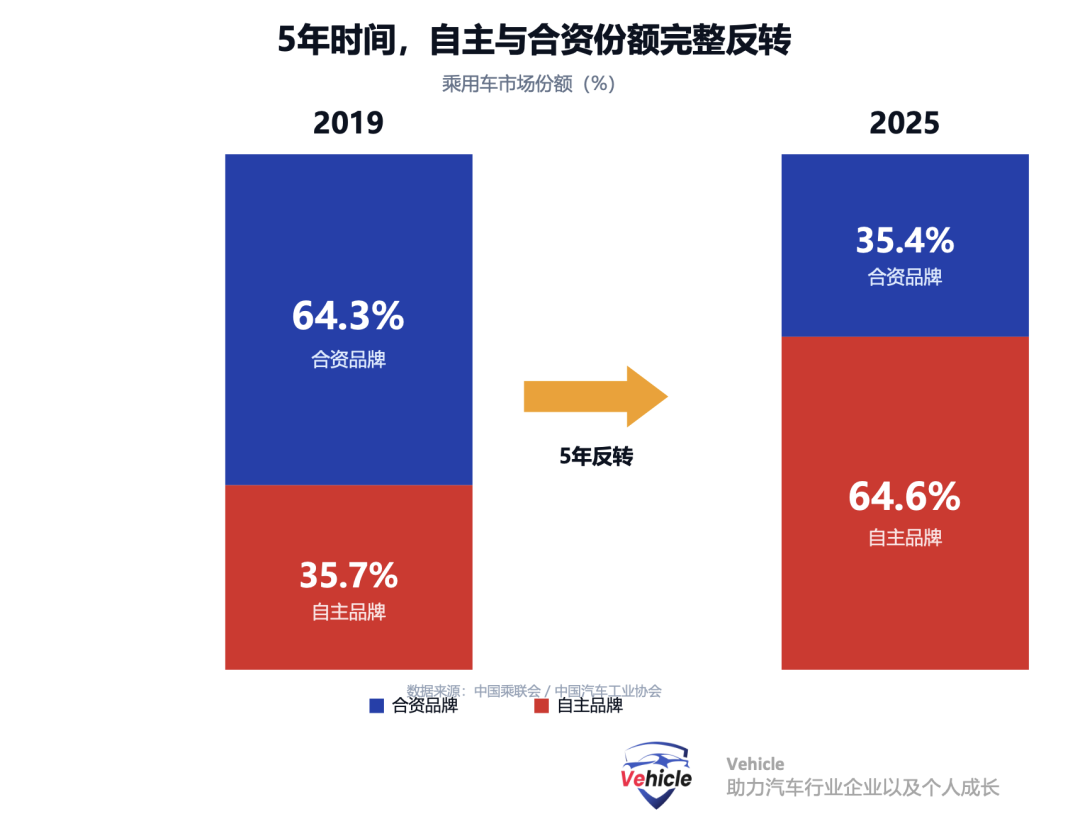
05 / Joint Venture Brands: Not a 'Comeback,' but a 'New Way of Surviving'
In January–February 2026, Volkswagen Group (FAW-Volkswagen + SAIC Volkswagen) reclaimed the top spot in passenger vehicle sales with a 13.9% share. However, a longer-term view reveals a stark reality—the joint venture market has halved in five years.

Sales collapses among leading joint ventures:
Mercedes-Benz China: Peaked at 774,000 units in 2020 → 575,000 units in 2025 (down 19% YoY).
Peugeot, Citroën, Skoda, and Infiniti have fallen below 20,000 annual sales, effectively exiting the market.
Mainstream joint ventures' NEV penetration rate stands at just 3.6%, compared to the overall market's 53% and domestic brands' >70%.
The early 2026 share recovery accurately reflects "regaining a small slice of a shrinking pie," not "expanding the pie."
06 / Five Not-Necessarily-Politically-Correct Judgments
① The "export miracle" is real, but H2 2026 may see the first MoM export decline.
② NEV penetration is no longer the valuation anchor. The triangle is: per-unit gross profit + depth of self-developed intelligent driving + overseas localization.
③ "Price wars" have evolved from tactics to an industry "metabolic process." Don't expect them to stop.
④ New force survivor landscape: 1+2+N. "Hongqi, Leapmotor, MI, Li Auto" are seizing "NIO, XPeng, Li Auto's" influence.
⑤ Joint ventures won't disappear; they'll evolve into a "China R&D—Global Sales" reverse chain. As shared in our previous article "Volkswagen China 2026 Market and Strategy Update," Volkswagen's China strategy has officially upgraded from "In China, For China" to "In China, For China, and Supporting Global (Support Global)."
07 / Specific Advice for Three Reader Groups
For Industry Regulators
The greatest alert isn't the slight sales decline but dealers' cash flow and accounts receivable terms. A wave of dealership closures is expected in H2.
For Investors
Screen by three indicators: (a) export share of 25%–60%; (b) YoY improvement in per-unit gross profit; (c) closed-loop intelligent driving computing power or deep ties with leading Tier 1 suppliers. No more than five companies currently meet all three criteria.
For Industry Professionals
R&D roles: Expertise in electronic electrical architecture + AI cockpits + end-to-end intelligent driving is highly scarce. Sales/channel roles: Mastering globalization capabilities (languages, overseas financing, local operations) will make you the most valuable asset within two years.
08 / Conclusion: A 'Stress Test Report'
China's auto industry is evolving at a pace never seen globally—leading in production and sales for 17 consecutive years, yet profit margins hit the second-lowest in history; NEV penetration surpasses 50%, yet half of dealers operate at a loss; exports break records, yet two key destination countries are tightening simultaneously.
Scale ≠ victory · Penetration ≠ moat · Exports ≠ globalization
April's data acts as a mirror, reflecting our industry's strengths, scars, and ambitions. The next six months will determine who becomes China's auto protagonist for the next decade and who remains a mere passerby.
If this article has reshaped your understanding of "China's auto industry,"
share it with friends who "only look at sales, not financials"—your every "like" motivates us to keep producing in-depth content.
We also welcome discussions in the comments.
Data Sources: CAAM / China Passenger Car Association (CPCA) / Releases from Various Automakers
▍Disclaimer: This article does not constitute investment or career advice and is solely for entertainment.
CAAM: April 2026 Auto Industry Production and Sales Report PDF
*Unauthorized reproduction or excerpting is strictly prohibited-
-
![]()
Auto China 2026: Chinese Brands Lead the Green and Smart Future | Cover Story: In China, for the World – Auto China 2026 Special Report (Part 3)
-
![]()
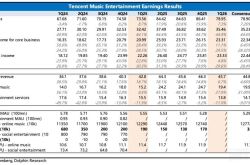
Can Tencent Music Win This Defensive Battle by Integrating Himalaya?
-
![]()
Volvo Asia Pacific: No More 'Successor' Era!
-
![]()
China's Auto Market in April: A 2.5% Sales Decline, a 74% Export Surge, and Profit Margins Below 3.5%
-
![]()
Toyota's Era of Sky-High Profits Draws to a Close
-
![]()
Can Trump Pave the Way for Chinese Automobiles in the US Market with Musk’s China Visit?
-
![]()
Can the New Unisplendour Group Break Away from Being a 'Huawei Alternative' After Resolving Its Hundred-Billion-Yuan Debt?
-
![]()
What technology enabled XPENG to eliminate LiDAR from its intelligent driving systems?