Cracks in the U.S. Stock Market's 'Perfect Loop': AI Fuels Bull Market but Not Employment?
 12/30 2025
 619
619
With the U.S. government back in operation, it can finally assess the year-end macroeconomic trends. However, the released data appears 'contradictory'—economic growth remains strong, inflation is declining rapidly, and employment is deteriorating so fast that it resembles an economic 'recession.'
How should we interpret this set of economic data? Is AI to blame? This article by Dolphin Research focuses on analyzing:
I. Q3: Strong U.S. Economic Growth
In Q3, U.S. GDP rose 1% quarter-over-quarter, reaching an annualized 4.3%, forming a relatively perfect upward curve. However, Q3 fell after the tariff relief period, during tariff negotiations and reconciliation, so net exports remained a disruptive factor.

The key lies in examining domestic demand growth, excluding imports—combined goods and services consumption contributed 0.6% quarter-over-quarter growth in household spending, accelerating from 0.4% in the previous quarter. Household demand remains a cornerstone of GDP growth.
Among private investment activities, inventory investment is heavily influenced by cycles (significant stockpiling in Q1 due to relief, followed by digestion in Q2 and Q3). The true indicator of private investment demand is changes in private fixed asset investment.
Breaking down private fixed asset investment into residential and non-residential sectors: residential investment remains weak under high-interest-rate pressures, while traditional infrastructure (offices, logistics facilities, factories, etc.) continues to underperform.
However, AI capital expenditure-related IP product investments and equipment investments remained strong, contributing a 0.7 percentage point (pct) boost to the 4.3% annualized Q3 growth.

Q3 economic growth perfectly illustrates a 'soft landing.'
II. Q4: Weakening Inflation, Deteriorating Employment—Smooth Path for Rate Cuts?
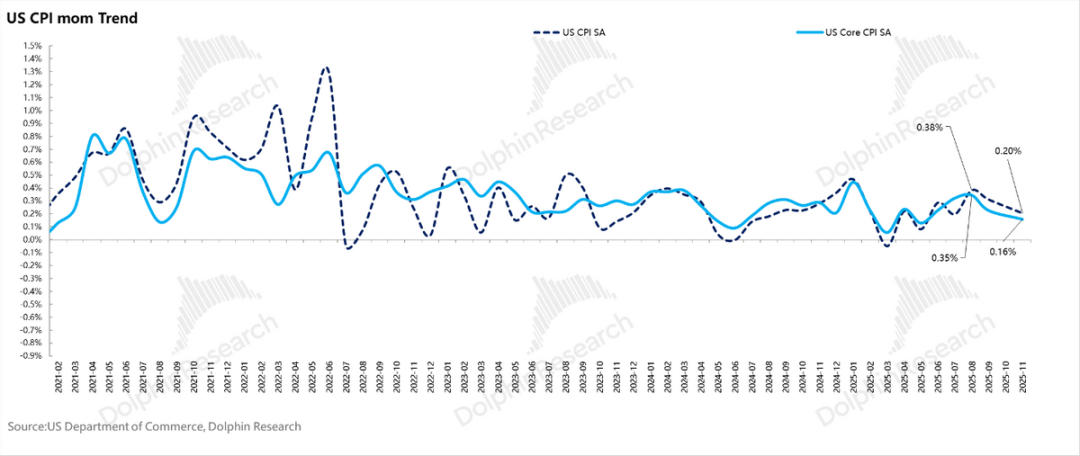
While Q3 GDP shone, inflation remained a concern. However, CPI data for October and November suggest easing pressure. Although October CPI data is permanently missing, comparing November to September, the U.S. core CPI index rose just 0.16% over two months—a clearly low growth rate.
Without government shutdown disruptions, inflationary pressures appear minimal.
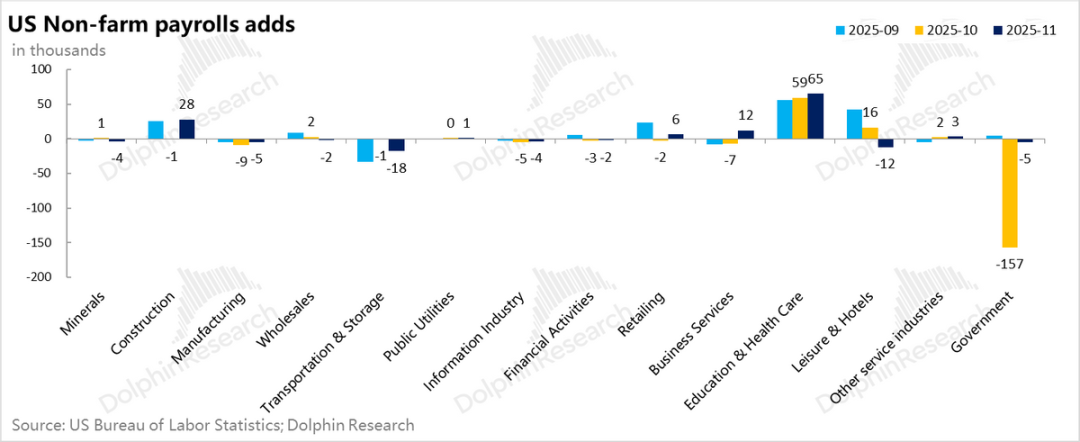
When paired with employment data, the case for rate cuts becomes even stronger: November added just 64,000 jobs, with October seeing a net loss of 105,000 jobs.

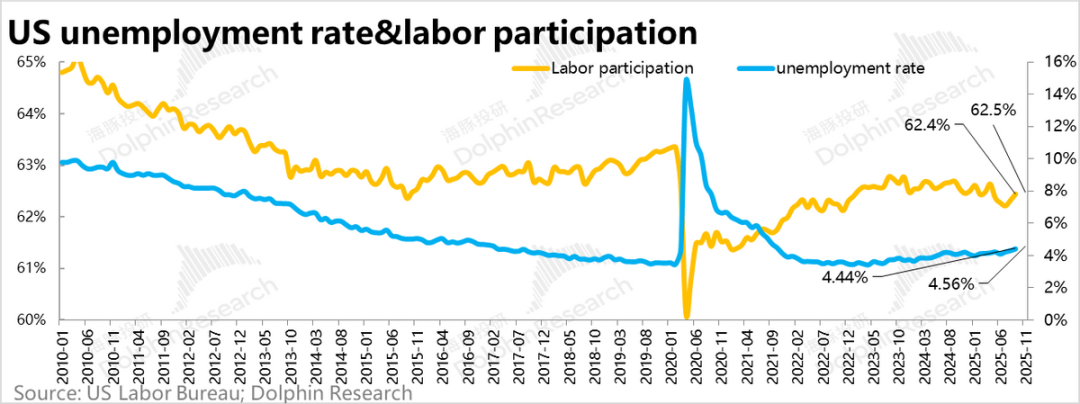
With a slight rebound in the November labor force participation rate, the U.S. unemployment rate surged to 4.56%, exceeding the Fed's target.
Employment fluctuations due to government shutdowns are noise. The focus should be on private-sector employment: across goods production, only construction (boosted by AI investments) and manufacturing (a Trump priority) saw sustained weakness.
In service-providing sectors, healthcare remained robust. Among other services, only professional business services (legal, accounting, architecture, advertising, management) and retail (home appliances, 3C products) saw hiring. Most other service industries experienced negative job growth.
As 2026 approaches, the combination of high growth, high unemployment, and weakening inflation raises a serious question: Will 2026 remain a year of high AI investment but low output?
a. Companies heavily investing in AI face rising capital expenditures, increasingly replacing labor with computing power to sustain growth, reflected in persistent IT layoffs. For instance, Dolphin Research notes that computer systems design and related services—a subsector with high IT employment—have seen negative growth for months.
b. However, these capital expenditures are still focused on building data centers or benefiting select industries (capital expenditure stocks, where new revenue requires minimal new hiring, e.g., NVIDIA), failing to boost overall economic productivity or create meaningful new jobs.
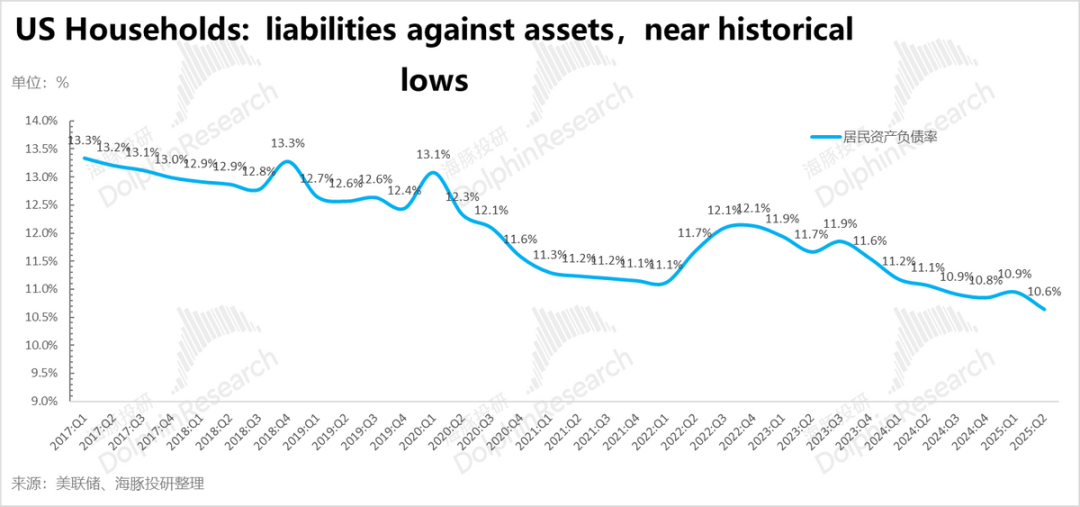
c. Why does weak employment not drag down consumer spending? Traditionally, deteriorating employment hits U.S. households hard due to low savings and poor risk resilience. This time, consider uneven consumer strength: pandemic stimulus once repaired household balance sheets. After excess savings depletion, vulnerable households saw default rates spike.
But this AI revolution, while seemingly employment-negative in the short term, has fueled a bull market, inflating the wealth of asset-owning Americans (stocks account for ~40% of U.S. household assets directly or indirectly). This wealth effect has sustained consumer spending.

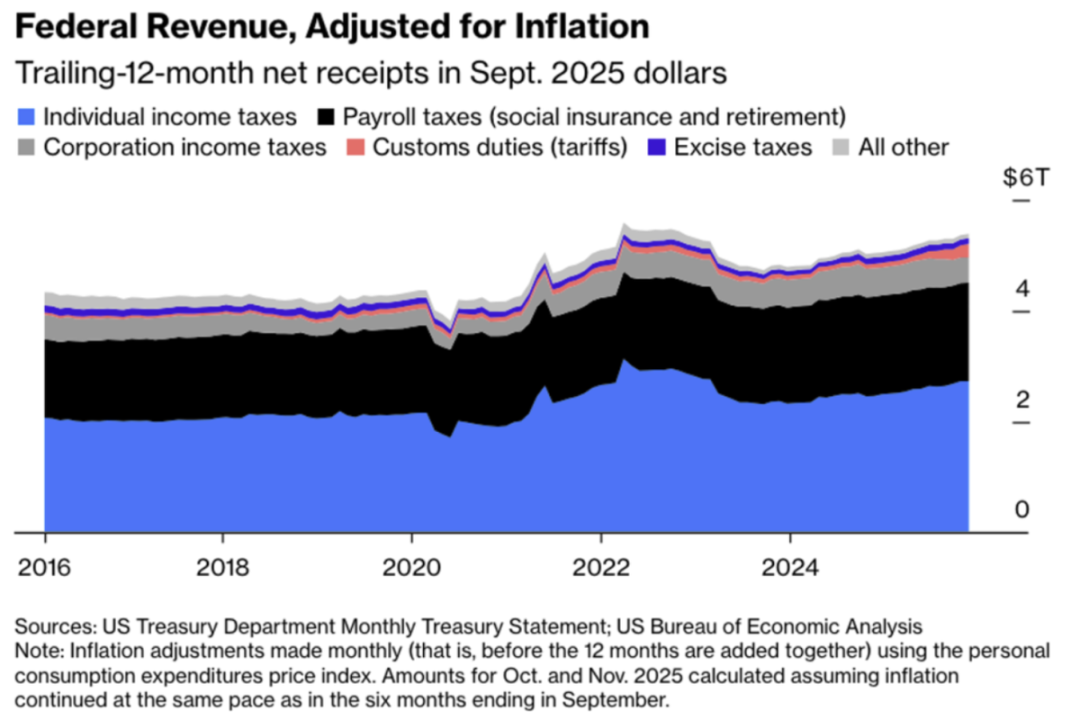
U.S. fiscal data reveals that household asset gains outpace wage growth: personal income tax revenue rose 26% from pre-pandemic levels, while payroll tax revenue grew just 14%, indicating capital gains significantly outpaced wage growth.
Meanwhile, manufacturing employment—a U.S. government priority—ranks second-worst among industries, ahead of only mining.

A clear chain emerges:
The AI revolution has not boosted employment but inflated stock prices—households earn slowly from wages but quickly from stocks—high stock ownership sustains purchasing power and consumer resilience—GDP achieves a soft landing despite rising unemployment and falling inflation.
Thus, 2025 U.S. economy nearly realizes a perfect loop of stock market gains and economic growth. However, if AI fails to deliver real-economy benefits in 2026 (creating new growth or enabling laid-off workers to maintain purchasing power through stock gains), this loop may break.
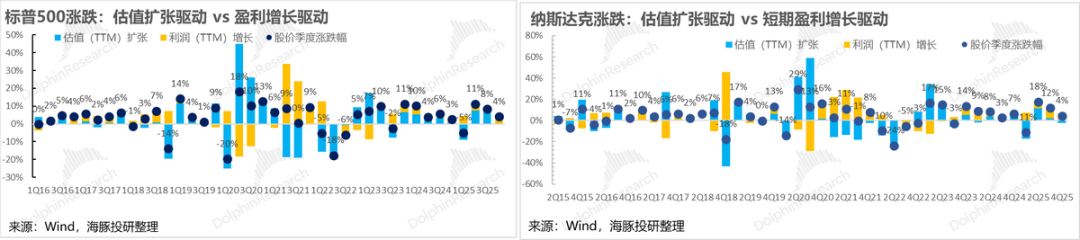
III. 2026 U.S. Stocks: Valuation Expansion vs. EPS Growth—Can a Davis Double Play Happen?
With 2026 growth relying heavily on wealth effects from AI-driven financial asset appreciation, can U.S. stocks sustain growth? After two years (2024–2025) of valuation expansion, U.S. stocks significantly deviate from historical medians (2025 valuations rose only modestly), making further expansion difficult in 2026.

Especially after Q4 liquidity tightened, U.S. stocks adjusted throughout the quarter. The key question is: Will 2026 see loose liquidity to support valuation expansion? Dolphin Research believes this is unlikely without Fed-Treasury coordination.
The U.S. faces an awkward interest rate dilemma: the Fed expects and implements rate cuts, but these only affect short-term rates, while long-term rates remain stagnant.

This forces fiscal financing to rely on short-term debt. However, with Fed reverse repo balances depleted and bank reserve balances shrinking, increased short-term debt issuance drains liquidity despite low interest rates.
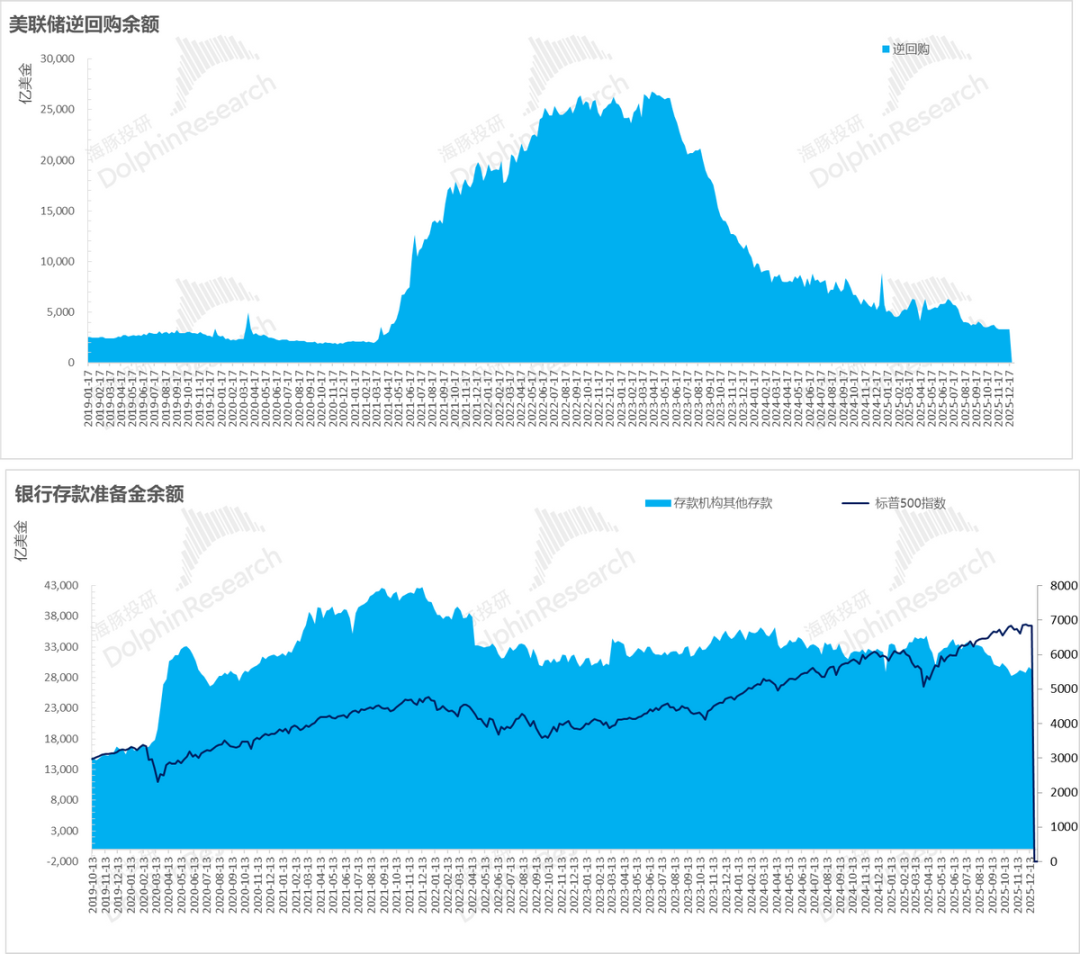
During liquidity crunches, stock markets struggle to rise, as seen in Q4. The U.S. government now faces a clear dilemma: high long-term rates deter Treasury from issuing long-term debt, while short-term debt financing, though tied to Fed rate cuts, risks draining short-term liquidity.
The Fed must either conduct yield curve control to suppress long-term rates or purchase short-term debt to provide liquidity. Either way, the Fed risks becoming a tool for fiscal financing.
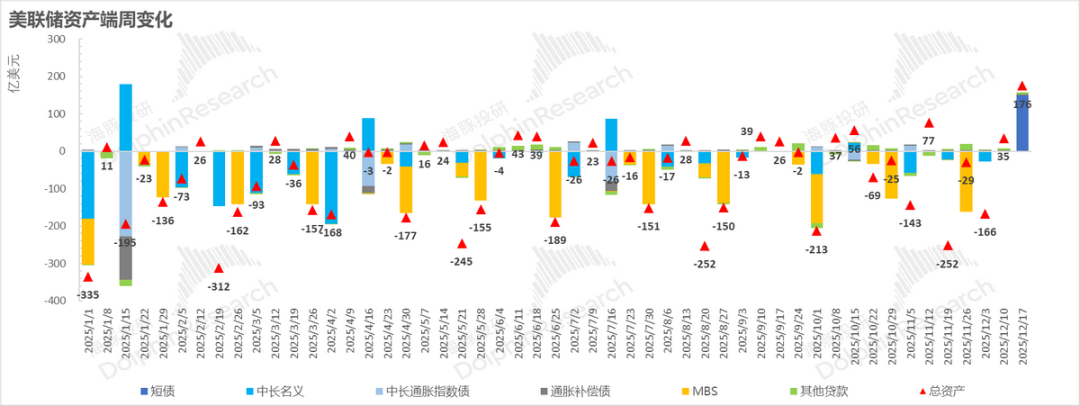
Fed balance sheet data from mid-December shows it opted to buy short-term debt (a mini-QE) to support fiscal short-term issuance.
Thus, 2026 stock market performance partly hinges on the new Fed Chair's willingness to coordinate with fiscal policies. Regardless, with short-term excess liquidity depleted, liquidity poses an additional risk to 2026 stocks.
If AI fails to boost corporate profits and EPS growth, 2026 U.S. stock performance depends on two factors:
a. Fiscal stimulus (OBBB bill, tariff revenue distributed to households?) to drive consumption and corporate EPS growth?
b. Will a cooperative Fed address financing challenges in both short- and long-term debt markets to facilitate fiscal stimulus?
Without AI-driven productivity gains, 2026 returns largely depend on these factors, especially the Fed's flexibility.
Otherwise, 2026 U.S. stocks may rely solely on EPS growth to justify valuations, weakening wealth effects and consumption. A stock market decline would not only hurt itself but also drag down economic growth.
IV. Portfolio Performance
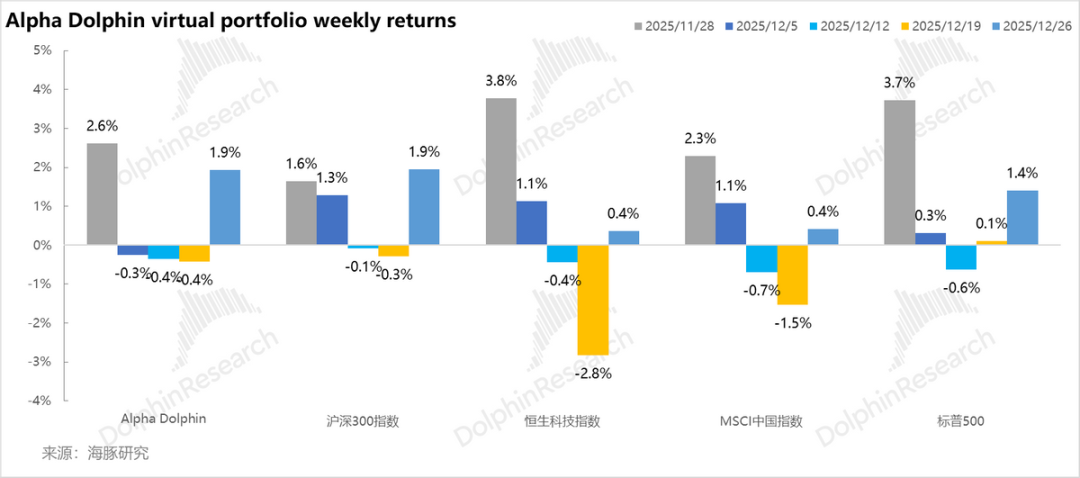
Last week, Dolphin Research's virtual Alpha Dolphin portfolio held steady. It rose 1.9%, matching the CSI 300 (+1.9%) and outperforming the MSCI China Index (+0.4%), Hang Seng Tech Index (+0.4%), and S&P 500 (+1.4%). Recent weeks show strong risk resilience amid market corrections.
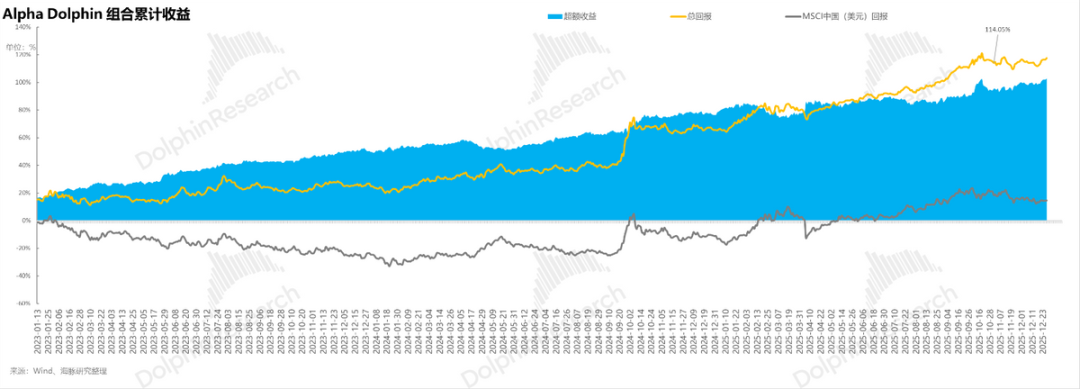
From the start of portfolio combination testing (March 25, 2022) until last weekend, the portfolio's absolute return was 117.5%, with an excess return of 103% compared to the MSCI China Index. From the perspective of net asset value, Dolphin Finance's initial virtual assets were valued at $100 million. As of last weekend, they exceeded $220 million, basically reaching a historic high at the end of the year.
V. Individual Stock Profit and Loss Contributions
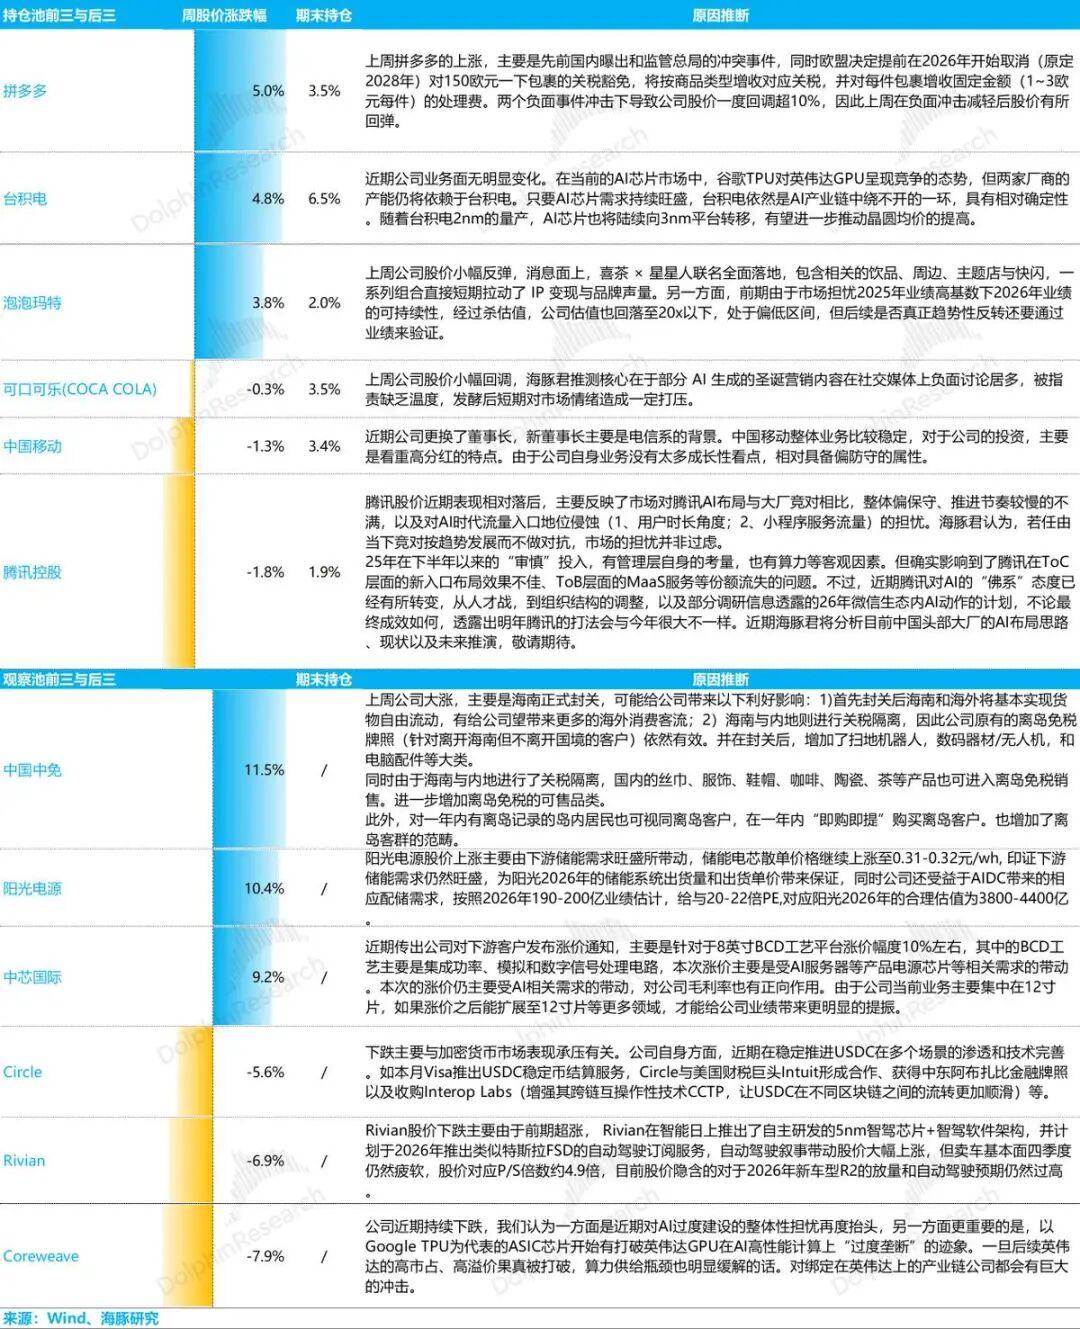
Last week, Dolphin Finance's virtual portfolio, Alpha Dolphin, outperformed the index primarily due to: a. In the equity portfolio, Dolphin Finance's allocations were biased toward stocks with robust performance. Last week, companies like Pinduoduo and TSMC showed steady recoveries; there was also less valuation for small yet promising growth stocks. b. A consistently high allocation to gold.
VI. Asset Portfolio Distribution
The Alpha Dolphin virtual portfolio holds a total of 18 individual stocks and equity ETFs, with 7 in standard allocation and the rest in underweight positions. Assets outside equities are primarily distributed in gold, U.S. Treasuries, and U.S. dollar cash. Currently, the ratio between equity assets and defensive assets (gold/U.S. Treasuries/cash) is approximately 55:45.
As of last weekend, the asset allocation distribution of Alpha Dolphin has been published in the same name article under the "Dynamic - Depth (Investment Research)" section of the Changqiao App.
- END -
// Reprint Authorization
This article is an original piece from Dolphin Research. For reprinting, please obtain authorization.
// Disclaimer and General Disclosure Notice
This report is intended solely for general comprehensive data purposes, aimed at users of Dolphin Research and its affiliated institutions for general reading and data reference. It does not take into account the specific investment objectives, investment product preferences, risk tolerance, financial situation, or special needs of any individual receiving this report. Investors must consult with independent professional advisors before making investment decisions based on this report. Any person making investment decisions based on the content or information mentioned in this report assumes their own risk. Dolphin Research shall not be held responsible for any direct or indirect liabilities or losses that may arise from the use of the data contained in this report. The information and data contained in this report are based on publicly available sources and are intended for reference purposes only. Dolphin Research strives for, but does not guarantee, the reliability, accuracy, and completeness of the relevant information and data.
The information mentioned or views expressed in this report shall not, under any jurisdiction, be considered or construed as an offer to sell securities or an invitation to buy or sell securities, nor shall it constitute advice, a quotation, or a recommendation regarding relevant securities or related financial instruments. The information, tools, and data contained in this report are not intended for, nor are they intended to be distributed to, jurisdictions where the distribution, publication, provision, or use of such information, tools, and data conflicts with applicable laws or regulations, or where it would subject Dolphin Research and/or its subsidiaries or affiliated companies to any registration or licensing requirements in such jurisdictions for citizens or residents thereof.
This report solely reflects the personal views, insights, and analytical methods of the relevant contributors and does not represent the stance of Dolphin Research and/or its affiliated institutions.
This report is produced by Dolphin Research, and the copyright is solely owned by Dolphin Research. Without the prior written consent of Dolphin Research, no institution or individual shall (i) produce, copy, duplicate, reproduce, forward, or create any form of copies or reproductions in any manner, and/or (ii) directly or indirectly redistribute or transfer to any other unauthorized person. Dolphin Research reserves all related rights.
-
![]()
ByteDance, DJI, and Xiaohongshu Secure Top Three Positions Among China’s Fastest-Growing Unicorns
-
Tesla's in-car voice system in China is finally learning to 'understand human language'
-
![]()
Foreigners Are Amazed: Chinese Electric Vehicle Drive Systems Unveil Innovative 'Poses'
-
![]()
700,000 Brothers and the Future of Robots: Behind JD.com's 'Nirvana Plan'
-
![]()
Zhipu's Trillion-Dollar Valuation: A New Chapter for China's AI
-
![]()
Is Laifen, a 'Dyson Alternative' on the Rise, Now Ensnared by the 'Alternative Curse'?
-
![]()
Beyond Patents: Insta360 and DJI Compete in Retail
-
![]()
Piercing Through Industry Chaos: The Curtain Rises on Compliance for Autonomous Driving